
Facility maintenance budget justification using CMMS data means using the reports, KPIs, and work order history stored in your Computerized Maintenance Management System to build a data-backed case for the budget your team actually needs. Instead of submitting a number and hoping leadership approves it, you walk in with downtime costs, asset failure trends, and ROI calculations pulled directly from your CMMS — and that changes the conversation entirely.
Finance teams approve budgets when they see evidence, not estimates. Yet most maintenance managers still submit budget requests based on gut feel and last year's spend, then wonder why they get cut. The good news: if you're running a CMMS, you already have everything you need to make a bulletproof case. This guide shows you exactly which data points to pull, how to frame them for decision-makers, and where common justification attempts fall flat.
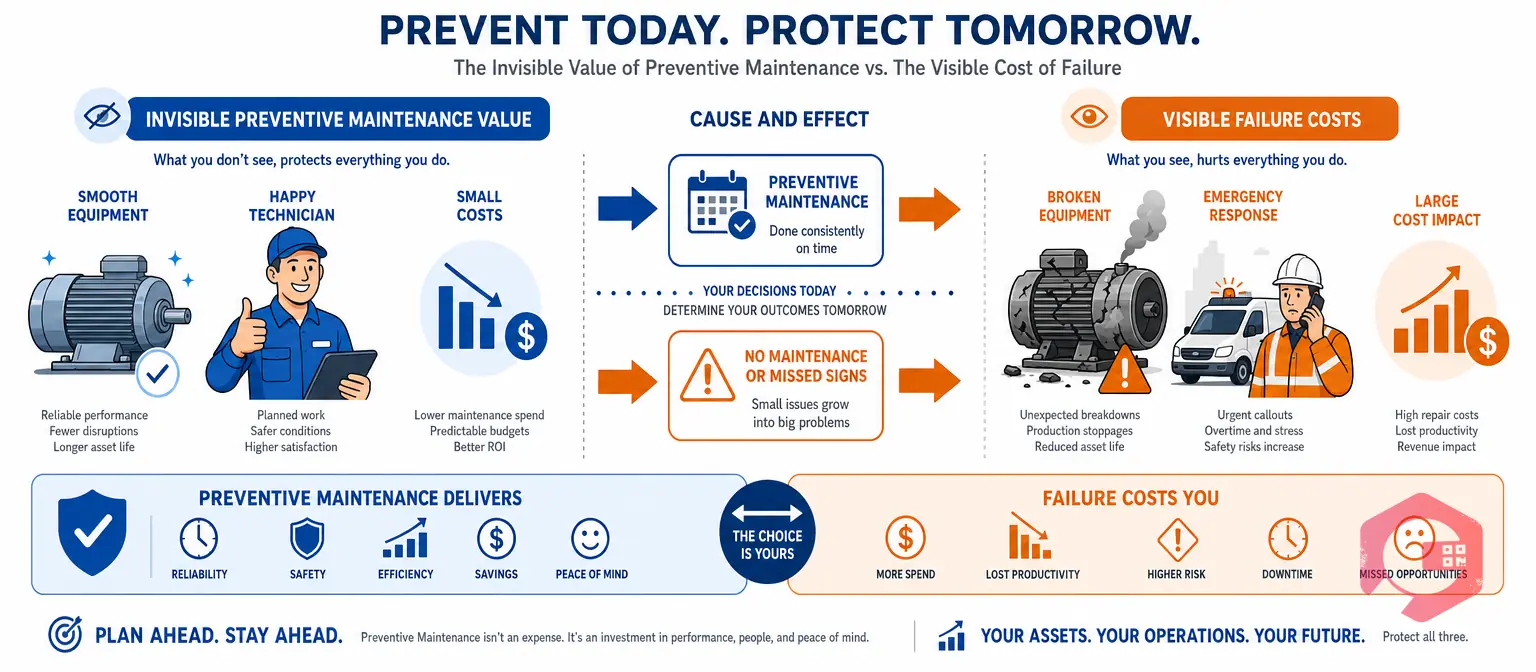
Maintenance budgets are easy targets during cost-cutting cycles because the value of maintenance is invisible when things are running smoothly. Leadership doesn't see the work that prevents failures — they only notice when something breaks. This asymmetry puts maintenance managers at a permanent disadvantage in budget conversations unless they change the frame.
Data changes that frame. When you can show that a 17-hour unplanned downtime event last March cost $43,000 in lost production and emergency labor, and that a $12,000 investment in preventive maintenance would have prevented it, you're no longer defending a cost center. You're presenting a risk management decision with a calculable return.
According to a McKinsey analysis of industrial maintenance, companies that move from reactive to planned maintenance reduce maintenance costs by 10–25% and increase equipment uptime by up to 25%. Numbers like that belong in your budget presentation.

MTBF tells you how often your critical assets fail. MTTR tells you how long it takes to get them back online. Together, they quantify your reliability baseline. If your MTBF for a critical production line is 340 hours and your MTTR is 6 hours, you can calculate exactly how much downtime you're carrying per year — and what it costs at your facility's production rate.
Pull your work order history for the last 12 months and calculate the split between planned preventive maintenance work orders and unplanned reactive/emergency work orders. Industry benchmarks from Reliable Plant put a healthy ratio at 80% planned to 20% reactive. If your facility is running at 50/50 or worse, you have a direct argument for more preventive maintenance budget — because reactive work costs 3–5× more than planned work when you factor in emergency labor rates, expedited parts, and secondary damage.
Your CMMS tracks cumulative repair spend per asset. Pull the lifetime maintenance cost for any asset approaching the end of its service life and compare it to its current replacement cost. If you've spent 70% of the replacement value keeping an aging chiller running, the data makes the capital expenditure case for you.
If your CMMS tracks parts inventory, pull stockout incidents — moments when a repair was delayed because a critical spare wasn't available. Every stockout carries a measurable cost: extended downtime, rush shipping charges, and overtime labor.
Deferred maintenance is the hidden liability in every underfunded facility budget. Work orders your team logged but never completed, PMs technicians skipped to save time, and assets flagged for repair but left running — these create a backlog that compounds over time.
From your CMMS, run a report on all open and overdue work orders older than 30 days. Categorize them by asset criticality: high-criticality assets that keep production running, medium-criticality assets that affect quality or compliance, and low-criticality assets with minimal operational impact.
According to the FMI Corporation's facility research, every $1 of deferred maintenance generates $4 in future costs when failures eventually occur. If your deferred maintenance backlog represents $75,000 in outstanding work, addressing it now costs $75,000 — but ignoring it risks $300,000+ in emergency repairs and production losses.

Data without a story doesn't persuade anyone. Your CMMS reports are the evidence — your narrative is the argument that connects the evidence to a decision.
Open with your biggest failure or downtime event from the past 12 months. Pull the full cost from your CMMS: labor hours, parts, downtime duration, and production loss. Quantify the total in dollars. Don't soften it — this is the cost of the status quo.
One incident is an event. Three incidents is a pattern. Use your CMMS trend reports to show that the conditions causing your most expensive failures are recurring, not isolated.
For each major line item in your budget request, show its specific return. Requesting $18,000 for a predictive maintenance program on your compressor fleet? Show that your compressors generated $94,000 in downtime losses last year, and that U.S. Department of Energy research shows predictive programs reduce unplanned compressor failures by 50–60%.
Regulatory non-compliance is a budget argument in itself. If your CMMS tracks compliance-related maintenance tasks — OSHA-required inspections, fire suppression system checks, pressure vessel certifications — pull any overdue items and calculate the regulatory penalty exposure.
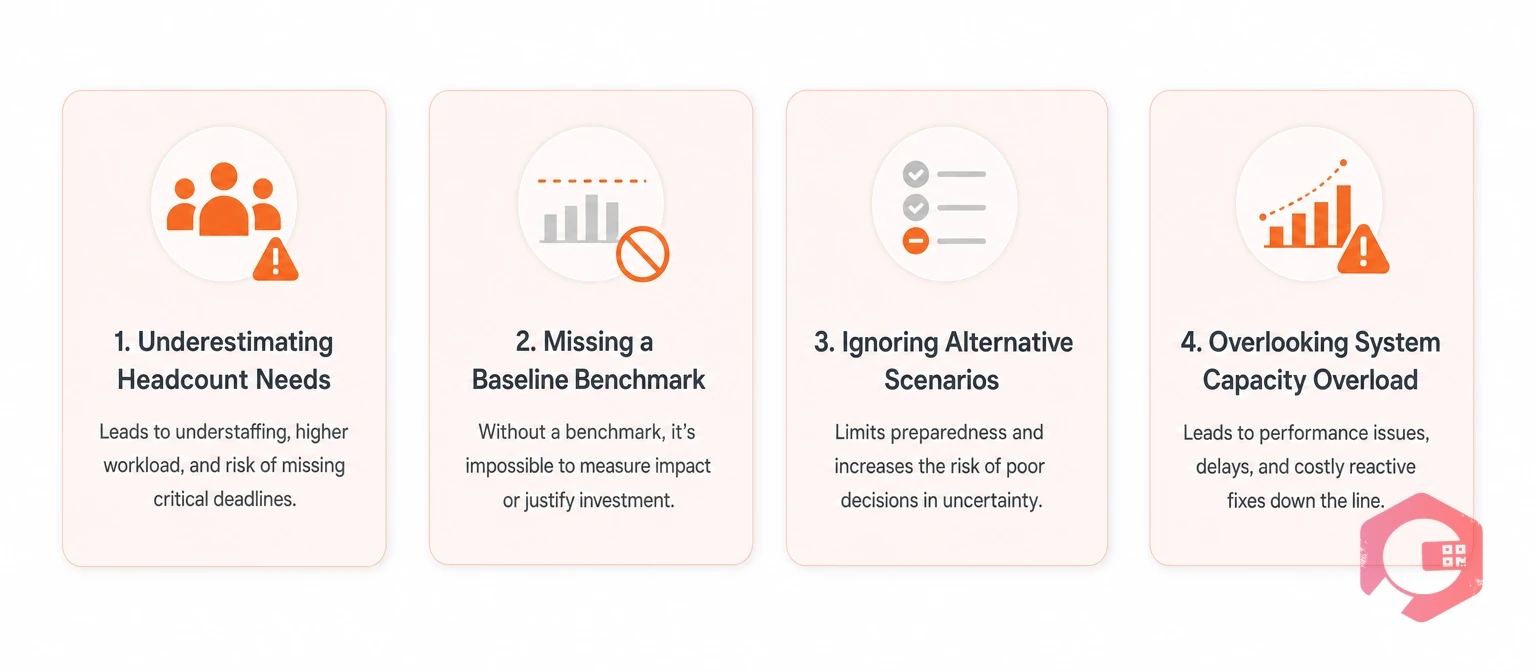
Even with solid CMMS data, budget requests fail when they're presented poorly. Avoid these common errors.
Cryotos CMMS includes a BI Dashboard and Report Builder with over 50 predefined reports — MTBF, MTTR, downtime by asset, reactive vs. preventive work order ratios, and cumulative repair costs per asset. You can schedule these reports to arrive in your inbox weekly, so your budget data is always current.
The downtime tracking module captures every unplanned stoppage by department, plant, and asset — with timestamps, labor logged, and parts consumed.
Cryotos also tracks your preventive maintenance completion rates and backlog aging. Facilities using Cryotos have reported 30% reductions in unplanned downtime — the kind of quantified outcome that belongs in every budget justification conversation.
If you're heading into your next budget cycle, Cryotos CMMS gives you the reporting infrastructure to walk into that room with confidence. Book a demo to see how the reports map to your facility's specific budget needs.
The most impactful reports are downtime cost summaries, reactive vs. preventive work order ratios, MTBF and MTTR trends, asset lifetime repair cost histories, and deferred maintenance backlog aging reports.
Pull your total unplanned downtime cost for the past 12 months from your CMMS, then estimate how much of that downtime a structured preventive maintenance program would have prevented (industry benchmarks suggest 50–70% for well-maintained assets). Compare the avoidable downtime cost to the cost of implementing the PM program. The difference is your projected ROI.
Monthly reporting gives you a rolling 12-month trend that's ideal for budget planning. Most CMMS platforms, including Cryotos, allow you to schedule automatic report delivery so your maintenance KPIs are always current. Start tracking 6–12 months before your budget cycle so you have a meaningful baseline to present.
Yes. By tracking cumulative repair costs, downtime frequency, and parts expenditure per asset, your CMMS builds the financial case for replacing aging equipment before it fails. When cumulative repair spend approaches or exceeds replacement cost — especially for high-criticality assets — the data makes the capital request self-evident.
The most effective response is to tie CMMS data to outcomes they've already experienced. If leadership remembers a specific major breakdown, pull the exact work order from your CMMS and show them the documented cost. When they see the data accurately reflecting a real event they witnessed, trust in the broader dataset typically follows.


Cryotos AI predicts failures, automates work orders, and simplifies maintenance—before problems slow you down.


