ABC and VED analysis is a method that ranks spare parts by spend and by criticality. ABC sorts each part by annual consumption value, while VED (Vital, Essential, Desirable) sorts it by how badly a stock-out would hurt operations. Used together, the two rankings show maintenance teams which MRO parts to protect, which to control tightly, and which to stop over-stocking.
This guide shows how to run the analysis step by step, build the nine-cell ABC-VED matrix, and set a stocking rule for each cell. Then load the results into a Computerized Maintenance Management System (CMMS), so reorder levels and counts follow each class.
Key Takeaways
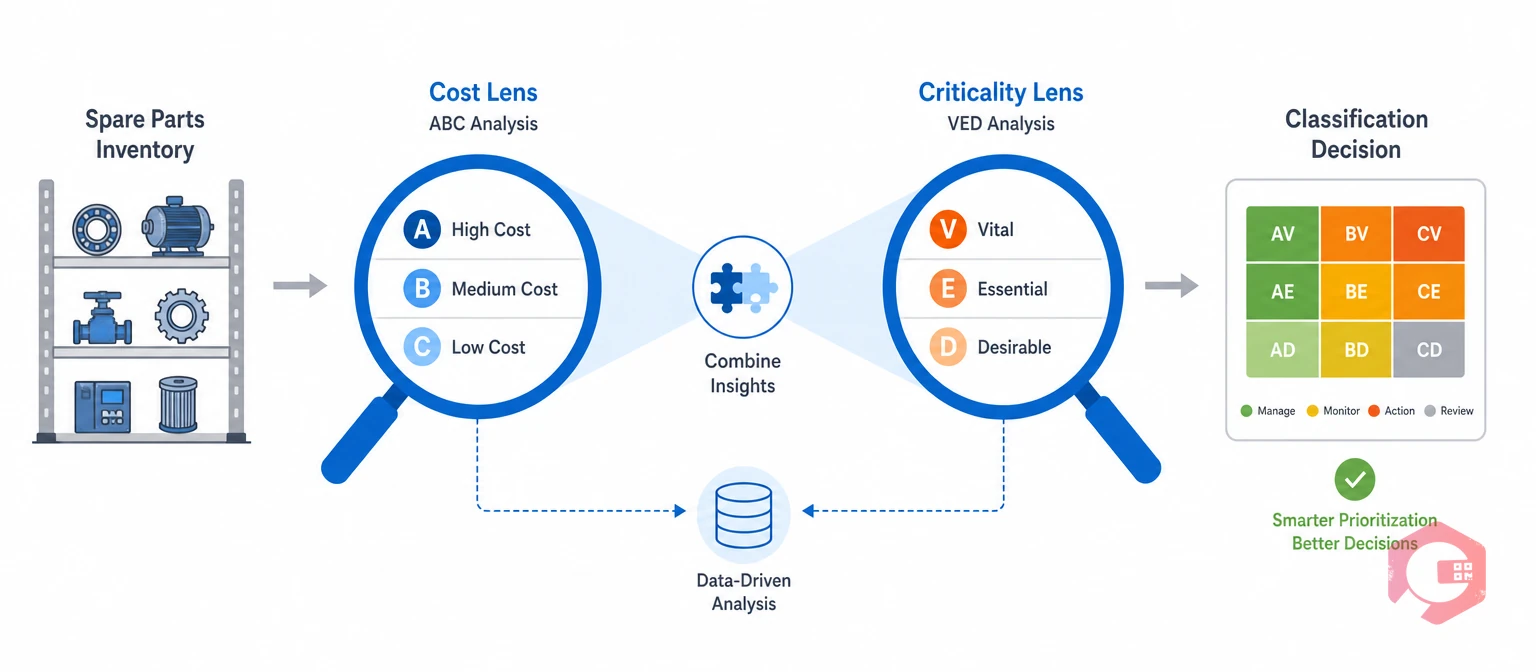
ABC analysis is a ranking of parts by annual consumption value, from Class A (highest) to Class C (lowest). It applies the Pareto principle to stock, because a small share of parts usually drives most of the spend.
VED analysis is a ranking of parts by how badly a stock-out would hurt operations. Vital parts stop production or create a safety risk. Essential parts cause disruption that a short workaround can absorb. Desirable parts have little or no immediate effect.
ISO 55000 asset management guidance expects spares decisions to reflect risk. VED supplies that risk view, while ABC keeps maintenance costs in check. Combined, ABC and VED analysis balances equipment availability against the cash tied up in stock.
MRO spare parts need both lenses because their demand is intermittent, so usage value alone hides the parts that matter most. A $60 sensor that fails once every three years has almost no consumption value, yet its absence can stop a line for days.
Production inventory moves in steady volumes, while MRO stock sits on the shelf until a failure. Most maintenance teams find that their costliest parts are not their riskiest ones, and ABC and VED analysis separates cost from consequence, so each rule reflects both.
ABC tells you where the money is, and VED tells you where the risk is. The table compares the two methods side by side.
| Dimension | ABC analysis | VED analysis |
|---|---|---|
| Basis | Annual consumption value (usage × unit cost) | Criticality of the part to operations |
| Question answered | Where is our money tied up? | What happens if we run out? |
| Categories | A, B, C | Vital, Essential, Desirable |
| Who decides | Stores or finance, from data | Maintenance and operations, by judgment |
| Main weakness | Ignores how important a part is | Subjective, and tends to label too many parts Vital |
Run ABC first because it uses data, then agree VED scores with the people who run the equipment. Each method covers the other’s blind spot.
Want these rules applied automatically? Cryotos inventory management links each class to reorder levels, QR-based stock counts, and low-stock alerts.
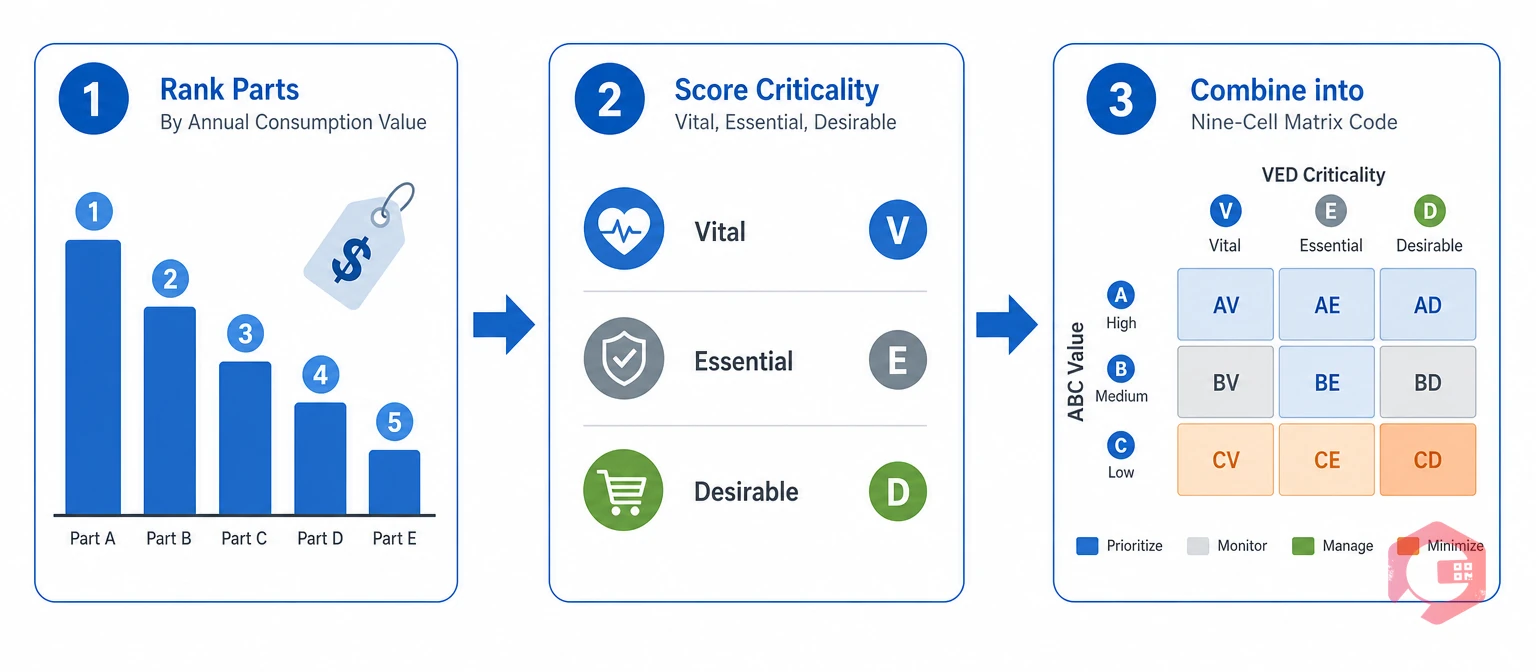
To run ABC and VED analysis, rank parts by annual consumption value, score each part’s criticality, and combine the two results into one class. Most maintenance teams complete a first pass in a day from an item master export.
Multiply annual usage by unit cost for each part, sort from highest to lowest, and calculate each part’s cumulative share of total value. Assign Class A until you reach about 70–80% of value, Class B up to about 95%, and Class C to the rest. If total annual spend is $500,000, Class A parts add up to roughly $350,000–$400,000 of it.
Ask the same three questions for every part, with maintenance, production, and safety staff in the room:
Teams with an existing failure mode and effects analysis or reliability-centered maintenance program can reuse its criticality rankings.
Tag each part with a two-letter code such as AV or CE. Review every AV, BV, and CV part with the equipment owner before you finalize the list, because those codes carry the most operational risk.

An ABC-VED matrix is a nine-cell grid that sets one stocking rule for every combination of value and criticality. Use the table as a starting point, then adjust it to your lead times and budget.
| Cell | Example MRO part | Stocking rule | Cycle count |
|---|---|---|---|
| AV | Main gearbox for a key line | Hold one spare, track closely, agree supplier lead time | Monthly |
| AE | Servo drive module | Min-max levels with safety stock | Quarterly |
| AD | Spare motor for a non-critical line | Buy on demand, hold no stock | Quarterly |
| BV | Safety relay | Always keep safety stock on the shelf | Monthly |
| BE | Standard bearings | Min-max reorder points | Quarterly |
| BD | Guard panels | Small stock, reorder on use | Twice a year |
| CV | Emergency stop switch | Overstock on purpose, never run out | Quarterly |
| CE | Belts and filters | Bulk buy with a two-bin system | Twice a year |
| CD | Cleaning supplies | Bulk buy, minimal control | Yearly |
The ABC-VED Decision Ladder:
With the ladder, ABC and VED analysis turns a long parts list into three clear stocking policies.
Count A-class and Vital cells most often, because record errors there cost the most. Review the grid after every yearly run. Parts move cells when usage, price, or criticality changes, and a part that jumps from CD to CV needs action at once.
A worked example shows how the two rankings change a stocking decision. The values below are illustrative figures from a 400-part catalog.
| Part | Annual value | ABC class | VED class | Cell |
|---|---|---|---|---|
| Main gearbox | $48,000 | A | Vital | AV |
| Servo drive module | $30,000 | A | Essential | AE |
| Safety relay | $6,500 | B | Vital | BV |
| Standard bearings | $5,000 | B | Essential | BE |
| Emergency stop switch | $900 | C | Vital | CV |
| Cleaning supplies | $700 | C | Desirable | CD |
The emergency stop switch costs only $900 a year, yet its Vital rating means the store always holds stock. The servo drive is expensive and Essential, so it gets min-max control instead of bulk buying. Value alone would have ranked the switch last, while criticality moves it to the top. Three of the six parts are Vital, yet only one of them is expensive, which is why value alone cannot set the stocking rule.
A 30-day rollout is realistic for most single-site stores, because the heavy work is data cleanup and one workshop.
Starting with one storeroom or one critical line proves the method before you extend it to every site.
Most classification failures have three causes: stale data, inflated criticality scores, and one-time exercises.
Fixing these mistakes costs little and makes every later stocking decision more reliable.
A Computerized Maintenance Management System keeps ABC and VED classes live instead of leaving them in a spreadsheet that goes out of date.
Maintenance teams using Cryotos have reported up to 30% reduction in unplanned downtime and 25% faster repair turnaround. Vital parts on the shelf are one of the levers behind faster repairs.
It is a two-way classification of stock. ABC ranks items by annual consumption value, and VED ranks them by how critical they are to operations. Together they decide how much stock to hold and how closely to control each item.
ABC analysis is based on data about usage and cost, and it shows where your money is tied up. VED analysis is based on judgment about operational risk, and it shows which parts you cannot afford to run out of.
Redo it at least once a year. Also repeat it after major equipment changes, new suppliers, or a large shift in production, because each one changes usage and criticality.
Yes. A spreadsheet with usage, unit cost, and a criticality score is enough to start. Software becomes valuable once the part count grows and you need class-based alerts and counts.
Clear classes turn a crowded storeroom into a controlled one. Schedule a free demo to see how Cryotos applies stocking rules, counts, and alerts to every ABC-VED class.


Cryotos AI predicts failures, automates work orders, and simplifies maintenance—before problems slow you down.