

To forecast spare parts demand for intermittent MRO usage, classify each part by demand pattern, split planned from unplanned use, and size reorder points over the supplier lead time. Plain averages fail because most months show zero demand, then one breakdown uses several units at once. A Computerized Maintenance Management System supplies the work order, asset, and stock data that make this possible.
Below are five steps maintenance teams use to turn sporadic usage into dependable stocking decisions, with a worked example you can copy.
Key Takeaways

Intermittent demand is a usage pattern with many zero-demand periods interrupted by occasional orders of uneven size. Most MRO parts follow it, because they are used when something fails or when planned work calls for them.
Picture a bearing used over 12 months: 0, 0, 3, 0, 0, 0, 1, 0, 0, 5, 0, 0. The average is 0.75 units a month, yet no month ever shows 0.75. Teams that forecast spare parts demand from that average will miss almost every month.
ISO 55000 asset management guidance ties stock decisions to risk and value, so a missed critical part is a business risk and not only a purchasing error. The framework below organizes the work.
The Five-S Intermittent Demand Framework:
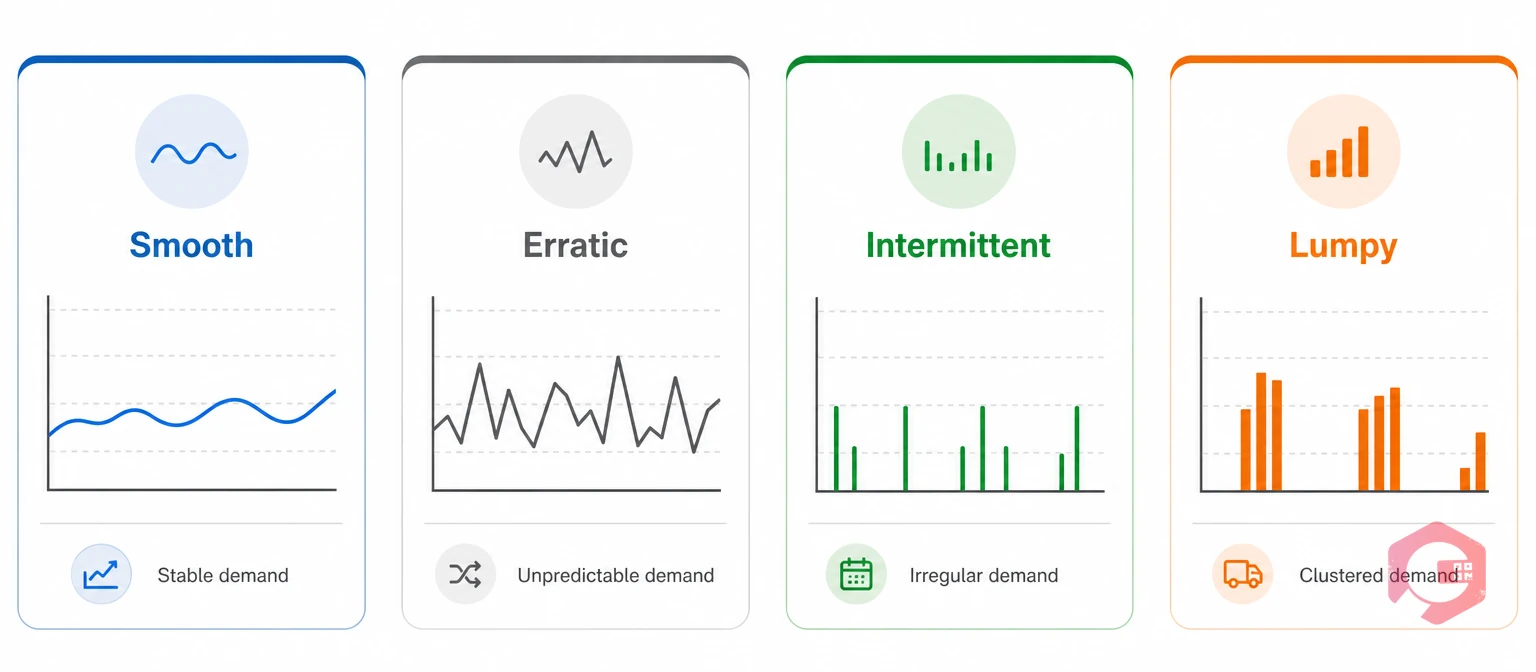
Average demand interval (ADI) is the average number of periods between demand events. The squared coefficient of variation (CV²) measures how much non-zero order sizes vary.
Syntetos, Boylan, and Croston proposed cutoffs near 1.32 for ADI and 0.49 for CV² to separate four patterns. Before you forecast spare parts demand, tag every part with one of them.
| Pattern | ADI | CV² | MRO example | Starting method |
|---|---|---|---|---|
| Smooth | Below 1.32 | Below 0.49 | Filters and lubricants. | Moving average or exponential smoothing. |
| Erratic | Below 1.32 | 0.49 or more | Frequent use with uneven quantities. | Exponential smoothing with extra safety stock. |
| Intermittent | 1.32 or more | Below 0.49 | Seals, belts, and bearings. | Croston-family methods, such as SBA. |
| Lumpy | 1.32 or more | 0.49 or more | Motor and gearbox parts used in breakdowns. | SBA, TSB, or bootstrapping. |
The bearing above has three events in 12 months, so its ADI is 4.0. Its CV² is about 0.30 to 0.44, depending on the variance method, which makes it intermittent. With only three events, recheck the class as history grows.
Fix these first, because every later step inherits the errors.
To forecast spare parts demand accurately, forecast scheduled usage directly and apply statistics only to breakdown usage. Mixed history teaches a model your maintenance calendar instead of failure behavior.
Remove planned usage from history first, or the same part gets counted twice. A PM task that replaces a filter every quarter needs a filter every quarter, so reserve that part against the scheduled work order and keep it out of the statistical forecast.
Need a starting point? Audit part records with the MRO inventory checklist before you forecast.
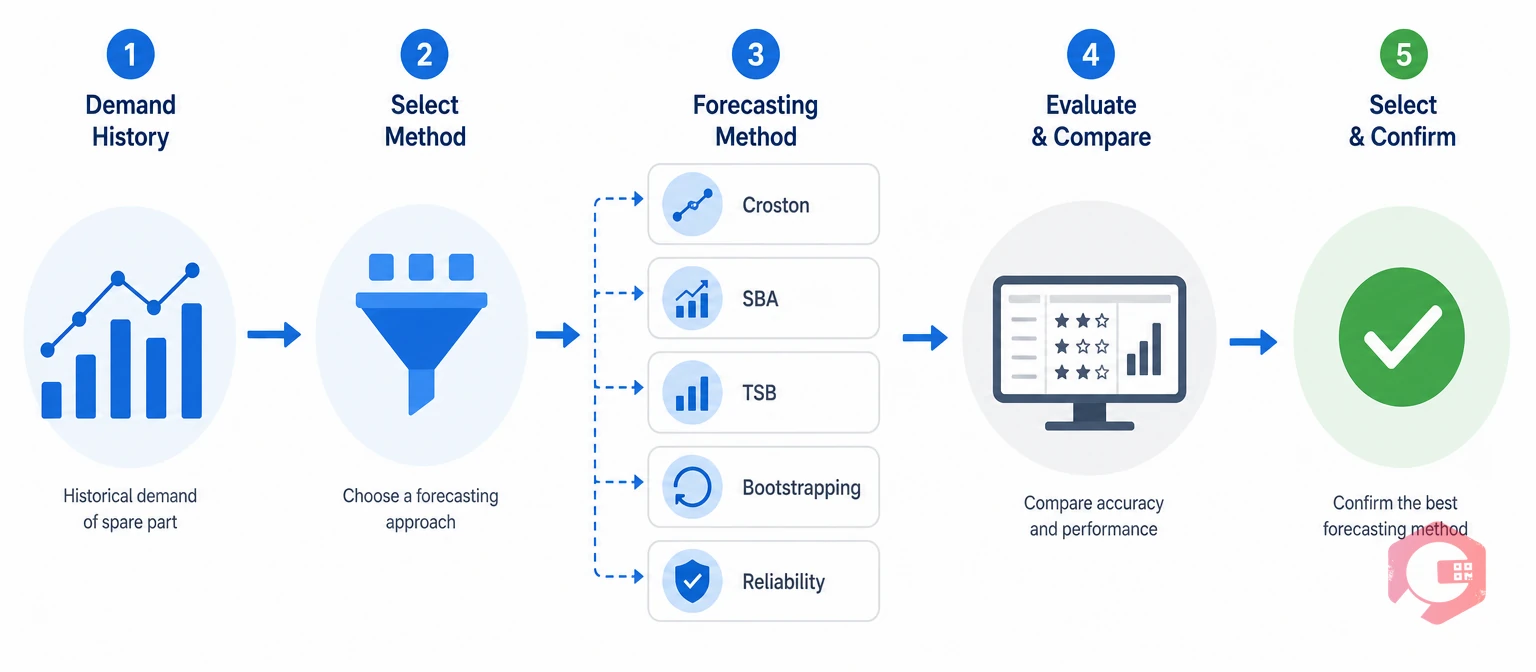
The right method depends on whether a part is intermittent or lumpy. Averages overreact to the last breakdown and drift low between events, so these items need methods that model order size and timing separately.
| Method | How it works | Best for | Watch-out |
|---|---|---|---|
| Croston | Smooths order size and interval separately. Forecast is size divided by interval. | Intermittent items. | Tends to overestimate. |
| SBA | Croston with a bias correction. | Intermittent and many lumpy items. A strong default. | Slow to react when demand stops. |
| TSB | Updates the probability of demand every period. | Slow movers nearing obsolescence. | More parameters to tune. |
| Bootstrapping | Resamples history to simulate demand over the lead time. | Lumpy items with decent history. | Needs enough data. |
| Reliability-based | Multiplies failure rate by installed units. | Critical parts with short history. | Needs clean asset and failure data. |
SBA corrects the upward bias of Croston by multiplying its forecast by one minus half the smoothing constant. With a constant of 0.1, that trims the forecast by 5%.
Test two or three methods on a holdout period and keep the one that meets your service target with the least stock. For short histories, estimate failures from the mean time between failures and the number of installed units.

Reorder point is the stock level that triggers a new order so parts arrive before demand exhausts supply. To size it, forecast spare parts demand over the supplier lead time and pick the percentile that matches your service target.
Suppose a part has demand events averaging 0.5 per month, one unit each, and a two-month lead time. Demand over the lead time then follows a Poisson distribution with a mean of 1.0.
Parts come in whole units, so a 95% target delivers about 98% here. Add a buffer for late deliveries using standard safety stock logic.
Lead-time variability matters as much as demand variability. Track actual delivery times by supplier, use the slowest realistic delivery for critical parts, and rerun the calculation whenever usage or lead time changes.
Statistics cannot value a part that stops the line, so set policy by criticality as well as usage.
Insurance spares deserve a plan of their own. Share one unit across sites, agree repair-and-return terms with the supplier, or negotiate guaranteed availability, and review each part on a fixed schedule.
Then track bias, mean absolute error, service level achieved, stockout days, and the share of slow-moving stock. Skip percentage-error metrics, which break down when demand is zero.
Most maintenance teams gain the most from cleaner records. Link every issue to a work order and asset, remove returns and transfers, and merge superseded part numbers.
The most common mistakes are treating every part the same, mixing planned and unplanned usage, and removing slow movers that protect production.
Cryotos holds the work order, asset, PM schedule, and stock data that drive spare parts demand in one mobile-first platform.
Maintenance teams using Cryotos have reported up to 30% reduction in unplanned downtime and 25% faster repair turnaround. Explore the spare parts inventory software to see how these views fit your storeroom.
Usually a statistical forecast adds little. Decide by criticality and lead time, hold one insurance spare if downtime is costly, and review the part on a schedule.
It treats zeros as normal data, so it jumps after a breakdown and drifts low between events. That causes repeated stockouts or excess stock.
SBA, TSB, and bootstrapping are common starting points. Test them on a holdout period and keep the one that meets your service target with the least stock.
More history improves estimates, but many MRO parts never gather enough. For short histories, pool data across similar parts or use failure-rate estimates.
Use bias, mean absolute error or scaled error, and service level achieved. Percentage error fails when demand is zero.
Reliable stocking starts with clean data and a method built for sporadic usage. Schedule a free demo to see how Cryotos supports your spare parts decisions.



Cryotos AI predicts failures, automates work orders, and simplifies maintenance—before problems slow you down.



