A maintenance team structure is the way a maintenance department arranges its roles, reporting lines, crews, and skills to get work done. The best structure is not copied from another plant. It comes from your own data on how much work arrives, where technician time goes, and which results the team delivers. When the structure fits the work, backlog falls, wrench time rises, and fewer breakdowns wait for the right person.
Many teams change their structure only when someone leaves or overtime gets out of hand. This guide shows how to use workload, utilization, and performance data to design a maintenance team structure on purpose. It covers the common models, the ratios that matter, a five-step review method, and a worked example.
Key Takeaways

A maintenance team structure defines who does what, who reports to whom, and how work flows from request to completion. It is one part of the wider organizational structure of a plant or facility.
Small teams combine several roles in one person. Large teams split them into separate jobs. In both cases, the maintenance team structure decides whether each role has enough time to do its job well.
Most plants use one of four structure models, or a mix of them. Each one suits a different kind of site and workload.
| Model | How It Works | Best Fit | Watch Out For |
|---|---|---|---|
| Centralized | One shared crew serves the whole site from a central shop. | Compact sites with mixed equipment and steady demand. | Long travel time and weaker ownership of specific areas. |
| Area-based | Dedicated crews own a production area or line. | Large sites, many lines, or continuous production. | Uneven workload between areas and duplicated skills. |
| Hybrid | Area crews handle daily work, while a central group covers specialist skills, planning, and shutdowns. | Mid to large plants that need both ownership and depth. | Unclear handoffs between area and central teams. |
| Operator-led | Operators do basic care, and maintenance focuses on skilled work, as in total productive maintenance. | Plants with stable processes and trained operators. | Needs training, clear task lists, and production buy-in. |
The operator-led model follows the ideas of total productive maintenance, where operators own daily cleaning, inspection, and lubrication. Many plants mix it with a hybrid structure for skilled work.
No model is best everywhere. The data in the next sections shows which one fits your work.
Three types of data tell you whether your maintenance team structure fits the work: workload, utilization, and performance. Together they show demand, capacity, and results.
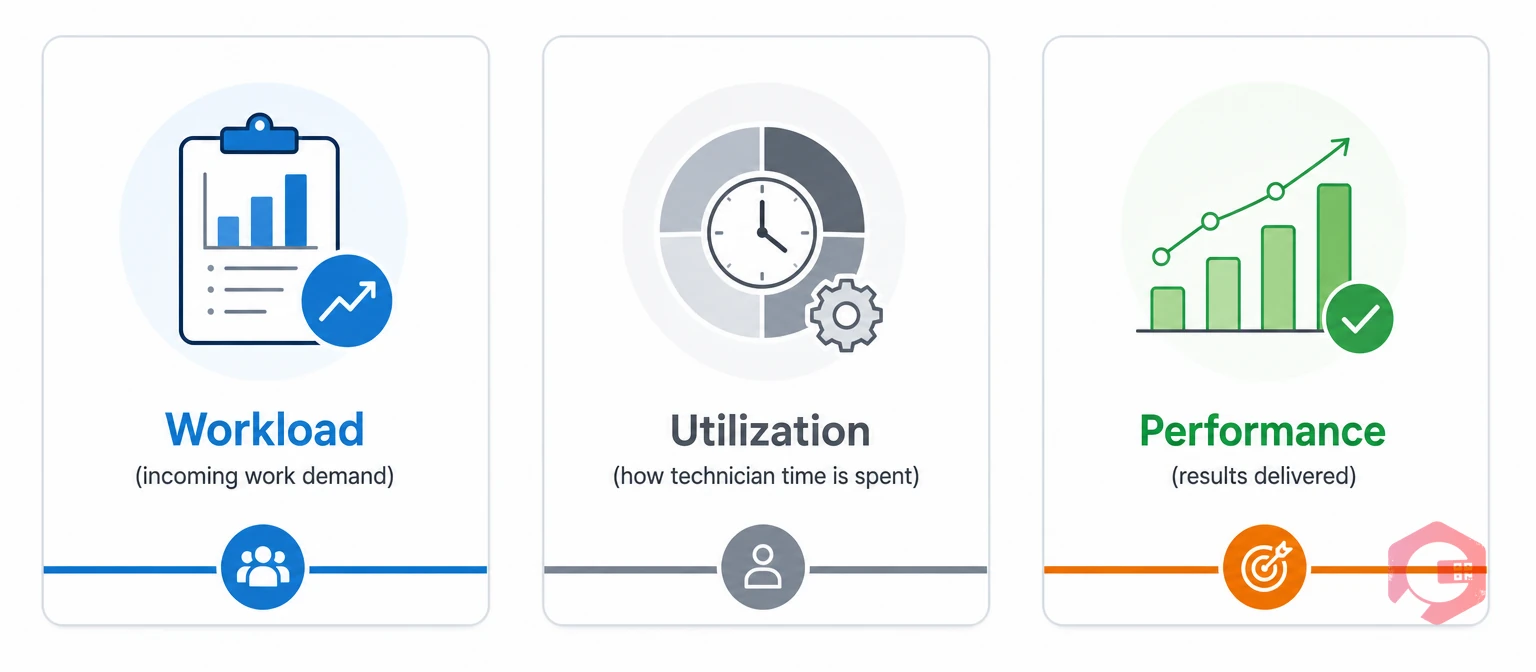
Technician utilization is the share of paid hours that technicians spend on productive maintenance work. It sits between workload and performance, because it shows how well the structure turns available hours into finished jobs.
Curious how much of your team's day is real hands-on work? Estimate it with the free Cryotos wrench time calculator.
Workload data answers the first structure question: is there more work than the team can handle, or is the work sitting in the wrong place? Collect at least eight to twelve weeks of history before you decide.
Backlog in crew-weeks is the amount of ready work measured in weeks of crew capacity. For example, 1,200 hours of backlog with 12 technicians who each have 32 hours a week for planned work gives about 3.1 weeks of backlog. Many planning guides suggest keeping ready backlog in the range of two to four weeks.
If backlog keeps growing in one craft but not others, the problem is skill mix, not headcount. That is a structure change, not a hiring decision.
Utilization data shows whether the current maintenance team structure wastes capacity. Many first-time studies find that technicians spend well under half of their paid time on hands-on work.
Wrench time is the share of a technician's paid time spent working hands-on with equipment. The rest goes to activities that a better structure can often reduce.
Log time categories on work orders for a few weeks, or run a short observation study. The pattern of losses tells you which part of the structure to fix first.
Performance data tells you whether a structure change helped. Track the same measures before and after any change.
The Society for Maintenance and Reliability Professionals (SMRP) publishes standard definitions for many of these workforce and work management metrics, which helps you compare results over time.
Show these numbers on a maintenance KPI dashboard, so supervisors and managers see the same picture every week.
Ratios help you check whether each role in the maintenance team structure has a workable load. Treat them as starting points, not rules.
| Ratio | Common Guideline | Signs It Is Off |
|---|---|---|
| Planners to technicians | About 1 planner for every 15 to 25 technicians. | Jobs start without parts or plans, and wrench time stays low. |
| Supervisor span of control | Often 8 to 12 technicians per supervisor. | Supervisors spend all day firefighting and never coach or check work. |
| Ready backlog | About 2 to 4 crew-weeks. | Below 2 means idle time risk, and above 4 means work is falling behind. |
| Planned work share | Many teams aim for most hours to be planned. | Emergency work crowds out PM and planned repairs. |
| Overtime rate | Low and steady, with spikes only for shutdowns. | Constant high overtime in one shift or craft. |
Span of control matters more than most teams expect. When a supervisor leads too many people, planning, coaching, and safety checks are the first tasks to slip.
A structured review stops restructuring from becoming a reaction to the latest crisis. Use one repeatable method.
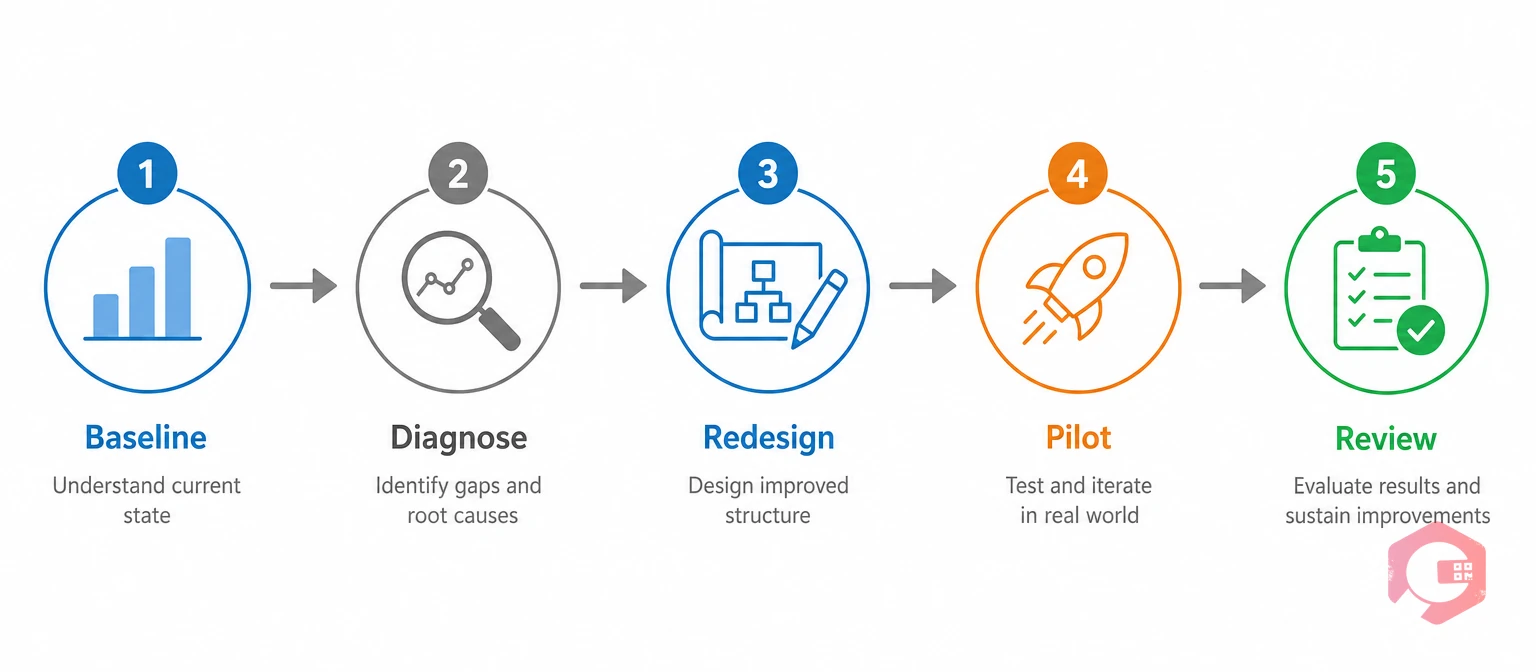
The Five-Step Structure Review Method:
Most facilities find that a small change, such as adding one planner or splitting one crew, delivers more than a full reorganization.
The diagnosis step works best with a simple lookup between what the data shows and what to change.
Each fix should link to a measure you expect to move, so the pilot has a clear test.
This example is illustrative, based on patterns common in mid-sized plants. A plant ran a centralized crew of 24 technicians and one supervisor who also did all planning. Over ten weeks, the data showed:
The team made three changes. It added one dedicated planner, split the crew into two area-based teams with a crew lead each, and moved basic lubrication and cleaning to operators on two lines. Headcount stayed the same.
After a two-month pilot, the team tracked the same metrics against the baseline. The test was simple: did backlog, wrench time, and schedule compliance move in the right direction? That evidence, not opinion, decided whether to keep the new maintenance team structure.
Most restructures fail because of how the change is made, not the model chosen. Watch for these traps:
Teams that successfully restructure keep changes small, measured, and reversible.
A Computerized Maintenance Management System captures the data a maintenance team structure review needs as a by-product of daily work.

With that data in one place, structure decisions become faster and easier to defend. Maintenance teams using Cryotos have reported up to 30% reduction in unplanned downtime and 25% faster repair turnaround. Better-organized teams spend more time on planned work and less time reacting.
Connecting team performance to plant results such as overall equipment effectiveness shows leadership why the structure matters.
There is no single best structure. Centralized teams suit compact sites, area-based teams suit large sites with many lines, and hybrid models suit most mid to large plants. Your workload, utilization, and performance data should decide.
A common guideline is about one planner for every 15 to 25 technicians. Teams with complex work, many contractors, or frequent shutdowns may need more planning support.
Look for backlog that keeps growing beyond about four crew-weeks, constant overtime, and falling PM compliance. Check utilization first, because low wrench time can make a team look understaffed when the real problem is lost time.
It depends on how you define productive time. Many first-time wrench time studies find hands-on work well below half of paid hours, so the aim is steady improvement rather than a single target.
Review the structure at least once a year, and also after major changes such as new lines, new equipment, or a big shift in the work mix.
Often, yes. Moving basic cleaning, inspection, and lubrication to trained operators frees skilled technicians for complex work. It needs clear task lists, training, and support from production leaders.
The right maintenance team structure comes from your own data, not from guesswork. Schedule a free demo to see how Cryotos tracks workload, technician time, and team performance in one place.


Cryotos AI predicts failures, automates work orders, and simplifies maintenance—before problems slow you down.