

The RAM triangle is the framework maintenance teams use to measure availability, reliability, and maintainability as three separate but connected metrics. Reliability measures how often an asset fails. Maintainability measures how fast it gets fixed. Availability measures whether it's ready to run right now. Most teams track one blended uptime number instead. That habit leads them to fix the wrong problem. A team might redesign an asset that just needs faster spare parts, or restock parts when the real issue is a design flaw that keeps causing failures.
Key Takeaways

The RAM triangle is a model that splits asset performance into three related metrics: reliability, availability, and maintainability. Each corner of the triangle asks a different question. Pulling on one corner changes the shape of the other two.
The RAM Triangle Framework:
Teams that treat these three as one number tend to get stuck. Reliability is a measure of failure frequency, not repair speed. A reliable asset can still sit broken for days if nobody plans for fast repair. An asset that rarely fails but takes three days to fix can post the same availability percentage as an asset that fails weekly but gets fixed in twenty minutes. The uptime chart looks identical on paper. The fix required is completely different. That difference is the whole reason maintenance managers split the triangle into three parts instead of one KPI.
Reliability engineering treats availability, reliability, and maintainability as a standard trio, as summarized on Wikipedia's reliability engineering overview. Each metric drives a different engineering decision. One might shape component selection. Another might set inspection intervals. A third might set spare parts strategy.

Availability, reliability, and maintainability differ in what they measure, how each gets calculated, and what actually improves them. The table below breaks down every corner of the RAM triangle side by side.
| Metric | What It Measures | Common Formula | Improved By |
|---|---|---|---|
| Reliability | Failure frequency over time | MTBF = Total operating time ÷ Number of failures | Better PM, root cause fixes, asset redesign |
| Maintainability | Speed of repair after failure | MTTR = Total repair time ÷ Number of repairs | Faster diagnostics, parts on hand, clear procedures |
| Availability | Uptime when the asset is needed | Availability = MTBF ÷ (MTBF + MTTR) | Improving reliability, maintainability, or both |
Availability sits at the bottom of that formula. It's a downstream result, not a lever a team can pull on its own. Maintenance teams that want to raise availability have to decide which of the other two corners they will work on first.
Reliability gets measured mainly through Mean Time Between Failures, or MTBF. MTBF is the average operating time between one failure and the next. A pump that runs 2,000 hours between failures is more reliable than one that fails every 400 hours. That's true no matter how quickly either one gets repaired.
MTBF only means something when failure data gets captured the same way every time. Most teams that report an MTBF number are actually working from whatever got typed into a work order's free-text field. That makes trend analysis close to useless. Structured failure logging fixes this problem. It captures failure mode, affected component, detection method, and downtime start and end in fields a report can query. That structure is what makes MTBF comparable across assets, lines, and time periods in the first place.
Reliability-centered maintenance treats a dropping MTBF as an early warning, not just a scorecard number. Calculating MTBF from timestamped work order data works better than rebuilding it monthly in a spreadsheet. A live MTBF calculation lets a team catch a downward trend while there's still time to act on it. The standard MTBF definition used across reliability engineering treats every recorded failure the same way. That consistency is exactly why clean data capture matters so much.

Maintainability gets measured through Mean Time to Repair, or MTTR. MTTR is the average time from when a failure starts to when the asset is back in service. It covers diagnosis time, parts retrieval time, and hands-on repair time combined, not just the wrench-turning part.
Maintainability is the speed and ease of restoring a failed asset to service. It's usually the fastest lever a team can pull to raise availability. Redesigning a machine for higher reliability can take months. Cutting MTTR by fixing a parts bottleneck can happen in weeks.
Most facilities discover their MTTR is dominated by the parts and diagnosis stages, not the actual repair. Breaking MTTR into three parts shows exactly where repair time gets lost. Often the biggest maintainability gains come from parts logistics or better diagnostic information. They rarely come from technicians simply moving faster.
Running an MTTR calculation against real timestamps gives a maintenance manager an honest picture of which stage actually needs fixing, instead of relying on technician memory. The general MTTR framework used in maintainability engineering breaks repair time down the same way. That's why the three-stage split works well across most industries.
Ready to see where your own repair time goes? Track downtime by cause and get a clear breakdown of diagnosis, parts, and repair time on every work order.
Cryotos gives maintenance teams a structured way to measure all three points of the RAM triangle. It uses the same system that runs day-to-day maintenance work, so nothing gets rebuilt after the fact in a spreadsheet.
Cryotos continuously tracks asset state: running, idle, under repair, or down. It rolls this up into live availability percentages by asset, asset class, line, or site. Managers see exactly how much operating time is being lost, and to what, without waiting for an end-of-month report. That live view matters most during shift changes, when the previous crew's downtime notes are the only record of what actually happened on the floor.
Every work order and incident gets timestamped from creation to resolution. Cryotos uses this data to calculate MTBF, MTTR, and Mean Time to Acknowledge, or MTTA. These are the core reliability and maintainability metrics, calculated without manual data entry or spreadsheet formulas. Most facilities that switch from manual tracking discover their old MTBF numbers were off by a wide margin. That's usually because nobody was logging failure start times consistently before.
Failures get captured through structured forms: failure mode, affected component, detection method, downtime start and end. This replaces free text entirely. Structured capture is what makes reliability data comparable across assets and time periods. That's the only way MTBF and MTTR trend analysis works in practice. A free-text field might say "pump broke again." A structured form captures which seal failed, how it was detected, and exactly how long the asset sat down, all in fields a report can actually query.
When a failure gets logged, Cryotos can auto-generate a corrective work order. It routes that work order to the technician with the right skill set, parts availability, and proximity. Faster routing improves maintainability directly, since routing speed is part of the time-to-repair half of the availability equation. A work order that sits in a queue for two hours before anyone sees it adds two hours to MTTR before a wrench even gets picked up.
Preventive maintenance schedules in Cryotos can adjust based on observed MTBF trends instead of fixed calendar intervals. Say an asset maintenance management class starts failing more often than its PM interval assumes. Cryotos flags it so the schedule can tighten before availability drops further. This closes a gap most PM programs never catch: a fixed 90-day interval that was fine two years ago but is now too loose for a machine that's aging faster than expected.
Cryotos links assets to their spare parts inventory and qualified technician list. Low parts stock or technician shortages become visible before they turn into extended repair windows. This addresses the maintainability side of the triangle before it becomes a problem, instead of after.
Cryotos combines reliability, maintainability, and availability into a single asset health score. Maintenance teams use this one number to prioritize capital replacement, redesign, or process changes across a large fleet. They don't need to pull three separate reports to build the case.
Once availability, reliability, and maintainability get measured consistently, they stop being a scorecard. They start acting like a decision engine that points to a specific fix instead of a vague uptime complaint.
Every failure event ties back to the asset's complete history: prior failures, work orders, parts replaced, and PM intervals. When a technician investigates why MTBF is dropping on a specific asset, they see the full timeline. They don't have to rely on memory or a handover note scribbled at shift change.
Separating downtime into planned categories, like PM and changeovers, and unplanned maintenance, like failures and waiting on parts or technicians, shows leadership something important. It reveals whether an availability loss is a reliability problem, a maintainability problem, or a scheduling problem. Those three problems need three different fixes. Lumping them into one downtime number hides which one actually applies. A plant that blames "unreliable equipment" for a downtime spike sometimes finds the real cause was a scheduling conflict that had nothing to do with the machine itself.
Comparing MTBF and MTTR across a whole equipment class, not just one machine, reveals something a single-asset view misses. It shows whether a single unit has a local issue, or whether the entire class is trending toward a reliability or maintainability problem that needs a design or process-level fix. Teams that only look at one asset at a time tend to miss this pattern completely. They treat each failure as an isolated event instead of part of a bigger trend.
The cost of lost availability, the frequency of failure, and the cost of repair can all be made visible by asset and asset class. Once that happens, the business case for replacing, redesigning, or investing in an asset becomes a number instead of a judgment call. This is where downtime tracking data turns into a capital planning argument a finance team can actually evaluate. It stops being an anecdote about "that machine that's always down."
Some industries face audits over uptime and repair response: utilities, pharma, healthcare, and food and beverage among them. In those industries, every availability and reliability figure needs to trace back to timestamped system data. It can't be a spreadsheet built the week before an audit. Maintenance teams using Cryotos have reported up to 30% reduction in unplanned downtime and 25% faster repair turnaround once availability, reliability, and maintainability get tracked from one system instead of three separate spreadsheets.
Most RAM triangle mistakes come from collapsing three metrics into one number too early, before anyone has looked at what's actually driving it.
Most facilities that fix these mistakes start the same way. They separate their downtime data into the three RAM categories before setting a single new KPI target. That one step usually surfaces which corner of the triangle needs attention first. It also stops budget from going toward the wrong fix, which is the most common and most expensive mistake of all. A team that skips this step often spends a full budget cycle on a fix that never touches the real problem.
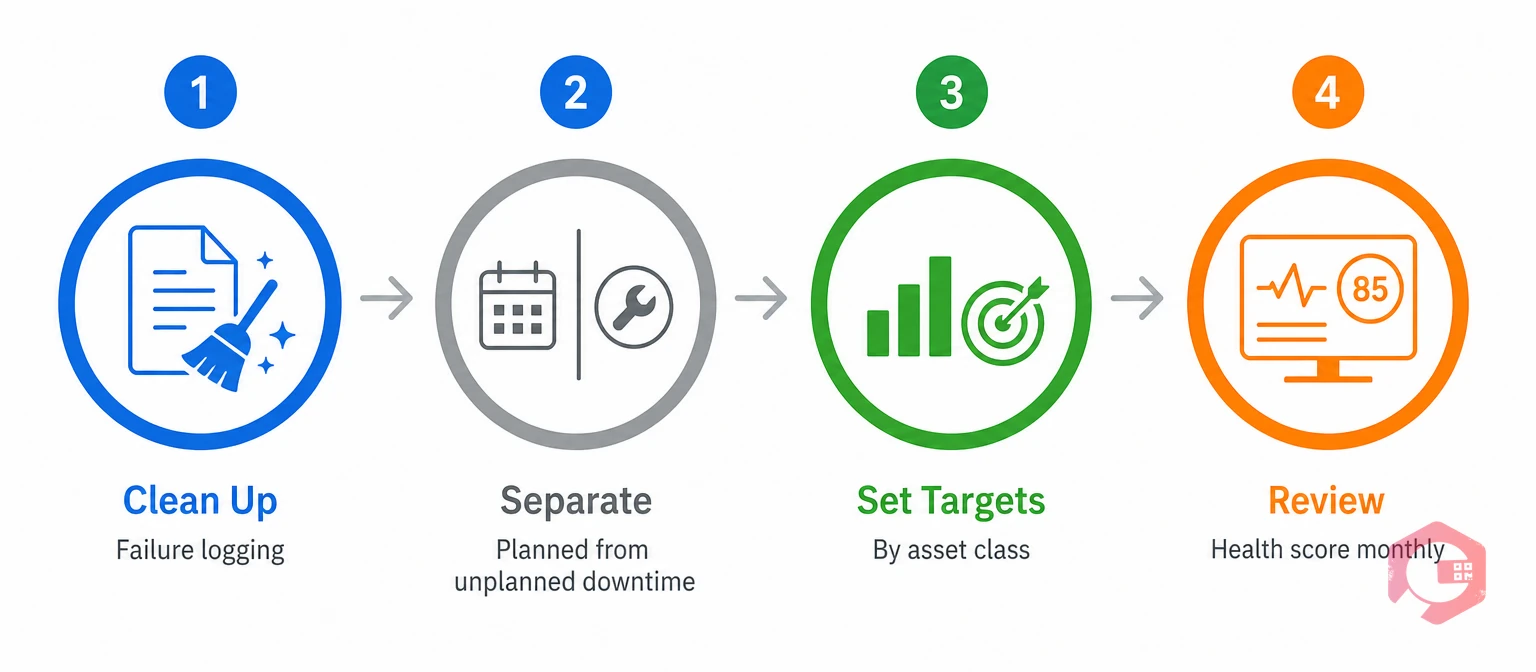
Getting a working RAM triangle in place doesn't require a new engineering team. It requires clean data and a system that calculates the three metrics the same way every time.
Before anyone can trust an MTBF or MTTR number, failure logging has to move away from free text. A structured form for failure mode, detection method, and downtime start and end is the single biggest lever most teams can pull in month one.
A team can't tell whether an availability problem is a reliability issue or a scheduling issue until planned downtime gets separated from unplanned downtime in the data itself, not just in a manager's head.
A single site-wide availability target hides which specific asset classes are dragging the number down. Setting MTBF and MTTR targets by asset class shows exactly where to spend the next maintenance budget.
Reliability and maintainability trends move slowly enough that annual reviews miss the early warning signs. A monthly look at asset health scores catches a developing problem while it's still cheap to fix. Waiting for an annual review often means a small parts issue turns into a full asset replacement decision. Monthly checks cost little time but save real money over a fleet's life. A five-minute monthly review is often enough to catch the warning signs early.
RAM triangle targets differ a lot by industry. A benchmark that makes sense in food and beverage can be far too loose for a power plant.
Many packaging lines target 85% to 95% availability. Reliability targets often center on an MTBF of several hundred hours for high-cycle equipment like conveyors and fillers. MTTR targets usually sit under two hours for common failure modes.
Utilities often push availability targets above 98%, since even short outages affect large numbers of customers. Reliability targets focus on critical assets like transformers and turbines, where MTBF gets measured in months or years, not hours.
These industries weigh maintainability heavily, because a slow repair on a regulated line can mean a full batch gets scrapped. MTTR targets tend to be tight, often under one hour for critical process equipment.
Remote assets change the math here. Reliability matters more than usual, since getting a technician to a remote site can add hours to any MTTR number. Teams in this space often invest more in prevention than in repair speed, simply because repair speed is harder to control.
These benchmarks work as a starting point, not a rule. The right target for any specific asset class comes from its own MTBF and MTTR history, not from an industry average pulled from a different fleet. A newer asset with a short failure history needs a wider target range at first. A team can tighten that range once a full year of clean data builds up behind it. This applies to every asset class, from a simple conveyor to a complex packaging line.
These terms come up constantly around the RAM triangle. Here's a short reference for each one.
Most teams that adopt this vocabulary find it easier to separate a reliability problem from a maintainability one. The right word for the problem points straight to the right fix. That's the whole point of measuring the RAM triangle in the first place, instead of watching one uptime number rise and fall without knowing why. A shared vocabulary also helps technicians, planners, and finance teams talk about the same failure the same way, which cuts down on the back-and-forth that slows a root cause review down.
Availability measures whether an asset is ready to run right now. Reliability measures how often it fails over time. An asset can be highly reliable but have poor availability if repairs take a long time. It can also be less reliable but still highly available if repairs happen fast.
Yes. An asset that fails only once a year but takes two weeks to repair each time can have lower availability than one that fails monthly but gets fixed in an hour. Reliability alone doesn't guarantee availability. Maintainability closes that gap.
Availability equals MTBF divided by the sum of MTBF and MTTR, expressed as a percentage. A higher MTBF, a lower MTTR, or both together will raise the resulting availability figure.
That uptime percentage can come from different combinations of reliability and maintainability. One asset might need a design change to stop failing so often. The other might just need faster spare parts or clearer repair steps. The RAM triangle is what tells a team which one it's actually dealing with.
Utilities, pharmaceutical manufacturing, healthcare, and food and beverage track RAM metrics closely, since uptime and repair response are often subject to audit. Every availability and reliability figure in those industries needs to trace back to timestamped system data rather than a reconstructed report.
Not on its own. A high score built on inconsistent failure logging can hide real problems. The RAM triangle only works as well as the data feeding it, which is why structured logging matters more than the final score itself.
Seeing the RAM triangle clearly across your own fleet starts with tracking availability, reliability, and maintainability from one system instead of three spreadsheets. Schedule a free demo to see how Cryotos turns that data into a live view of fleet health.




Cryotos AI predicts failures, automates work orders, and simplifies maintenance—before problems slow you down.



