

Overall Craft Effectiveness (OCE) is a maintenance workforce metric that measures how much of a technician's paid time turns into completed, correct work. It applies the same Craft Utilization x Craft Performance x Craft Service Quality logic that Overall Equipment Effectiveness (OEE) applies to machines, but points it at people instead. At the center of OCE sits wrench time: the share of a shift a technician spends hands-on with a tool, rather than traveling, waiting on parts, or filling out paperwork.
Key Takeaways
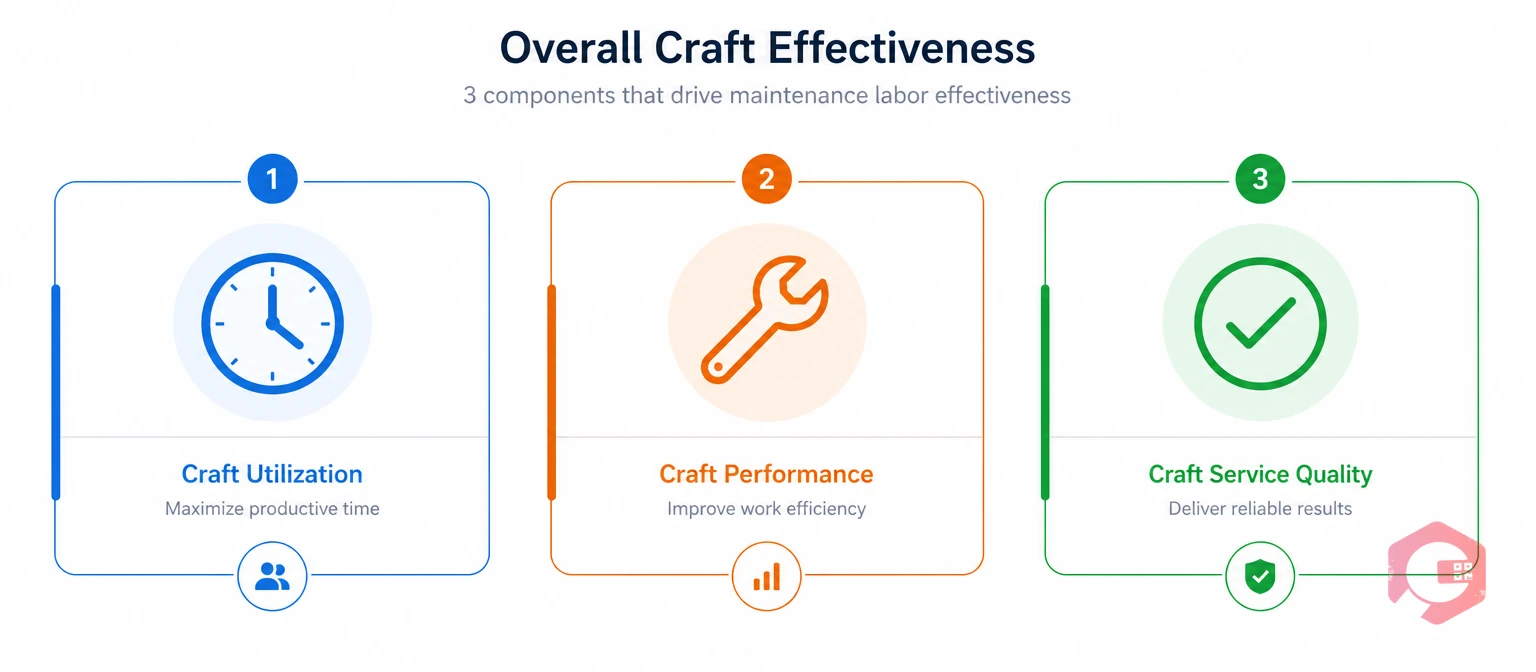
Overall Craft Effectiveness is a productivity metric that measures how much of a maintenance technician's paid time results in completed, correct work. It borrows its structure directly from OEE, the manufacturing metric that tracks how well an asset runs. Where OEE asks how well a machine is used, OCE asks how well a person's time is used.
The metric breaks down into three components, each answering a different question:
Most maintenance organizations have never measured OCE formally, because the underlying data — actual labor time, task duration, and repair outcomes — was never captured consistently. That gap is closing as more teams move labor tracking onto mobile devices instead of end-of-shift paperwork.
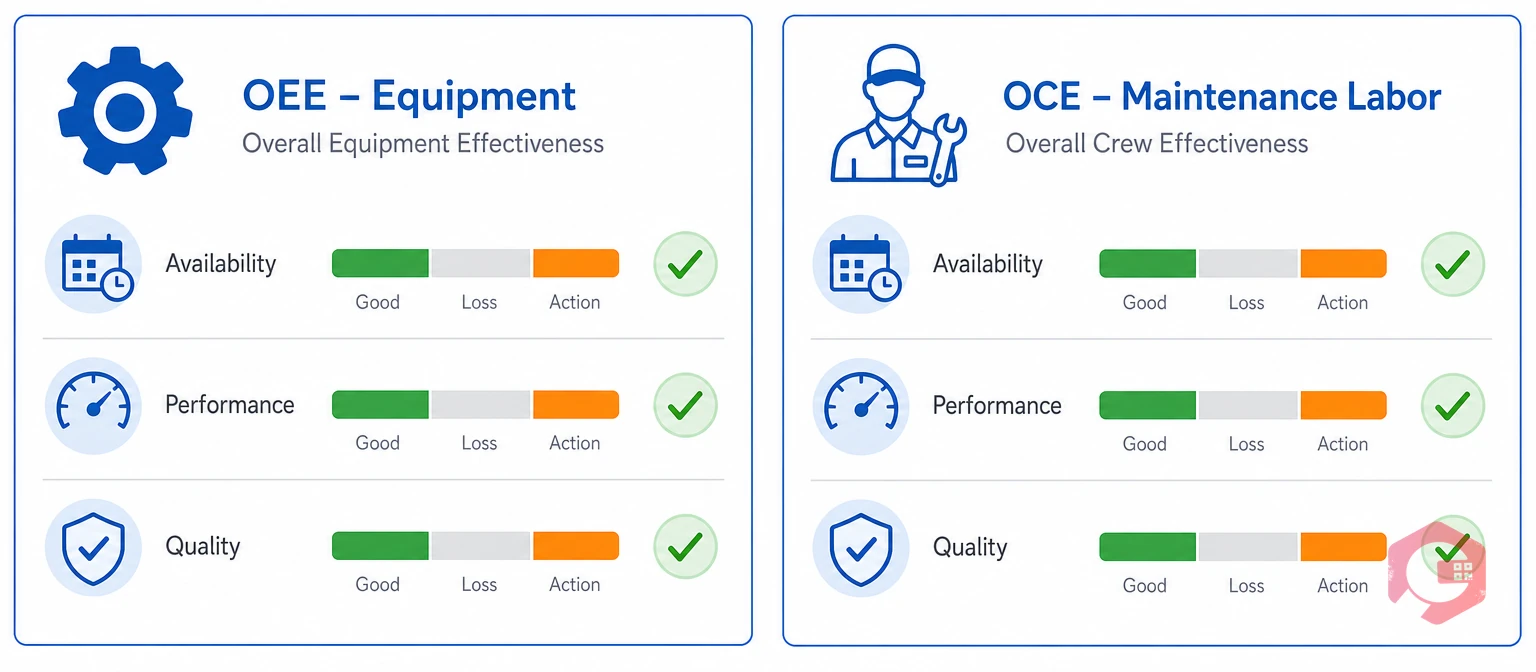
OCE and OEE measure the same three underlying dimensions, but OCE labels them Craft Utilization, Craft Performance, and Craft Service Quality when applied to a technician's labor hours, while OEE applies availability, performance, and quality to a machine's run time. The table below breaks down where each metric focuses.
| Dimension | OEE (Equipment) | OCE (Craft/Labor) |
|---|---|---|
| What it measures | How well an asset is used during its scheduled run time | How well a technician's paid time is used during a shift |
| Availability / Craft Utilization component | Machine uptime vs. planned production time | Hours available for work vs. scheduled shift length |
| Performance / Craft Performance component | Actual output speed vs. ideal cycle time | Actual task time vs. standard job-plan time (wrench time) |
| Quality / Craft Service Quality component | Good units produced vs. total units produced | First-time fix rate vs. total completed repairs |
| Primary data source | Machine sensors, SCADA, production counts | Mobile time tracking, job plans, failure codes |
The two metrics reinforce each other. A plant can hit a strong OEE score on paper while its technicians lose hours a day to travel and waiting — and once that Overall Equipment Effectiveness number stalls, Overall Craft Effectiveness is usually where the missing time is hiding.
Wrench time is the percentage of a technician's paid hours spent physically performing hands-on maintenance work, as opposed to traveling to the job, waiting for parts, searching for tools, or completing paperwork. It feeds the Craft Performance component of OCE directly.
In unmanaged environments, wrench time often falls between 25% and 35% of a shift. Organizations that tighten planning, scheduling, and mobile access typically push it toward 50% to 65%. That gap — roughly a third of every paid hour — is what OCE exists to expose and close.
Wrench time tells you how much of the day is spent working. OCE tells you how effectively that work translated into reliable, quality output. A technician can log high wrench time on jobs that fail a week later — high performance, weak quality. OCE catches that gap; wrench time alone doesn't.
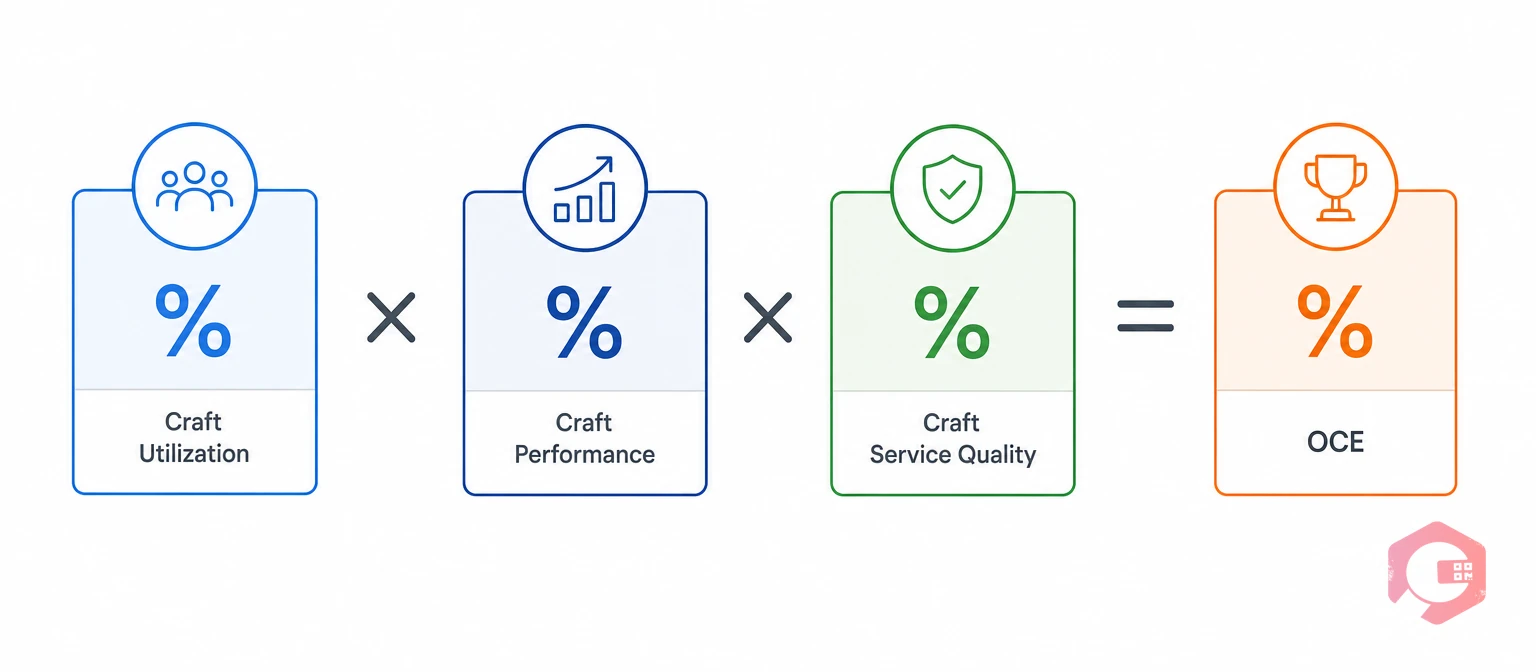
Overall Craft Effectiveness is calculated by multiplying three component percentages together, the same way OEE is calculated for equipment. The OCE Formula: OCE = Craft Utilization × Craft Performance × Craft Service Quality.
Multiply the three percentages and the result is OCE. A technician who is available 90% of the shift, performs at 70% against standard time, and hits a 95% first-time fix rate produces an OCE of roughly 60% — a realistic, achievable number for a team that has never measured it before. First-time fix rate is the share of repairs completed correctly on the first visit, and it's the clearest proxy for craft quality most organizations have available.
Take a technician scheduled for an eight-hour shift. One hour goes to breaks and a safety meeting, leaving seven hours available — a Craft Utilization of 87.5%. Job plans estimate five hours of standard time for the tasks completed; the technician actually spent six hours on tool, giving a Craft Performance figure of 83%.
Of the repairs completed, one generates a callback within the 30-day rework window out of twelve total repairs, putting Craft Service Quality at 92%. Multiplying 87.5% x 83% x 92% gives an OCE of roughly 67% — a number a supervisor can now track week over week, compare across the crew, and use to spot where the biggest gains are available.
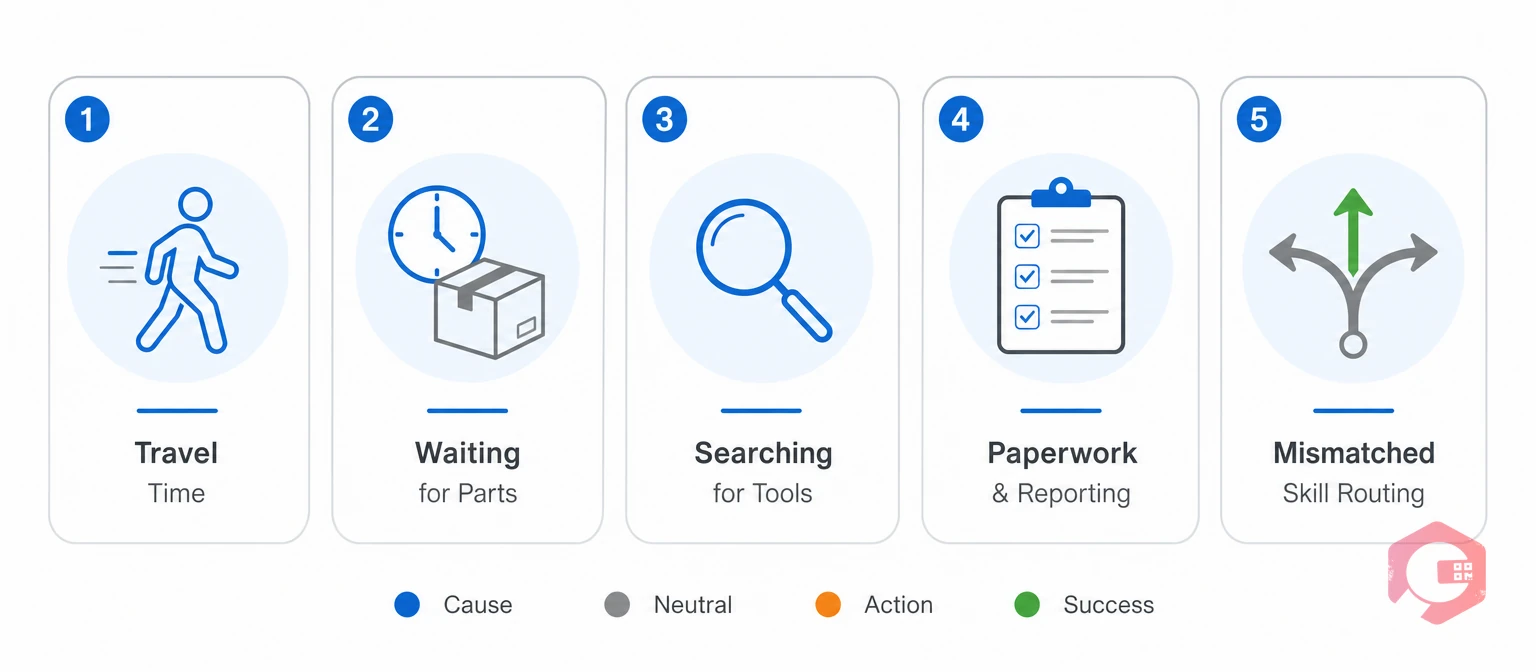
Most OCE loss traces back to a small set of repeatable causes rather than a lack of technician effort.
Every one of these causes shows up as a gap in the data a CMMS is built to capture — which is why teams that automate labor tracking tend to find their OCE baseline faster than teams relying on time-motion studies. Research summarized by Reliable Plant consistently points to parts availability and travel time as the two largest recoverable gaps once a facility starts measuring where the day actually goes.
Without a system that records labor time, task duration, and quality outcomes at the point of work, OCE and wrench time are estimates pulled from interviews or gut feel. A Computerized Maintenance Management System gives maintenance teams a mobile-first way to capture this data as work happens.
Technicians receive and update work orders directly from a mobile app, without returning to a dispatch board for the next assignment — removing one of the largest silent drains on wrench time.
Scanning an asset pulls up its history, open work orders, and job plan instantly. Scanning a storeroom bin confirms a part is in stock and its exact location, converting search time back into wrench time.
Technicians clock in and out of individual tasks, logging travel, active repair, waiting, and administrative time as distinct categories — the exact inputs the Craft Utilization and Craft Performance components need.
Try the wrench time calculator against a week of your own crew's logged hours to see where the baseline actually sits before rolling out a full OCE program.
Once craft utilization is visible, staffing stops being based on headcount alone. Managers can see whether a site is genuinely short-staffed or simply losing hours to travel and waiting, and right-size the team instead of hiring around a symptom.
Maintenance teams using Cryotos have reported up to 30% reduction in unplanned downtime and 25% faster repair turnaround once labor and quality data started rolling up into a single BI dashboard. Most facilities find the biggest early win in the report builder, where OCE, wrench time, and first-time fix rate can be pulled by technician, crew, and site without a manual time study. Reliability programs that track these metrics against benchmarks such as those published by the Society for Maintenance and Reliability Professionals tend to catch a workforce productivity slide months before it shows up in a downtime report. Framing OCE inside a broader asset-management program, consistent with the ISO 55000 standard, also helps leadership connect workforce productivity to the same reliability outcomes that MTBF and MTTR already measure for equipment.
Ultimately, Overall Craft Effectiveness connects workforce productivity to the same reliability and cost outcomes that downtime tracking already measures for equipment. A maintenance organization that improves OCE isn't just working more hours — it's converting more of the hours it already pays for into completed, correct, on-time work.
There's no universal target, but teams that combine strong planning with mobile data capture typically land in the 55% to 70% range. Below 40% usually points to a scheduling or parts-availability problem rather than a discipline issue.
No. Wrench time is one input into OCE — specifically, it drives the Craft Performance component. OCE also accounts for Craft Utilization and Craft Service Quality, so a high wrench time score with a poor first-time fix rate still produces a mediocre OCE.
Start with task-level time logging, even on paper, broken into travel, active repair, waiting, and admin categories. That gives you a Craft Utilization and Craft Performance baseline; add failure-code tracking for a basic Craft Service Quality figure. Most teams outgrow manual tracking within a quarter and move to a mobile CMMS to keep the data accurate.
Most of that gap comes from travel, waiting on parts, and searching for tools or asset records — none of which show up as "idle" time on a timesheet, so they go unaddressed until someone measures where the hours actually go.
Yes. Visible craft utilization data separates a genuine staffing shortage from a team that's simply losing hours to non-wrench-time waste, which gives leadership a data-backed case either way instead of a guess based on headcount alone.
Overall Craft Effectiveness turns a soft management concern — technicians feel busy, but nothing gets fixed faster — into structured, trackable data. Schedule a free demo to see how Cryotos captures the labor, task, and quality data your OCE score is built from.




Cryotos AI predicts failures, automates work orders, and simplifies maintenance—before problems slow you down.



