

Supplier price creep is the slow, cumulative rise in what you pay suppliers for the same maintenance items. A smaller discount here, a new freight surcharge there — and the total quietly outpaces your budget. You catch it early by normalizing every purchase to a common baseline. Then compare that baseline against a relevant market index, and route only the unexplained gaps for review. The pattern hides best in maintenance, repair, and operations (MRO) buying. Volumes are irregular, item descriptions vary, and an urgent breakdown leaves little room to negotiate. Left unmonitored, it can consume a meaningful share of an annual maintenance budget without a single transaction ever looking unreasonable on its own.
Key Takeaways
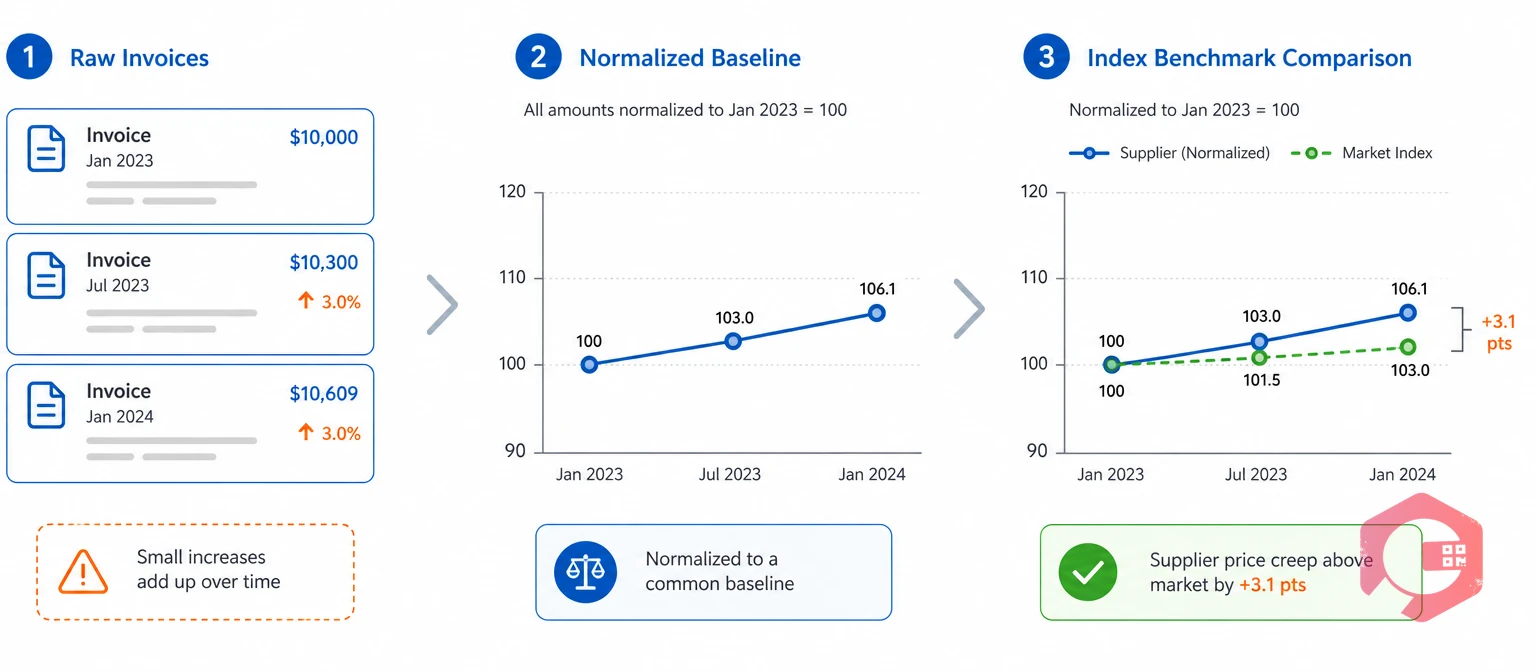
Supplier price creep is a sustained rise in item cost that market movement alone doesn't explain. The word "comparable" carries the weight here. A price comparison falls apart the moment one order includes rush freight, a smaller pack size, or a different brand than the last one.
That's why the first task in any detection effort is normalizing the transaction, not comparing raw invoice totals. A Computerized Maintenance Management System can log unit of measure, pack conversion, and supplier data with every purchase. That gives you the raw material to normalize costs the same way every time. You skip redoing the math by hand whenever finance asks a question.
Maintenance teams that skip normalization usually end up arguing about numbers that were never comparable in the first place.
Supplier price creep hides in maintenance, repair, and operations buying for three reasons. Demand is fragmented across thousands of SKUs, and descriptions are inconsistent. An urgent failure also weakens your bargaining position at the exact moment you need it most.
Low-value lines often fall below approval thresholds. Buyers focus on getting the part fast, not on tracking five small increases stacking up over a year. Maintenance costs can look flat at the category level. But that total can still hide a supplier shifting an increase from unit price into freight, surcharges, or a shrinking discount.
This is why the Institute for Supply Management tracks supplier cost pressure by category separately from headline inflation — the two rarely move together. ISO 55000 frames good asset management as a balance of cost, risk, and performance. An unmonitored supplier increase is a cost-side risk that erodes that balance one invoice at a time.
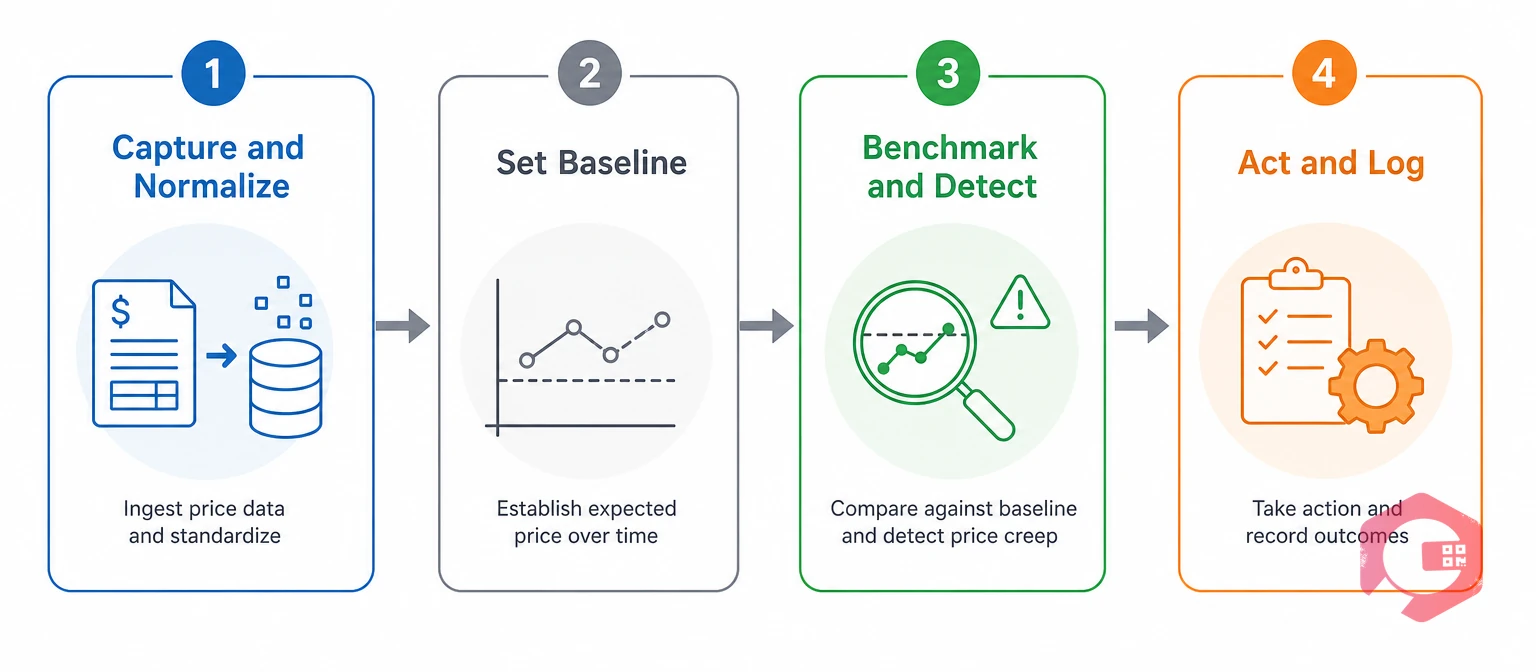
The Four-Stage Price Creep Detection Framework:
A rolling median baseline is usually safer than a single prior invoice. One emergency purchase or unusual quantity can otherwise skew the whole comparison.
A project and budget module gives finance and maintenance a live view of these exceptions against an actual budget. That beats reconciling them after the invoice is already paid.
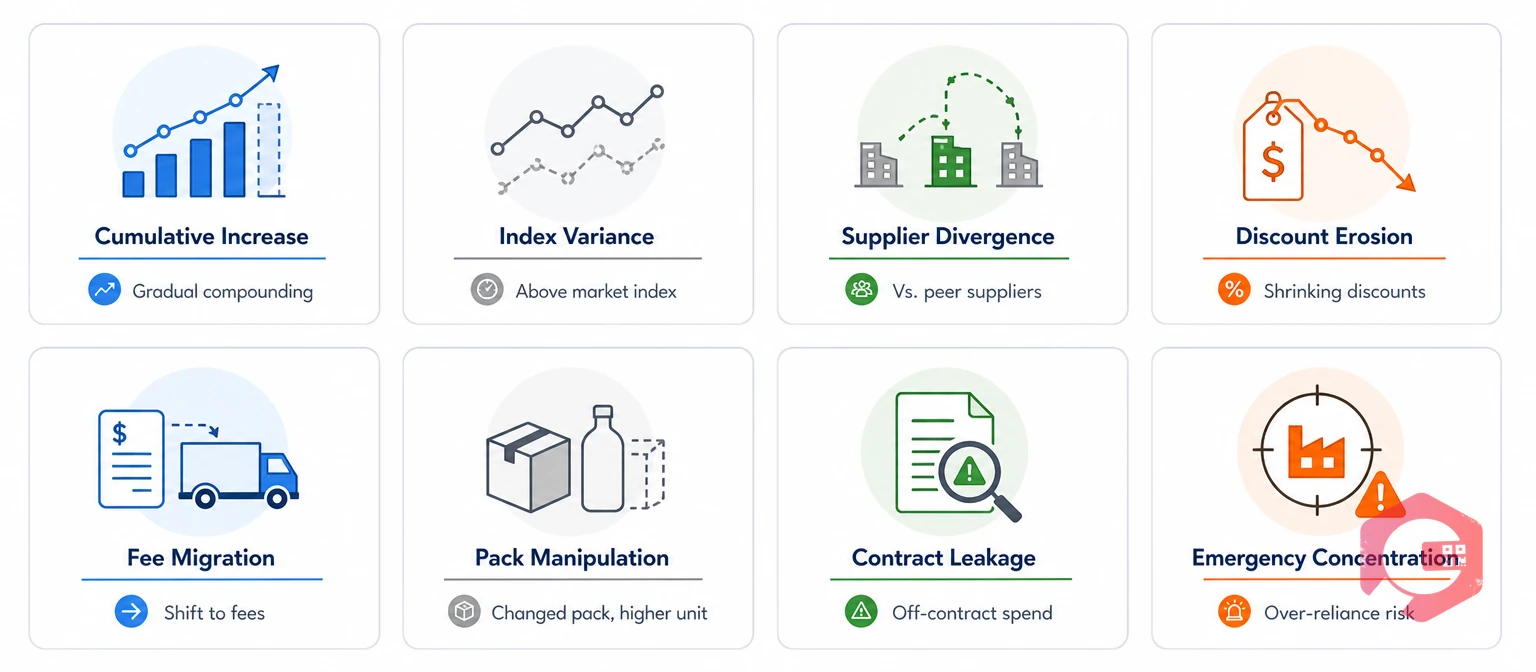
Eight recurring patterns signal supplier price creep well before it shows up as one alarming number on an invoice.
Most facilities only need two or three of these signals firing on the same supplier to justify a formal review.
Three measures separate genuine supplier price creep from ordinary market inflation: normalized unit cost, purchase price variance, and index-adjusted variance.
Purchase price variance is the dollar gap between what you paid and your baseline, times quantity purchased. Alone, it tells you how much drift cost you. Paired with the index-adjusted figure, it also tells you whether that drift was justified.
| Measure | Formula | Best Used For |
|---|---|---|
| Normalized Unit Cost | (Extended line cost + fees − rebates) / comparable quantity | Making two orders genuinely comparable before anything else |
| Purchase Price Variance (PPV) | (Current normalized price − baseline price) × actual quantity | Quantifying the dollar impact of a specific increase |
| Index-Adjusted Variance | Supplier price change % − relevant index change % | Judging whether an increase is market-driven or supplier-specific |
The U.S. Bureau of Labor Statistics advises choosing an index that closely matches the product. Define the base period and adjustment formula clearly before you lean on it during a negotiation. Run your own numbers through the mean maintenance cost calculator to see what a comparable purchase should cost before you accept a supplier's new quote.
A governed item master is one record covering part numbers, specs, and approved substitutes for everything you buy. Without it, the same bearing ordered under three slightly different descriptions looks like three unrelated purchases instead of one price trend.
Tight spare parts inventory data is what makes normalized comparisons possible in the first place. Without consistent units and pack conversions, every variance calculation starts from a shaky baseline.

Rolling out a price creep program works best as a phased pilot rather than a company-wide policy change on day one.
Most facilities that pilot this way find their threshold settings need one round of adjustment before false positives drop to a manageable level.
Five recurring mistakes turn a well-intentioned price creep program into either noise or a false sense of security.
The U.S. Government Accountability Office notes that prior invoices and comparable pricing become standard evidence here. This applies when competitive comparisons aren't available for a single-source item.
Cryotos supports maintenance budget protection by connecting the data a price creep program needs: work order costs, parts consumption, and supplier history. It keeps all of it in one searchable system instead of scattered spreadsheets.
The report builder turns normalized cost trends by supplier, category, and plant into a recurring report. That way, an exception review doesn't depend on someone remembering to pull the numbers by hand. Maintenance teams using Cryotos have reported up to 30% reduction in unplanned downtime and 25% faster repair turnaround. Fewer emergency purchases also means fewer premium-priced, single-source orders — the kind that hide creep most easily.
Most teams that successfully separate genuine price creep from normal inflation start small. Pick the handful of suppliers and item families driving the largest share of maintenance spend, then expand the review once the data proves itself out.
Normal inflation moves roughly in line with a relevant market index and applies broadly across suppliers. Supplier price creep is the portion of an increase that a relevant index, specification change, or service-level change doesn't explain — it's specific to that supplier or item, not the wider market.
There's no universal figure. It depends on spend volume and how fragmented your MRO buying is. But even a handful of suppliers drifting 8 to 10% above a 2 to 3% market index can add up fast. Over a year, that gap can eat up a meaningful share of your maintenance budget, with no single invoice ever looking unreasonable.
Start with index-adjusted variance on your highest-spend item families. It answers the question that matters most: is the increase market-driven, or specific to this supplier? Get that answer before you build a full normalized-cost program across every SKU.
You can start with a spreadsheet for a handful of item families. But reliable detection depends on clean, consistent price and quantity history across purchases, and most spreadsheets lose that history over time. A CMMS or dedicated procurement analytics tool that retains this history automatically makes the normalization step far less manual.
Route the exception to the owner of the risk it touches. Procurement handles a commercial variance, and engineering handles a spec change. Stores handles a pack or minimum-order impact, and finance steps in when the exposure hits the budget.
Catching supplier price creep early comes down to comparing the right numbers before an invoice is paid, not after. Schedule a free demo to see how Cryotos brings your work order costs, parts data, and supplier history together in one place to protect your maintenance budget.



Cryotos AI predicts failures, automates work orders, and simplifies maintenance—before problems slow you down.



