

Procurement KPIs are the specific metrics engineering firms use to measure how effectively they source, stock, and receive spare parts and materials for maintenance. Without these metrics tracked in a single system, procurement decisions depend on guesswork — and the result is stockouts, emergency orders, and maintenance delays that compound over time. A Computerized Maintenance Management System (CMMS) gives engineering teams one platform to monitor procurement performance in real time, from purchase order cycle time through vendor delivery rates and inventory carrying costs. This guide covers the 10 procurement KPIs every engineering firm should track, explains what good looks like for each, and shows how a CMMS connects those metrics directly to daily maintenance workflows.
Key Takeaways
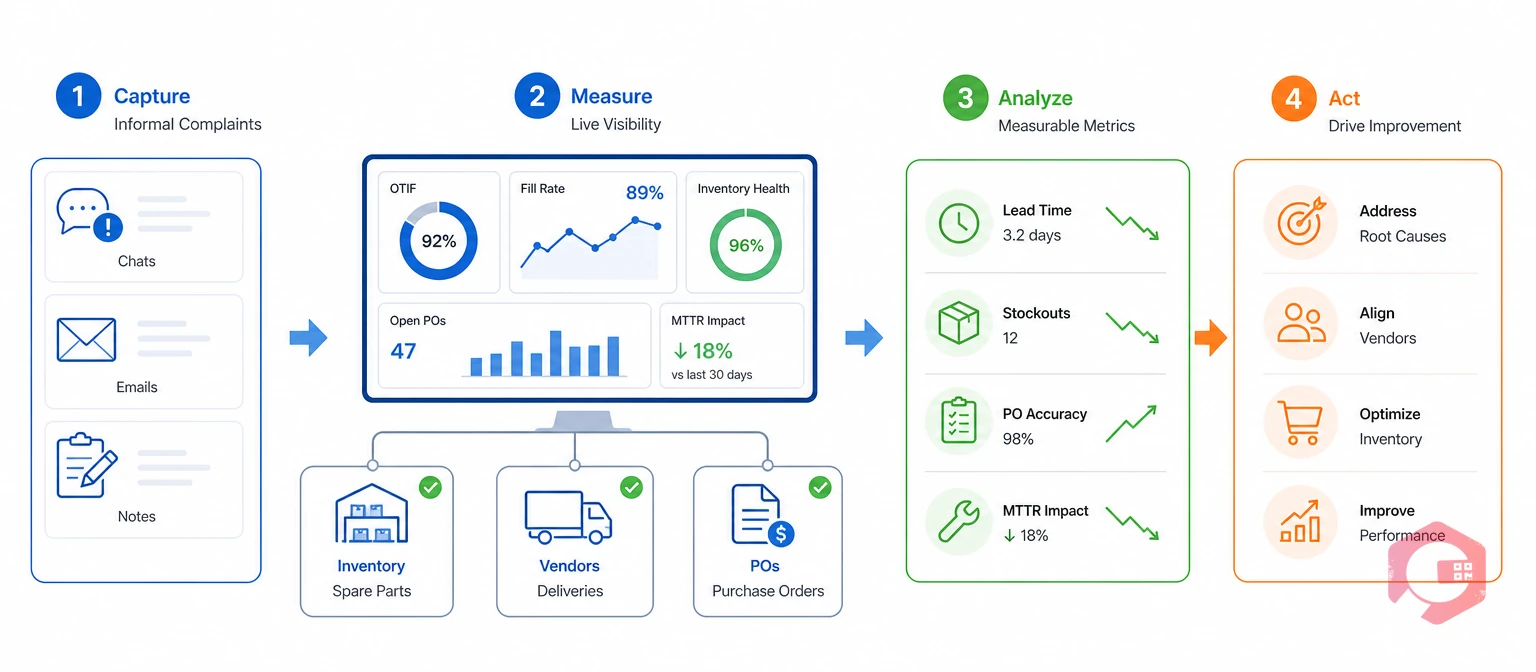
Engineering firms manage maintenance-critical assets across multiple sites, often under tight project schedules. Spare part shortages don't just delay repairs — they stall production lines, push commissioning timelines, and force urgent purchases at premium rates. Organizations that track procurement KPIs as part of a structured key performance indicator framework consistently reduce emergency procurement spend and improve maintenance schedule adherence, because the data makes problems visible before they become crises.
Most engineering firms already know their biggest procurement pain points: stockouts on high-criticality parts, slow purchase approvals that hold up scheduled maintenance, and vendor deliveries that arrive late without advance notice. What they often lack is a shared, live view of these problems. KPIs turn informal complaints into measurable gaps. Once a gap is visible and owned by a specific person or team, it becomes straightforward to agree on what to fix and to confirm whether the fix worked.
The firms that do this well don't just run monthly reports. They track procurement KPIs inside the same system that runs their work orders and preventive maintenance schedules. That integration — procurement data connected to maintenance data — is what makes the metrics actionable rather than retrospective. The most effective starting point is a defined scorecard: a fixed set of 10 KPIs with clear ownership and target thresholds, reviewed on a regular cadence by both maintenance and procurement teams.
The Procurement KPI Scorecard is a 10-metric framework that covers the full procurement cycle for engineering firms — from the moment a maintenance team raises a purchase request through vendor performance, inventory health, and total cost per asset. Each KPI maps to a specific failure mode. Tracking all 10 together gives procurement and maintenance managers a complete picture of procurement health, rather than one that only surfaces the symptoms they're already aware of.
| KPI | Category | Benchmark Target | What It Measures |
|---|---|---|---|
| Purchase Order Cycle Time | Process Speed | ≤3 business days | Time from purchase request to issued PO |
| Supplier On-Time Delivery Rate | Vendor Performance | ≥95% | % of deliveries arriving on or before the agreed date |
| Spare Parts Availability Rate | Inventory Health | ≥98% | % of work orders fulfilled without a stockout delay |
| Inventory Turnover Ratio | Inventory Health | 4–6× per year | How often stock is consumed and replenished in a period |
| Stockout Frequency | Inventory Health | ≤2 events per month | Number of times a part was needed but unavailable |
| Procurement Cost per Asset | Cost Control | Trended downward YoY | Total procurement spend attributed to each asset |
| Emergency Purchase Percentage | Cost Control | ≤10% | % of total purchases raised as unplanned or urgent |
| Vendor Performance Score | Vendor Performance | ≥80 / 100 | Composite score: price, delivery, quality, responsiveness |
| Inventory Carrying Cost | Cost Control | 20–30% of inventory value | Total cost of holding stock: capital, storage, obsolescence |
| Purchase Request Approval Time | Process Speed | ≤1 business day | Time for a raised purchase request to receive sign-off |
Review these 10 KPIs as a set, not in isolation. A low Emergency Purchase Percentage alongside a high Stockout Frequency usually means reorder points are set too low — the team isn't rushing to buy, but the shelves are still empty. Looking at one metric without the others leads to the wrong diagnosis every time.
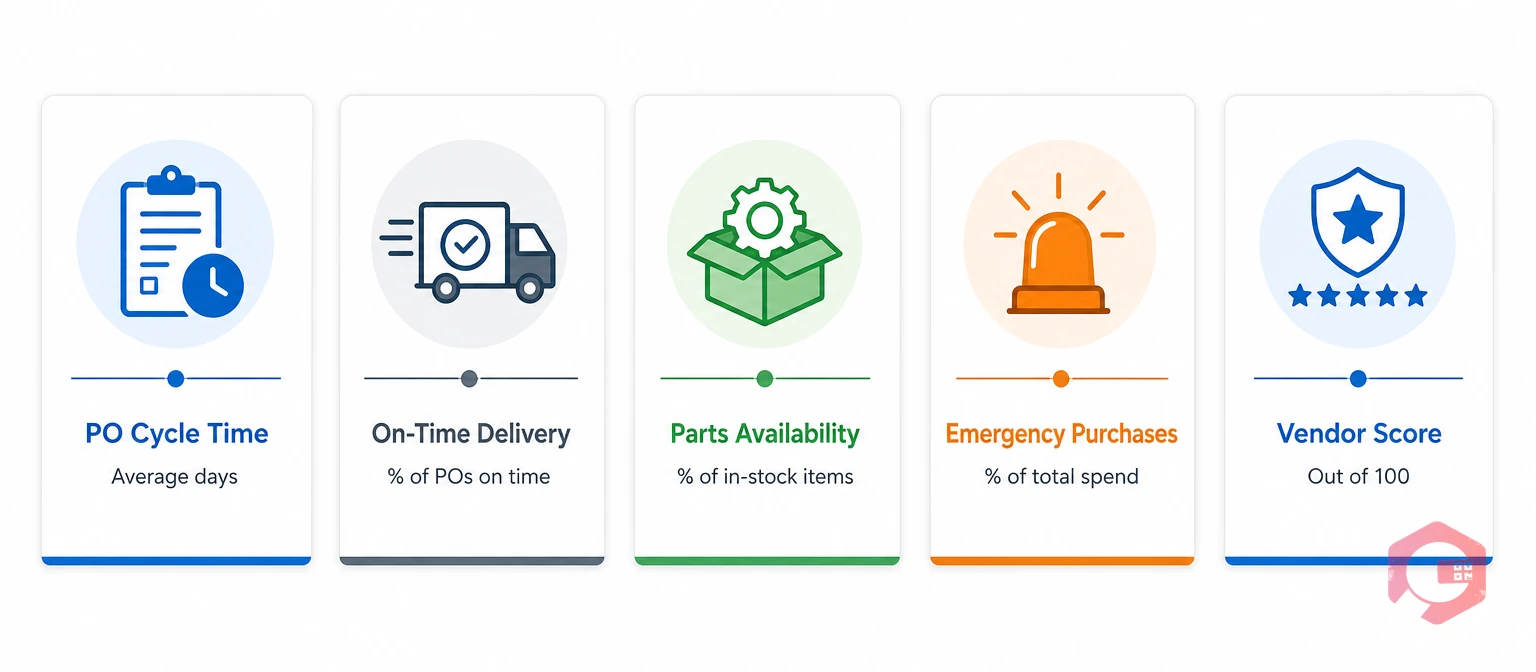
All 10 KPIs in the Procurement KPI Scorecard matter, but these five have the most direct effect on maintenance outcomes and are the ones most commonly misunderstood or under-monitored in engineering firms.
Purchase order cycle time measures the days between a maintenance technician raising a purchase request and the purchase order being formally issued to the supplier. The benchmark for engineering firms is three business days or fewer. Anything longer usually means the approval workflow has too many sequential steps, or that approvers aren't promptly notified when a request is waiting on them.
A CMMS with automated approval notifications removes the "I didn't know there was a request waiting" problem. Multi-level approval workflows — where a work-order-linked purchase request routes to a supervisor and then to procurement — can run in parallel rather than sequentially, cutting cycle time without removing oversight. When this KPI is above five days, the place to look first is the approval chain, not the procurement team's workload.
This KPI measures what percentage of supplier deliveries arrive on or before the committed date. A strong engineering firm targets 95% or higher. Below 90%, the procurement team is spending significant time expediting late orders, and the maintenance team is routinely rescheduling PM windows around missing parts.
Tracking this KPI requires a system that records both the promised delivery date and the actual receipt date for every purchase order. Without that data, the rate is unmeasurable and vendor negotiations happen without evidence. A CMMS that logs delivery dates against each PO builds the supplier performance history that makes vendor reviews meaningful — and gives the firm real negotiating weight when a supplier consistently misses its delivery commitments.
Spare parts availability rate is the percentage of work orders completed without a stock shortage delaying the job. Anything below 98% signals that reorder points, safety stock levels, or lead-time estimates need adjustment. This KPI connects procurement performance directly to maintenance outcomes — it's the clearest way to quantify what stockouts cost in schedule terms.
A CMMS tracks this by recording whether each work order was executed on schedule or delayed due to missing parts. Over a rolling 90-day window, that data shows whether the issue is a specific part category, a specific vendor, or a systemic reorder-point problem across the board. The spare parts inventory software in Cryotos handles this tracking automatically — reorder alerts fire at a configurable threshold, before the shelf is actually empty.
Emergency purchase percentage is the share of total procurement spend classified as urgent or unplanned. Best-in-class engineering firms keep this below 10%. When more than 15–20% of purchases are emergency orders, the procurement process has a structural problem. Parts aren't being forecasted against PM schedules, reorder points are too low, or unplanned breakdowns are too frequent for the current inventory buffer to absorb.
This KPI is a lagging indicator of inventory health. When it rises, the reasons usually trace back to Stockout Frequency or a declining Spare Parts Availability Rate — two KPIs earlier in the scorecard. Tracking all three together makes it easier to identify the root cause before it becomes an expensive long-term pattern rather than a recoverable one-month spike.
A vendor performance score combines delivery timeliness, invoice accuracy, part quality, and responsiveness to inquiries into a single composite rating. An 80/100 threshold is a reasonable baseline for preferred-vendor status. Suppliers who consistently score below that threshold should be reviewed before the next contract renewal — not after a failure has already delayed a critical repair and forced an emergency buy from an alternative source.
The score is only useful if it updates regularly on objective data rather than recall. A CMMS that logs each delivery against its promised date, each invoice against its PO amount, and each quality rejection against its order builds this score automatically. The scored supplier database becomes a procurement asset in its own right — it guides buying decisions and gives the firm real evidence to use in vendor negotiations.
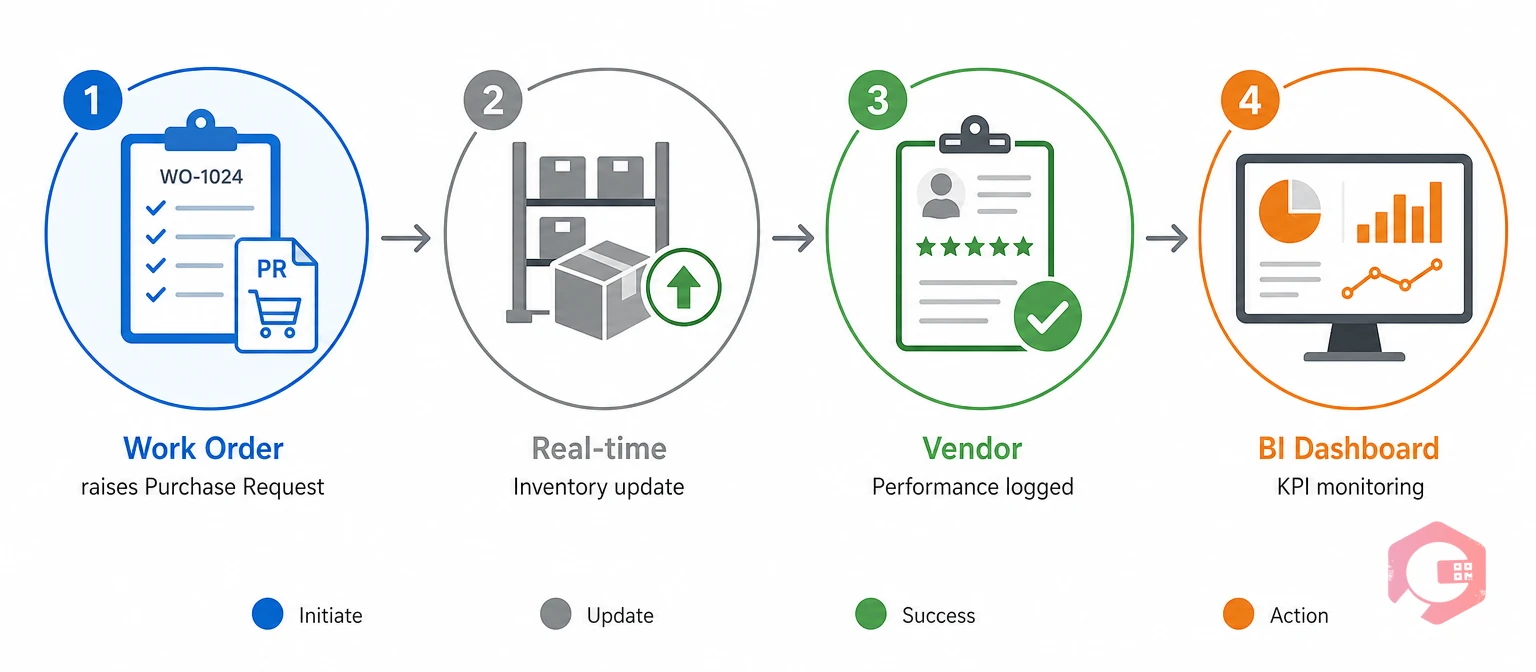
Tracking 10 procurement KPIs across an engineering firm isn't practical without a system that connects purchase data to maintenance data from the start. Cryotos CMMS software for engineering procurement is built specifically for this connection — purchase requests are generated directly from work orders, so every procurement event is tied to an asset, a maintenance activity, and a cost center from the moment it's raised.
The features that drive automatic KPI tracking in Cryotos are:
To understand how procurement costs compound across asset classes, the mean maintenance cost calculator can show you exactly what each asset is costing to keep in service, including procurement spend per repair event.
The result is a procurement system that doesn't require a dedicated procurement analyst to maintain its KPI data. The metrics build themselves as the maintenance team does its normal work. That's the practical advantage of connecting procurement directly to the work order system — the data is captured as a by-product of operations, not as an extra reporting task.
The metrics in the Procurement KPI Scorecard are only valuable if someone owns them and acts on them. Most engineering firms that start tracking procurement KPIs encounter difficulty not with data collection, but with accountability. A KPI dashboard that no one reviews on a fixed schedule changes nothing.
Three practices consistently make KPI tracking stick:
Engineering firms that treat procurement as a support function to maintenance — rather than a separate department with its own independent targets — consistently outperform those that keep the two teams disconnected. The inventory turnover and spare parts data that a CMMS captures is the bridge between both teams, giving them a shared language for procurement performance conversations. For firms building this discipline from scratch, the MRO inventory checklist is a practical starting point before setting reorder thresholds and KPI targets.
Start with Purchase Order Cycle Time, Supplier On-Time Delivery Rate, and Emergency Purchase Percentage. These three give you an immediate view of how fast procurement moves, how reliable your vendors are, and whether your parts planning is reactive or proactive. They also have the most direct connection to maintenance delays that teams can measure without extensive data history.
A CMMS improves procurement KPI tracking by linking every purchase request to a work order, an asset, and a cost center. That connection makes KPIs automatic rather than manual — the data is captured as part of normal maintenance activity, not as a separate reporting task. You get vendor delivery history, spare parts consumption rates, and procurement cycle times without building a parallel reporting system.
Most high-performing engineering firms target an Emergency Purchase Percentage below 10%. Anything above 15–20% signals that preventive maintenance schedules and reorder points are not aligned with actual demand. The fix is recalibrating safety stock levels using real consumption data from the past 6–12 months — not a flat estimate carried over from a prior year's budget.
A monthly review of all 10 KPIs works for most engineering firms. High-frequency KPIs like Stockout Frequency and Emergency Purchase Percentage are worth reviewing weekly, since problems in these areas can escalate into significant unplanned spend within days. A CMMS with scheduled report delivery automates this without adding manual work to the procurement team's calendar.
Procurement performance determines how quickly your maintenance team can do its job without delays caused by missing parts. Schedule a free demo to see how Cryotos tracks all 10 procurement KPIs automatically and connects them to your maintenance work orders, inventory, and vendor data in real time.




Cryotos AI predicts failures, automates work orders, and simplifies maintenance—before problems slow you down.



