
CMMS data is now being used in capital planning conversations to give finance teams and executives the maintenance evidence they need to approve major asset investments. Instead of gut-feel budget requests, maintenance managers pull repair histories, downtime costs, and asset age data from their asset maintenance management software to build a clear financial case. According to a 2024 Deloitte survey, organizations that use operational data in capital budget reviews are 2.4 times more likely to see their requests approved on the first submission. This shift is changing how maintenance and finance teams work together — and CMMS is at the center of it.
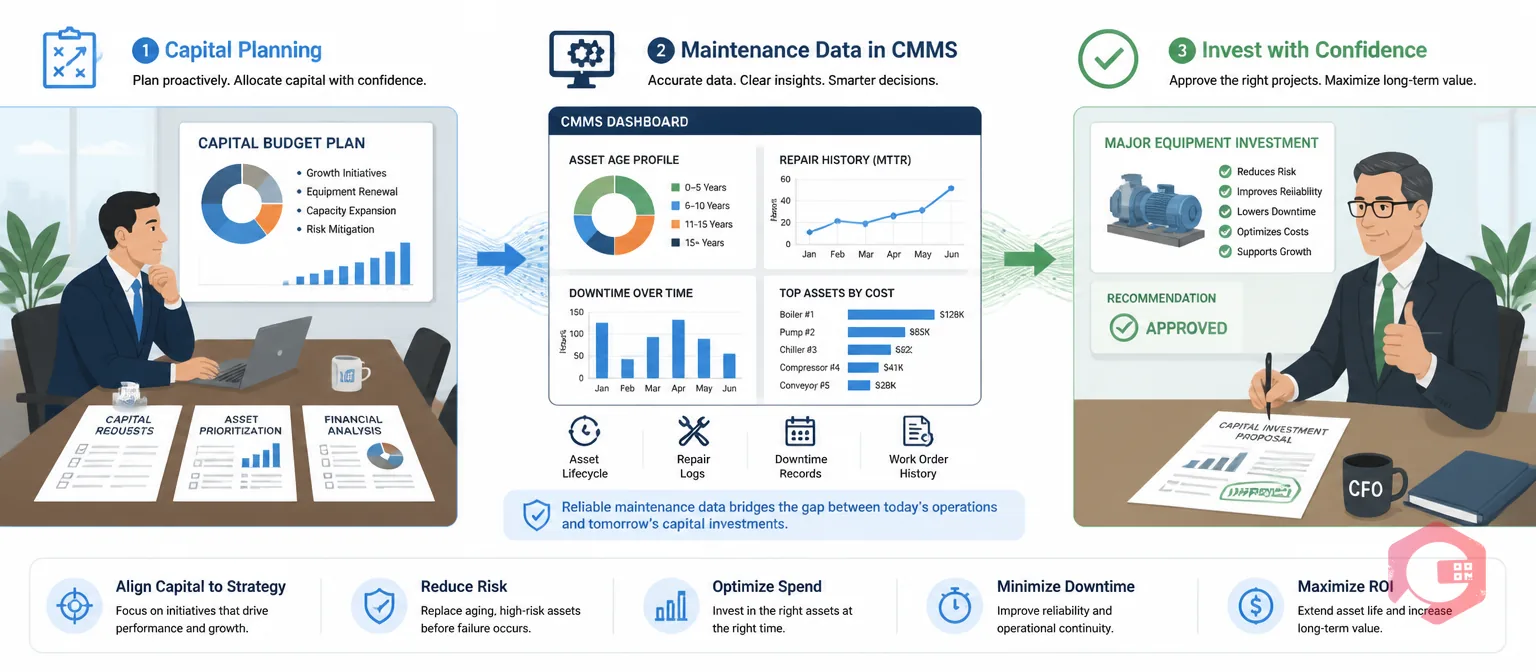
Capital planning is the process of deciding which long-term investments — new equipment, facility upgrades, or major asset replacements — get funded in a given budget cycle. Traditionally, this conversation happened between finance and operations, with maintenance teams rarely getting a seat at the table. That's changed.
Today, CFOs and procurement leaders want evidence before committing six- or seven-figure capital expenditure (capex) budgets. They ask questions like: How many times did that conveyor system break down last year? What's our total cost of ownership on that aging chiller? When does our HVAC reach end-of-life economically?
Maintenance managers who can answer those questions with data — not estimates — win the conversation. And the data lives in the CMMS. Asset lifecycle management data, repair logs, and downtime records are exactly what capital committees want to see. Organizations that bring CMMS reports into budget reviews reduce back-and-forth approval cycles and get faster sign-off on replacement projects.
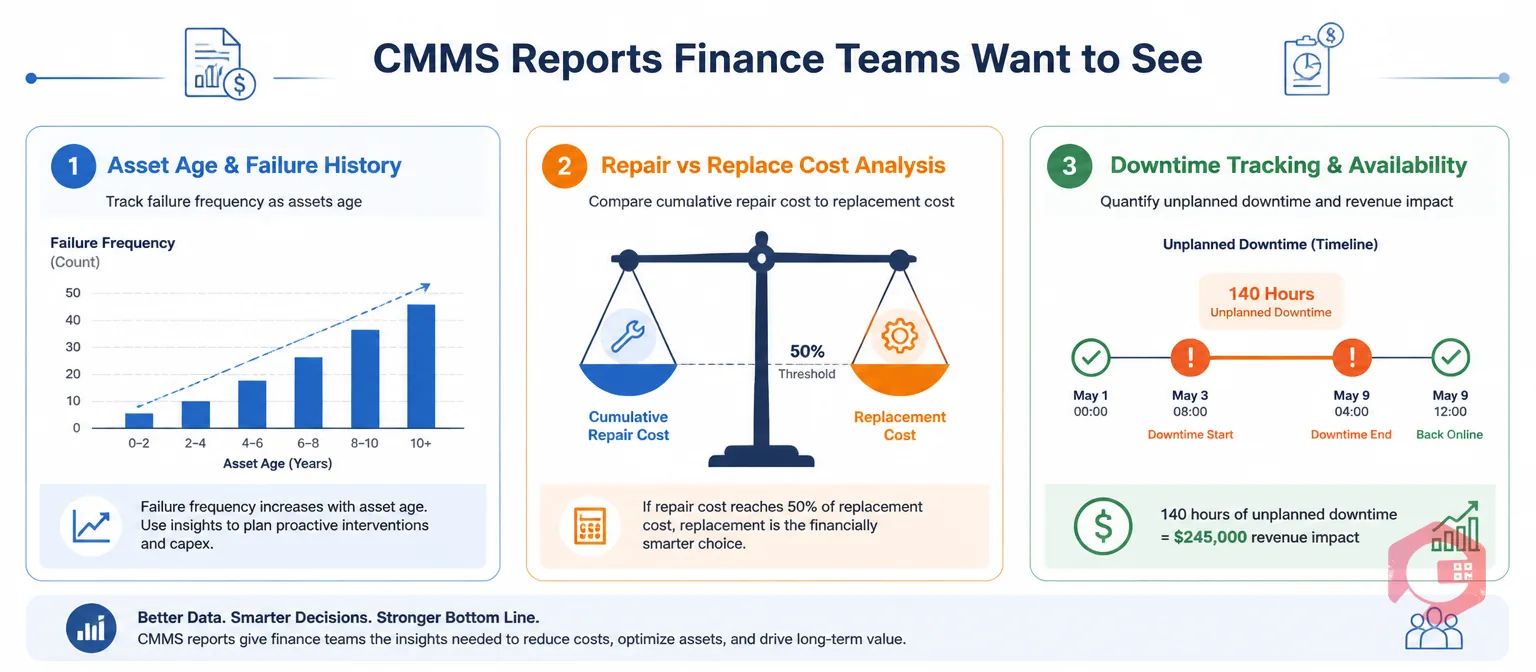
Not all CMMS reports are built for the boardroom. Finance teams don't want raw work order lists — they want translated data that speaks in dollars and risk. Here are the three report types that consistently move capital planning discussions forward.
An asset age report shows how old each piece of equipment is relative to its expected service life. Pair that with a failure frequency trend — how often the asset has needed corrective work over the past 12–36 months — and you have a compelling case for replacement. When an asset shows increasing failure frequency as it ages, the data tells a clear story: the cost of keeping it alive is rising while its reliability is falling. Finance teams respond to this pattern because it quantifies future risk in a language they already understand.
This is the most powerful report in a capital planning conversation. A custom report that totals cumulative repair costs for a specific asset over three to five years — then compares that figure against the capital cost of replacement — gives leadership a clear financial threshold. Many maintenance managers use a rule of thumb: when annual repair costs exceed 50% of replacement cost, replacement wins. But CMMS data lets you apply this framework to specific assets with real numbers instead of industry averages.
Downtime tracking data answers a question finance teams care deeply about: what is this asset's failure actually costing us in lost production or service capacity? When you can show that a single production line generated 140 hours of unplanned downtime last year — and translate that into revenue impact or labor cost — a capital replacement request stops looking like a maintenance expense and starts looking like a business investment.
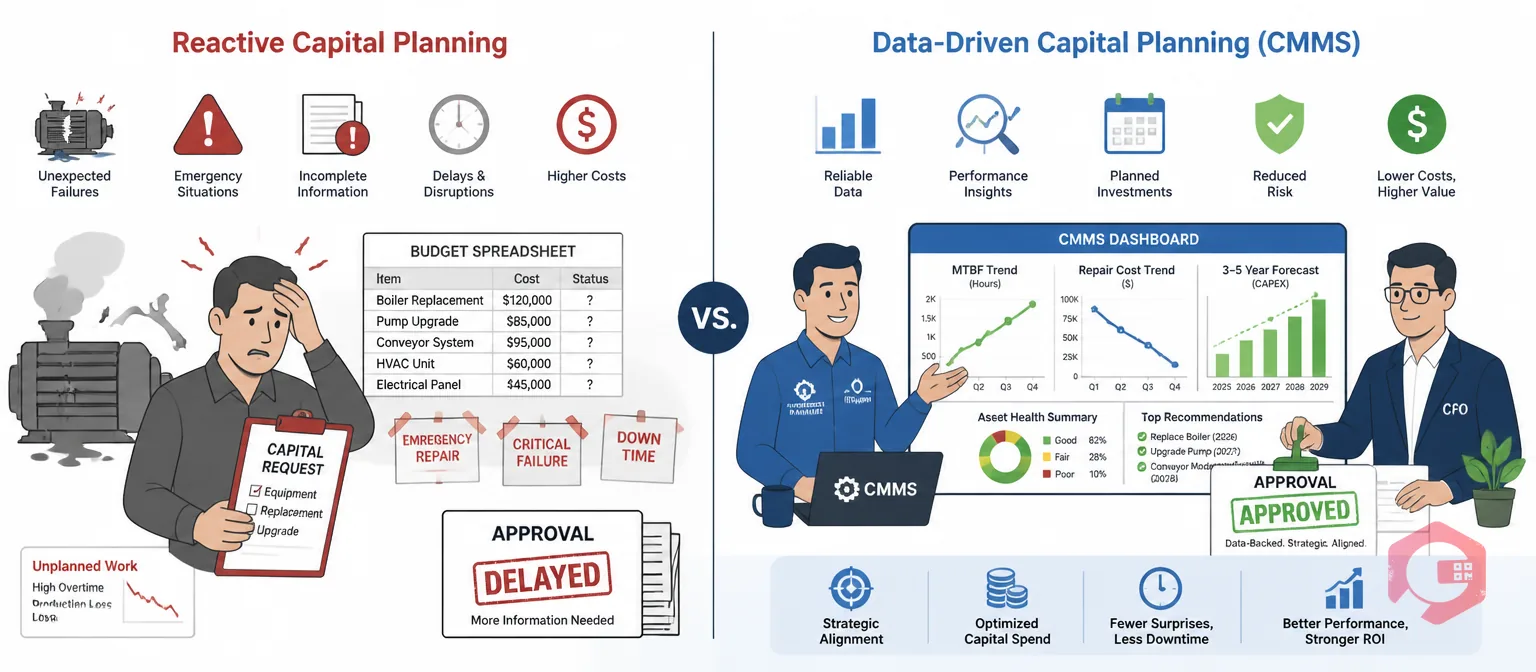
Understanding where your organization sits on this spectrum helps you see what's at stake when CMMS data gets left out of capital discussions.
| Planning Factor | Reactive Capital Planning | Data-Driven Capital Planning (CMMS) |
|---|---|---|
| Budget basis | Historical spend estimates and gut feel | Actual repair cost totals and failure trends from CMMS |
| Asset replacement trigger | Crisis failure or visible deterioration | Cost-per-run-hour threshold or MTBF decline curve |
| Finance team confidence | Low — requests seem anecdotal | High — backed by auditable maintenance records |
| Approval timeline | Multiple revision cycles, often delayed | Faster first-pass approval with supporting data |
| Risk of over/under-investment | High — missing context on true asset condition | Lower — decisions grounded in maintenance evidence |
| Forecasting horizon | 1 year or less | 3–5 year rolling asset replacement forecast |
The data alone isn't enough — how you present it matters. Maintenance managers who succeed in capital planning conversations have learned to translate maintenance metrics into business impact before walking into the room.
Here's a practical framework that works:
According to McKinsey's Operations Practice, organizations that tie maintenance data to financial outcomes in capital reviews reduce unplanned capital expenditure by up to 30% over a five-year period.
One of the most valuable uses of CMMS data in capital planning is building a rolling multi-year asset replacement forecast. Rather than responding to one aging machine at a time, a well-structured CMMS lets you see your entire asset fleet's age profile and project replacement demand over the next three to five years.
This kind of forecast answers the question every CFO has: "What capital commitments are we looking at in years two, three, and four?" It also helps organizations avoid the situation where multiple major assets reach end-of-life in the same budget year — a scenario that can overwhelm capital budgets and force emergency spending.
Building this forecast requires three data inputs your CMMS already holds:
The BI dashboard in a modern CMMS can surface this view automatically, giving maintenance and finance teams a shared visual they can reference throughout the capital planning cycle. The ISO 55000 Asset Management standard specifically calls for lifecycle cost data to inform capital investment decisions — CMMS provides exactly that evidence base.
Cryotos CMMS is built to generate the exact data formats that capital planning conversations require. The platform's maintenance management tools let teams create custom cost reports segmented by asset, department, or facility — so you can pull three years of repair spend on a specific machine in minutes, not hours.
Cryotos tracks downtime by asset and plant, calculates availability percentages, and surfaces MTTR and MTBF trends automatically. When maintenance managers need to build a repair-vs-replace case, the data is already structured and auditable — ready to drop into a board presentation or capital request document.
The platform's asset tracking module records installation dates, service history, and component-level maintenance costs, giving you the full lifecycle cost picture that finance teams need. And because Cryotos integrates with ERP systems like SAP and Microsoft Dynamics 365, your maintenance cost data flows directly into the financial systems your CFO already works in — no manual export required.
Organizations using Cryotos have reported 30% reductions in downtime and 25% faster repair cycles, which translates directly into lower emergency capital spending and more predictable asset lifecycles. The BorgWarner team found that structured CMMS data gave them a clear asset condition baseline they could present to leadership — see the full story in the BorgWarner case study.
The most useful CMMS data for capital planning includes cumulative repair cost per asset (3–5 years), MTBF trend over time, total downtime hours and their production impact, asset age vs. expected service life, and spare parts spend by asset. Finance teams respond best when these data points are translated into total cost of ownership figures and compared directly to replacement cost.
Start by pulling your asset's repair cost history from the CMMS and calculating the annual cost trend. Compare cumulative repair spend against the current capital replacement cost. Add downtime data translated into lost production or service value. If annual repair costs are approaching or exceeding 40–50% of replacement cost, or if MTBF has declined significantly, you have a strong financial case. Present this as a cost-comparison table, not a maintenance report.
CMMS data complements rather than replaces capital planning tools like NPV analysis or depreciation schedules. What it adds is real-world maintenance evidence that traditional financial models lack — actual failure rates, true cost-per-hour data, and condition-based signals. Used together, CMMS evidence and financial modeling produce far stronger capital proposals than either approach alone.
Most organizations benefit from a quarterly review of key asset health metrics — particularly repair cost trends and downtime frequency — with a full capital planning data pull done annually at the start of each budget cycle. Assets flagged as high-risk or approaching end-of-life should be reviewed more frequently, ideally monthly, so emerging issues don't become emergency capital requests.
Maintenance budgeting covers recurring operational expenses — labor, parts, and preventive maintenance contracts. Capital planning covers long-term investments in new or replacement assets that appear on the balance sheet as capital expenditures. CMMS data is relevant to both: it feeds operational budget forecasts through historical spend data, and it feeds capital planning through asset lifecycle and failure analysis that identifies when assets need replacement rather than ongoing repair.
If your maintenance team is still walking into capital planning meetings with spreadsheets and anecdotal evidence, it's time to change the conversation. Cryotos CMMS gives you the structured asset data, cost reports, and lifecycle analytics that turn maintenance insights into capital planning proof. Request a demo today and see how your maintenance data can drive smarter capital investment decisions.


Cryotos AI predicts failures, automates work orders, and simplifies maintenance—before problems slow you down.


