
Measuring CMMS adoption means tracking whether your maintenance team is actually using the system — not just whether they have access to it. A Computerized Maintenance Management System that sits mostly unused delivers none of the downtime reduction, data quality improvement, or cost visibility it was implemented to produce. According to SMRP maintenance best practice benchmarks, organisations with high CMMS adoption rates achieve PM compliance rates 35% higher and reactive-to-planned maintenance ratios that are significantly better than those where adoption is partial or inconsistent. The difference between a CMMS that transforms maintenance operations and one that collects dust as an expensive work order log almost always traces back to how rigorously adoption was measured and managed after go-live.
Key Takeaways
CMMS adoption is often defined too narrowly. Many implementation teams declare success when the system is live, users have logins, and the first PM schedules are running. That definition confuses deployment with adoption. Deployment means the system is available. Adoption means the team is using it consistently, for the right tasks, in the right way.
A maintenance team that creates work orders in the CMMS but closes them verbally to a supervisor rather than through the system has low work order closure adoption. A team that completes PM tasks on schedule but records them on paper and later bulk-enters them at the end of the week has low real-time data adoption. A team where technicians use the mobile app but supervisors only check the system once a week has asymmetric adoption — strong at the execution layer, weak at the management layer. Each of these patterns produces different data quality problems and requires a different intervention.
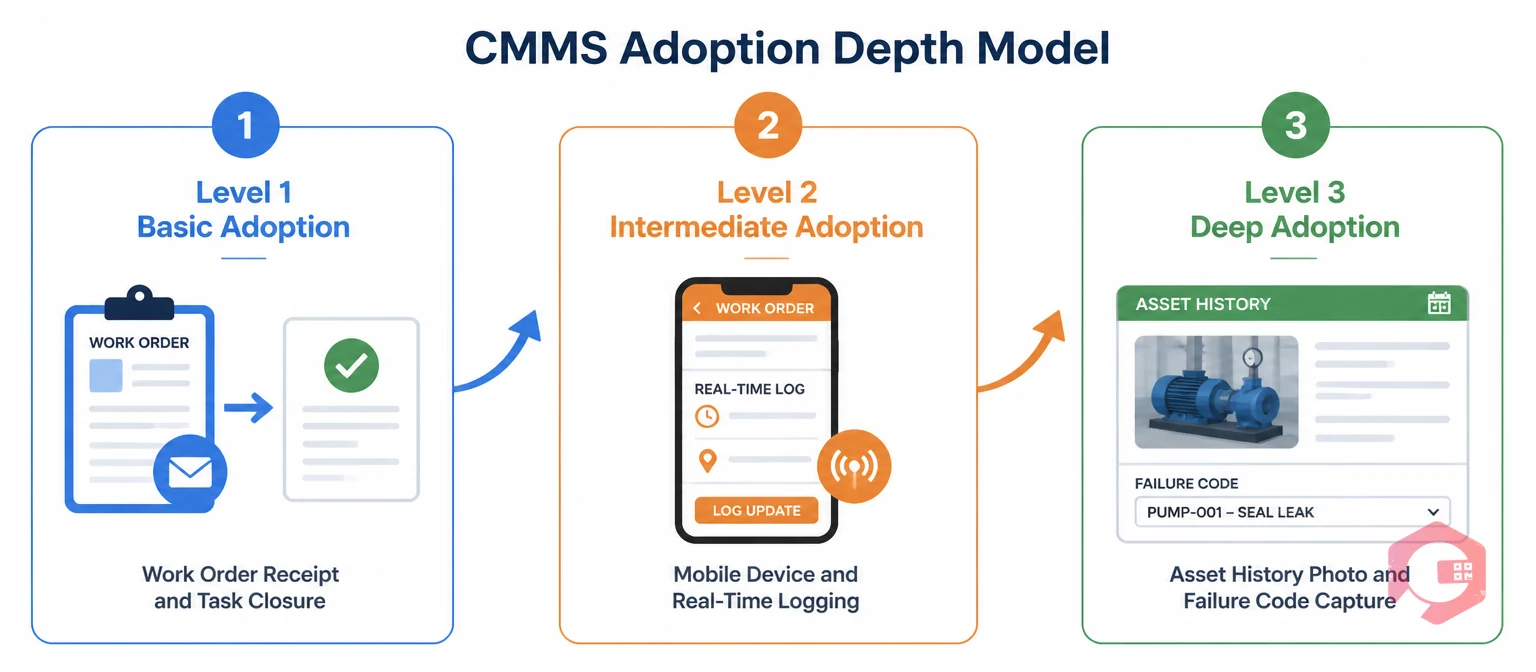
Adoption also has depth, not just breadth. A technician who uses the system to receive and close work orders is at a basic adoption level. A technician who also captures meter readings, attaches photos of failure conditions, records parts used against specific work orders, and reads the asset history before starting a complex repair is at a deep adoption level. Deep adoption is what produces the data quality that makes a CMMS genuinely valuable — the failure history, the cost records, and the condition data that drive better maintenance decisions over time. Measuring only whether technicians log in misses most of this.
Finally, adoption is not static. Teams that achieve high adoption at month three often drift by month six if measurement and reinforcement are not sustained. The only way to detect and arrest that drift before it becomes entrenched is to track adoption metrics continuously — not just during the post-go-live period.
The most useful adoption metrics divide into two categories. According to Plant Engineering research on maintenance management, organisations that track leading adoption indicators weekly respond to adoption problems 3x faster than those monitoring only monthly lagging outcomes. Leading indicators are process metrics — they tell you whether the right behaviours are happening today, before you can see their effect on outcome data. The most important leading indicators are daily active user rate (are people logging in?), work order closure rate within 24 hours (are technicians closing jobs in real time rather than batching at shift end?), and mobile session frequency per technician (are field workers using the app where the work happens?). These metrics move fast — a drop in daily active users this week tells you something changed this week, not six weeks ago. If you catch a leading indicator declining quickly, you can intervene before the behaviour becomes habit.
Lagging indicators are outcome metrics — they tell you whether adoption is producing the results it was implemented to generate. The most important lagging indicators are PM compliance rate (is the preventive maintenance schedule actually being executed?), data completeness rate (are work orders being closed with the required information?), and the ratio of reactive to planned maintenance (is the CMMS enabling a shift from firefighting to planned work?). These metrics move slowly and reflect the cumulative effect of adoption behaviours over weeks and months. A PM compliance rate that has risen from 65% to 88% over six months is evidence that adoption is working. A PM compliance rate that is stuck at 65% despite good daily active user numbers suggests that people are logging in but not completing or accurately recording their PM work.
The key insight is that leading indicators should be reviewed weekly, lagging indicators monthly. If you wait to see lagging indicators decline before taking action, you are already six to eight weeks behind the problem. Leading indicators give you the early warning signal that lets you intervene while the intervention is still manageable.

These six metrics together cover the full adoption picture — breadth of system use, depth of data capture, and quality of outcomes. Each one has a defined benchmark and a clear interpretation when it falls short.
Daily active users (DAU) as a percentage of total users is the most fundamental adoption signal. If 30 technicians are licensed in the system and only 18 log in on a typical working day, 40% of your user base is not engaging with the platform. The benchmark for a mature implementation is 80% or higher on working days. A DAU rate below 60% almost always indicates that a specific shift, team, or role has abandoned active use — and that the supervisor for that group has not reinforced the expectation.
Work order closure rate within 24 hours measures whether technicians are completing the job record at the point of work rather than deferring it. A work order closed three days after the job was completed captures little useful information — the technician's memory of what parts were used, what was found, and how long the job took is already unreliable. The benchmark is 80% of all corrective work orders closed within 24 hours of the job start. Below 65% signals that either the mobile experience is creating friction (the app is not with the technicians in the field) or that supervisors are not reinforcing same-session closure as an expectation.
PM compliance rate is the most operationally significant lagging adoption metric — and the one that most directly measures whether the CMMS is producing its core value. A PM schedule that exists in the system but is not being completed through the system (because technicians are completing the physical task but not recording it) will show as low PM compliance even if the maintenance work is actually being done. Closing this gap requires distinguishing between PMs that are genuinely being skipped and PMs that are being done but not recorded. If your actual PM compliance on the floor is higher than what the CMMS shows, you have a recording adoption problem. If they match and both are low, you have a scheduling or capacity problem. The benchmark target is 85% compliance within the first three months, rising to 90%+ by month six.
Data completeness rate measures the percentage of closed work orders that contain the required information fields — failure code, closure notes, parts used, and labour time. This metric has no industry benchmark because "required fields" vary by organisation, but a practical target is 90% of corrective work orders with all four core fields completed. Data completeness below 70% means your maintenance history is too thin to be analytically useful — you cannot identify failure patterns, calculate accurate per-asset maintenance costs, or build a credible root cause analysis from incomplete records.
Mobile usage percentage measures the share of work order interactions that happen through the mobile app rather than a desktop browser. For maintenance teams that work on the floor rather than at a desk, a mobile usage percentage below 60% almost always means that technicians are not carrying the system with them to the job — they are returning to a fixed terminal to log work after the fact. This is the single biggest driver of incomplete and inaccurate data. Technicians who log work from memory an hour or a shift after the event consistently underreport parts used, underestimate labour time, and miss the specific failure observations that are most diagnostically valuable. The benchmark for a field maintenance team is 75%+ mobile usage. Cryotos's mobile CMMS supports full offline operation, so connectivity on the floor is not an excuse for low mobile usage.
Time-to-first-interaction for new work orders measures how quickly a technician opens and acknowledges a work order after it is assigned to them. For reactive work orders, a target of under two hours during working shifts is a reasonable benchmark. For PM work orders, a target of acknowledgment before the scheduled start date is appropriate. Long time-to-first-interaction on reactive work orders signals notification delivery problems or a culture where technicians check the system infrequently. This metric is the system-level equivalent of mean time to acknowledge (MTTA) — and like MTTA, it is often the most fixable adoption gap once it is identified.
Fleet-level adoption averages are the least useful adoption measurement because they mask role-specific gaps. A maintenance team where every supervisor logs in daily, most day-shift technicians use the mobile app, and night-shift technicians log nothing will show an average DAU rate of perhaps 65% — which looks acceptable but hides the fact that an entire shift is completely disconnected from the system. Role-by-role measurement is what surfaces these gaps.
Technician adoption should be measured separately from supervisor adoption and management adoption because each role uses the system differently and the failure modes for each are different. The primary adoption metric for technicians is same-session work order closure rate — the percentage of jobs where the technician closes the record during or immediately after the work. A technician adoption problem almost always manifests as low real-time closure and high batch-entry of work orders at shift end or not at all. The fix is a combination of mobile access verification (does the technician physically have their device on the floor?), friction reduction (is the closure workflow too many taps?), and supervisor reinforcement (does the supervisor check closure rates at the end of each shift?).
Supervisor adoption should be measured by dashboard interaction frequency — how often does the supervisor review the open work order queue, PM compliance status, and overdue task list through the system? A supervisor who manages the team verbally without using the system's visibility tools cannot catch data quality problems before they become patterns. The target for supervisors is daily active use. A supervisor who logs in fewer than three times per week is managing blind — making decisions without the current work order status, backlog view, or PM schedule that the system provides.
Management adoption should be measured by reporting interaction — how often do maintenance managers and plant managers pull BI reports, review KPI dashboards, and use system data in planning decisions? Management adoption is the layer that makes everything else matter. When leadership reviews CMMS data in operational meetings and makes resource decisions based on what it shows, the message to the team is that the data they capture has consequences. When leadership never references CMMS data, the implicit message is that capturing it accurately is optional. Cryotos's BI Dashboard is specifically designed to surface the metrics that matter to management — asset availability, PM compliance, downtime by cause, maintenance cost per asset — in a format that makes weekly review a three-minute activity rather than a data-gathering exercise.
Shift-by-shift measurement is equally important and frequently overlooked. If your day shift shows 88% work order closure rate and your night shift shows 42%, the problem is not a system problem — it is a supervision and culture problem specific to night shift. Identifying this gap requires filtering adoption data by shift, not just by role. Your report builder should be configured to produce shift-level adoption summaries weekly so these disparities are visible in the regular management review.
Adoption stalls follow recognisable patterns. Understanding which pattern you are facing determines what intervention will actually work.
The most common stall pattern is the post-honeymoon drift. McKinsey research on technology transformation consistently finds that the biggest predictor of long-term adoption is whether line managers actively reinforce the new behaviour — not the quality of the initial training. Adoption starts strong in the first two to four weeks — everyone is paying attention, supervisors are actively reinforcing, and the novelty of the new system keeps engagement high. Then it drifts. Work orders start being closed less completely. Mobile usage drops. PMs get logged in batches rather than in real time. The cause is almost always that supervisor reinforcement has relaxed — the daily check-ins on work order closure rates stopped, the team's adoption metrics stopped being reviewed in the weekly meeting, and the implicit signal became that old habits were acceptable again. The fix is not more training. It is reinstating the supervisor reinforcement behaviours that drove initial adoption: daily closure rate checks, weekly adoption metric reviews, and direct conversations with technicians whose usage has dropped.
The second stall pattern is role asymmetry — strong adoption in one group and near-zero adoption in another. This is most common across shifts but also appears between departments or between highly motivated early adopters and resistant experienced technicians. The diagnostic question is whether the low-adoption group has a different supervisor, a different physical work environment, or a different set of work types. If the low-adoption group works primarily on complex repairs that don't fit neatly into the work order templates, the system configuration may need adjustment. If they have a different supervisor, the intervention is with that supervisor. If they are experienced technicians who perceive the system as adding bureaucracy to their existing workflow, the intervention is demonstrating — with their own data — that the system's asset history has made their diagnosis faster, not slower.
The third stall pattern is data fatigue — users are logging work orders but cutting corners on data quality because the required fields feel burdensome relative to the perceived value. This typically manifests as rising closure rates alongside falling data completeness rates: people are using the system but not using it well. The fix is a field-level audit of the required fields to identify which ones are generating the most abandonment, followed by a conversation about why each field matters. Required fields that cannot be justified to the team filling them out should be considered for removal — a maintenance record with fewer well-filled fields is more valuable than one with many poorly filled fields. The work order management configuration in Cryotos allows customisation of required fields per work order type, so you can set different requirements for simple reactive repairs versus complex planned maintenance jobs.
The fourth stall pattern is technical friction — the system is genuinely harder to use in the field than it should be. This can be a mobile app performance issue, a connectivity problem on the floor, a work order template that requires too many steps for simple jobs, or a notification system that isn't reliably reaching technicians. Technical friction is the easiest stall pattern to fix once it is identified — but it is frequently misdiagnosed as resistance when the real problem is that the system is genuinely inconvenient. The diagnostic test is to shadow a technician through a complete work order cycle and measure every point of friction yourself. If the closure process takes seven taps and two form pages for a 15-minute job, the friction is real and the fix is configuration, not culture change.
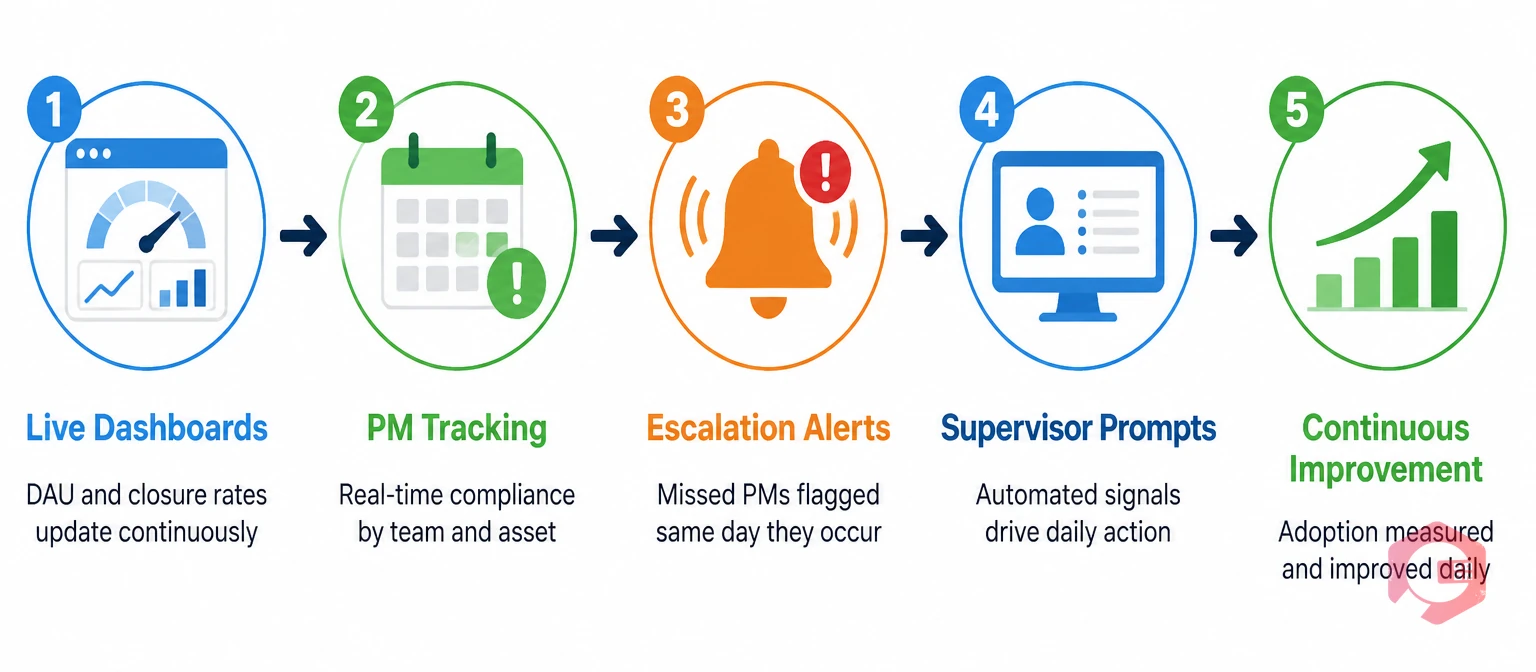
Measuring adoption manually — pulling login records, counting work orders, checking PM completion rates by hand — is time-consuming and produces data that is already stale by the time it reaches a supervisor. Cryotos makes adoption measurement automatic by surfacing the metrics that matter on live dashboards that update continuously.
The Cryotos BI Dashboard tracks daily active user counts, work order closure rates, PM compliance by team and by asset, and data completeness indicators across the full maintenance operation — without any manual report compilation. Supervisors can set up a morning dashboard view that shows them, before the shift briefing, exactly who has open work orders from the previous day, which PMs are at risk of missing their window, and which technicians have not interacted with the system in the past 24 hours. This turns adoption monitoring from a weekly retrospective exercise into a daily operational practice.
The preventive maintenance software module tracks PM completion rates in real time, broken down by task type, asset, and assigned technician. When a PM is generated, assigned, and not acknowledged within a configurable window, Cryotos sends an escalation notification — so missed PMs are caught the day they are missed rather than during the monthly compliance review. This real-time visibility is what separates a PM compliance rate that improves from one that stagnates: the gap between the scheduled date and the catch-up date determines how much protective value is lost from each missed task.
Cryotos also surfaces adoption signals through its notification and escalation framework. If a technician has not logged into the system for 48 hours, the supervisor can be automatically notified. If a work order has been open for more than 72 hours without a status update, it flags for review. If the data completeness rate on closed work orders for a specific team drops below a configurable threshold, the report builder generates an alert. These automated signals convert the passive availability of adoption data into active management prompts — closing the gap between what the data shows and what supervisors need to do about it.
Measuring adoption across your maintenance team is not a one-time post-implementation task — it is an ongoing management discipline that determines whether your CMMS investment continues to deliver value or quietly erodes into partial use. Cryotos gives maintenance managers the live dashboards, automated alerts, and role-level reporting to keep adoption visible, measurable, and improvable every day. Schedule a free demo to see how the adoption measurement tools work across your specific team structure and work order types.
A daily active user rate of 80% or higher among licensed users, combined with a work order closure rate above 80% within 24 hours, represents strong adoption for a maintenance team in the first three to six months after go-live. World-class implementations also target PM compliance above 90% and data completeness above 85% on corrective work orders. These benchmarks should be approached as improvement targets rather than day-one expectations — a team at 65% DAU and 70% closure rate in month one that is trending upward week over week is performing well.
Leading indicators — daily active users, work order closure rate, mobile usage percentage, and time-to-first-interaction — should be reviewed weekly by supervisors and daily for teams in the first 60 days after go-live. Lagging indicators — PM compliance rate, data completeness, and reactive-to-planned ratio — should be reviewed monthly. The weekly cadence for leading indicators is what enables early intervention when adoption starts to drift, before the behaviour becomes an established pattern that is harder to reverse.
The most common cause is the withdrawal of the active management attention that drove initial adoption. In the first weeks after go-live, supervisors are checking closure rates daily, management is asking about adoption in every meeting, and the implementation team is actively monitoring and correcting problems. When this attention relaxes — which it typically does after four to six weeks — old habits reassert themselves. The fix is not to maintain crisis-level attention indefinitely but to transition to a sustainable weekly adoption monitoring routine that keeps adoption metrics visible in normal operational reviews.
Adoption measures whether users are engaging with the system consistently — the breadth and frequency of use. Utilisation measures whether users are using the right features for the right tasks — the depth and quality of use. A team can have high adoption (everyone logs in daily) but low utilisation (they only use the system to receive work orders and never capture failure codes, parts, or meter readings). Both dimensions need to be measured. Adoption without utilisation produces active users but poor data quality. High utilisation from a small fraction of users produces good data quality for some assets and none for others.
Start by diagnosing the specific type of resistance rather than applying a generic solution. If resistance is friction-based — the system is genuinely harder to use than the old process — the fix is configuration and UX improvement. If resistance is cultural — experienced technicians see the system as adding bureaucracy — the fix is demonstrating value using the resistors' own data: show them how the asset history in the system made a recent diagnosis faster, or how the PM schedule caught a failure before it caused downtime they would have had to respond to. If resistance is supervisory — supervisors are not enforcing usage expectations — the fix is a direct conversation with supervisors about their accountability for team adoption, not more end-user training.


Cryotos AI predicts failures, automates work orders, and simplifies maintenance—before problems slow you down.


