
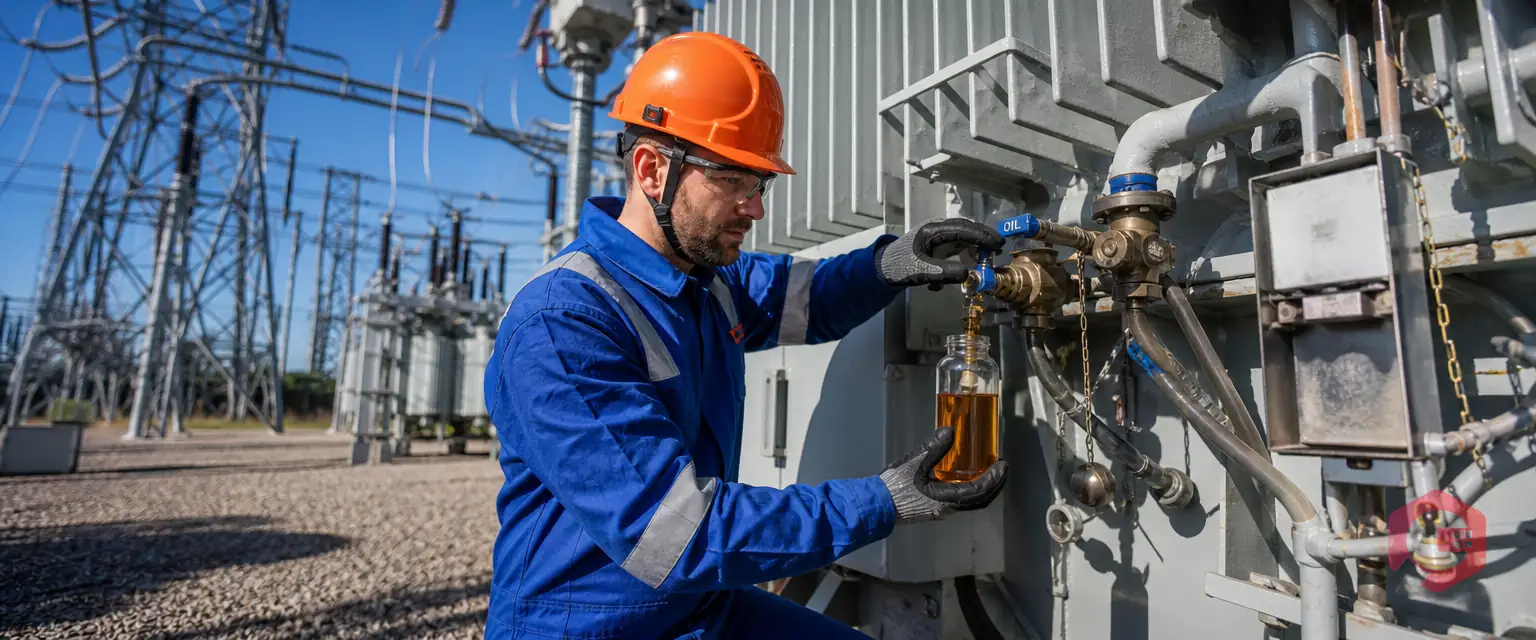
Dissolved gas analysis (DGA) detects active faults in oil-insulated electrical equipment by measuring the gases that form when insulating oil and paper break down under heat or electrical stress. Each fault type leaves its own gas signature. Arcing produces acetylene, overheating produces ethylene and methane, and partial discharge produces hydrogen.
Trending these gases over time tells you whether a transformer has a live problem, how severe it is, and how fast it is growing. That makes DGA the most widely used early-warning test for power transformers, reactors and tap changers. This guide covers the fault gases, the main interpretation methods, sampling schedules, and how to turn lab results into maintenance work.
Key Takeaways
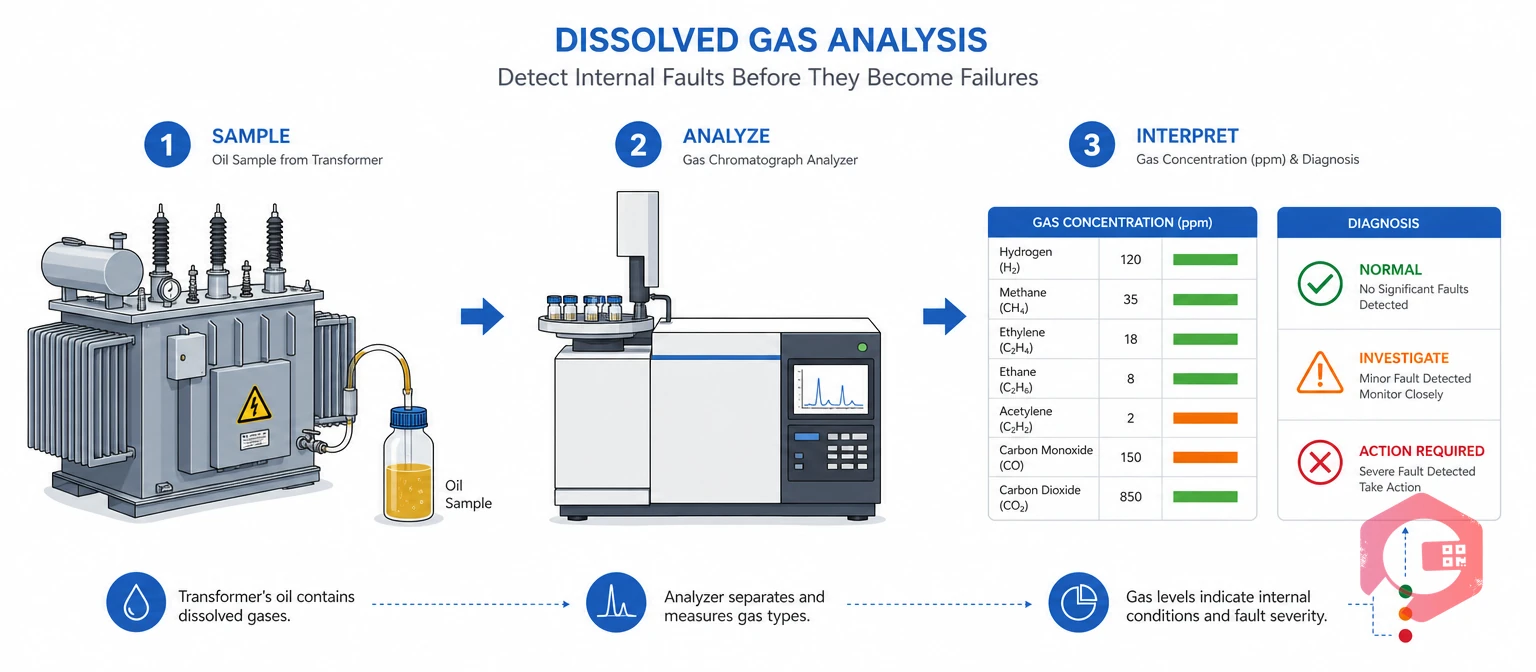
Dissolved gas analysis is a lab or online test that measures fault gases in the insulating oil of electrical equipment to find and classify internal faults. A small oil sample is taken from the equipment while it is in service. A gas chromatograph then separates and measures each gas in parts per million (ppm).
DGA is a core condition monitoring technique for electrical assets because the oil touches every internal part of a transformer. It works much like a blood test: the sample shows what is happening inside without any shutdown or teardown.
Two standards guide most dissolved gas analysis programs:
The core point is that DGA turns invisible chemical changes into measurable data you can trend and act on.
Dissolved gas analysis applies to any electrical asset that uses oil as insulation and coolant. Power transformers are the main use case, but the same test protects several other asset types.
Most facilities start with their biggest and most critical transformers. They add smaller units as the program grows. Start where a failure would cost the most.

A fault gas is a gas that forms when heat or electrical stress breaks down transformer oil or paper. Faults create these gases by breaking the chemical bonds in mineral oil and cellulose paper. The type of gas depends mostly on how much energy the fault releases and which material it attacks.
Overheating from loose connections, blocked cooling or stray flux breaks oil into methane and ethane at lower temperatures. As the hot spot gets hotter, ethylene takes over. Very hot faults can produce some acetylene as well.
Partial discharge is a low-energy electrical fault in gas voids or wet insulation. It mainly produces hydrogen with small amounts of methane.
Arcing is the most dangerous fault in a transformer. It releases high energy and produces acetylene along with hydrogen. Acetylene only forms at very high temperatures, so any steady rise is a red flag.
When the paper insulation overheats, it releases carbon monoxide and carbon dioxide. Paper damage cannot be repaired, so these gases often decide the remaining life of the transformer.
Every fault type leaves a chemical fingerprint, and reading that fingerprint is the core skill of DGA.
Dissolved gas analysis tracks seven main fault gases plus oxygen and nitrogen. The matrix below links each gas to the fault it most often points to.
| Gas | Formula | Main Fault Indicated | What It Tells You |
|---|---|---|---|
| Hydrogen | H₂ | Partial discharge, corona. | Low-energy electrical stress; also rises with most other faults. |
| Methane | CH₄ | Low-temperature thermal fault. | Oil heating below about 300°C, often with hydrogen. |
| Ethane | C₂H₆ | Low to medium thermal fault. | Oil overheating in the 300°C range. |
| Ethylene | C₂H₄ | High-temperature thermal fault. | Hot spots from about 300°C to over 700°C, such as poor joints or circulating currents. |
| Acetylene | C₂H₂ | Arcing, high-energy discharge. | Even a few ppm can mean an active arc; the most urgent gas to trend. |
| Carbon monoxide | CO | Cellulose (paper) overheating. | Thermal stress on solid insulation. |
| Carbon dioxide | CO₂ | Cellulose aging. | Normal aging, or paper damage when read as a CO₂/CO ratio. |
No gas tells the full story on its own, so labs read them together. A rise in hydrogen and acetylene together points to arcing, while hydrogen with only methane points to partial discharge.
Want to know what a transformer failure would cost your site? Try the unplanned downtime calculator to put a number on the risk.
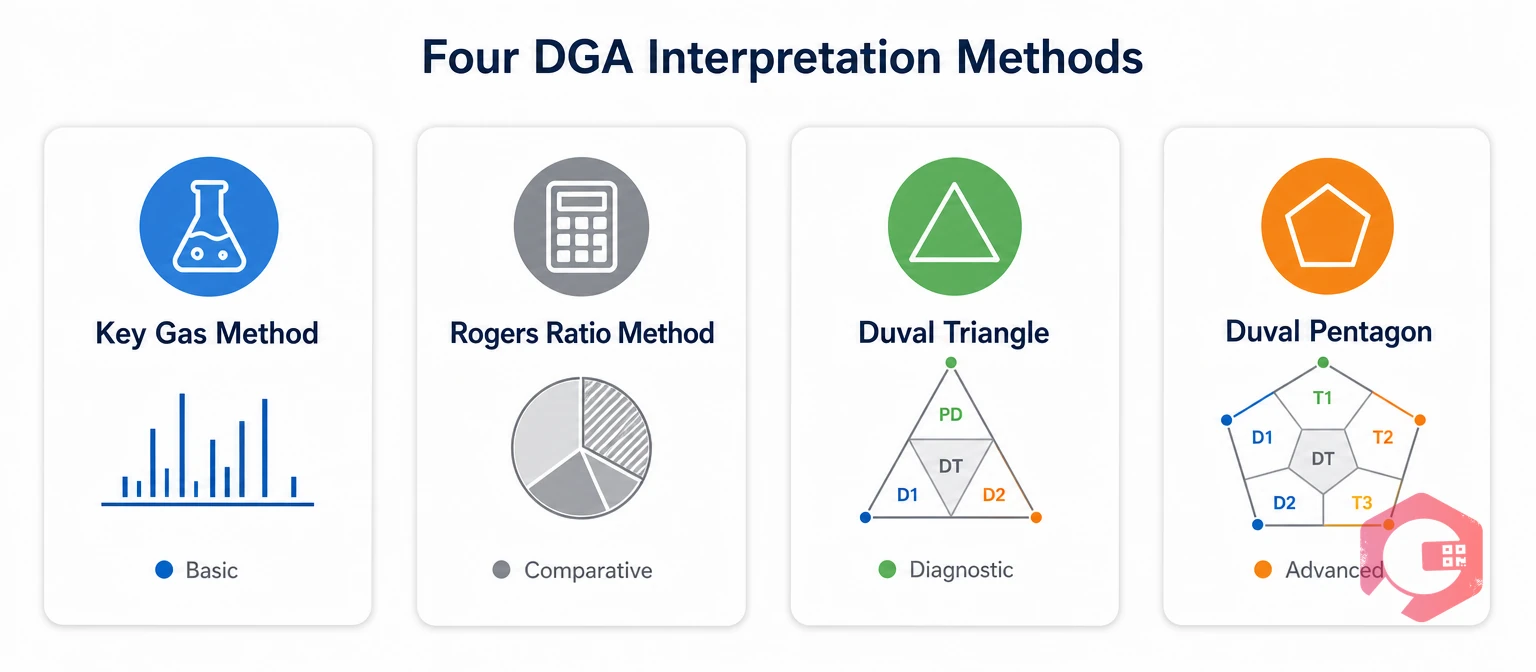
DGA interpretation methods turn raw gas readings into a likely fault type. Each method has strengths and blind spots, so experienced engineers use at least two.
| Method | How It Works | Advantages | Disadvantages |
|---|---|---|---|
| Key Gas Method | Looks at which single gas dominates the total. | Simple and quick for field screening. | Less precise when two faults overlap. |
| Rogers Ratio Method | Compares CH₄/H₂, C₂H₂/C₂H₄ and C₂H₄/C₂H₆ ratios against coded ranges. | Uses ratios, so results do not depend on oil volume. | Some gas patterns return no diagnosis. |
| Duval Triangle | Plots relative CH₄, C₂H₄ and C₂H₂ percentages into fault zones. | Always gives a diagnosis; widely used with IEC 60599. | Needs gases above detection limits to be reliable. |
| Duval Pentagon | Plots five gases: H₂, CH₄, C₂H₆, C₂H₄ and C₂H₂. | Helps resolve unclear or mixed-fault cases. | More complex; usually needs software. |
The Duval Triangle is the most common choice today because it always places a sample in a fault zone. Its zones cover partial discharge (PD), low and high energy discharges (D1, D2), and thermal faults at three temperature levels (T1, T2, T3). The dissolved gas analysis overview on Wikipedia shows how the Key Gas, Rogers Ratio, Duval Triangle and Duval Pentagon methods relate.
Use one method to screen, and a second to confirm before you plan an outage.

Dissolved gas analysis separates active faults from old gassing by comparing gas levels across several samples over time. A high reading can be left over from a fault that stopped years ago. A rising reading means the fault is still active.
An active fault is a fault that is still generating gas at a measurable rate between samples. The generation rate, usually expressed in ppm per day or per month, is the clearest sign of one.
The Four-Step DGA Fault Confirmation Ladder:
The US Bureau of Reclamation transformer maintenance guide (FIST 3-30) also bases its action levels on total combustible gas and monthly generation rates, not single readings. The rate of change is what turns a number into a decision.
A DGA sampling schedule should follow how critical the asset is and how it is running now. A fixed calendar alone is not enough. Healthy units need less frequent checks, while a unit with rising gases needs much closer watch.
| Asset Condition | Sampling Interval | Method | Escalation Trigger |
|---|---|---|---|
| Healthy, non-critical transformer | Every 12 months | Lab DGA. | Any gas above typical levels or a new acetylene reading. |
| Healthy, critical transformer (GSU, main substation) | Every 3–6 months | Lab DGA plus online monitor. | Rate of change above your baseline trend. |
| Caution: one or more gases rising | Monthly to quarterly | Lab DGA, confirm with resample. | Generation rate keeps rising across two samples. |
| Active fault suspected | Weekly or continuous | Online multi-gas monitor. | Acetylene increase or a sudden rise in total combustible gas. |
Online DGA monitoring is a sensor system fixed to the transformer that measures dissolved gases every few hours without manual sampling. It sends alarms on fast changes. Online monitors suit critical units and transformers already showing a fault, where waiting weeks for a lab result is too risky.
Connect online monitors to your maintenance system through IoT integration so readings and alarms create tasks automatically. Match the sampling interval to the risk, and tighten it the moment a trend starts climbing.
DGA results only stop failures when each bad result becomes a tracked task. Many maintenance teams still receive lab reports by email, file them, and act weeks later.
Store every DGA report on the asset record in a Computerized Maintenance Management System, so the trend history is one click away during a review. Linking results to work order management makes sure no flagged sample goes unanswered.
Maintenance teams using Cryotos have reported up to 30% reduction in unplanned downtime and 25% faster repair turnaround after linking condition data to structured work orders. Utilities and generating sites can also use dedicated power plant maintenance software to plan transformer outages around generation schedules. The fastest DGA program is the one where every red flag has an owner within hours.
Most utilities test healthy transformers once a year and critical units every three to six months. If any gas starts rising, shorten the interval to monthly or weekly, or install an online monitor until the trend is understood.
Acetylene is the most serious warning sign because it forms only at the very high temperatures of an electrical arc. Any new or rising acetylene reading in a main tank should trigger a resample and an engineering review right away.
No, DGA tells you the type and severity of a fault, not its exact location. Engineers combine DGA with electrical tests, infrared scans and load data to narrow down where the fault sits before opening the unit.
Lab DGA uses a sampled syringe of oil that is tested in a laboratory, giving high accuracy at set intervals. Online DGA monitors sit on the transformer and measure gases every few hours, so they catch fast-developing faults that a yearly lab test would miss.
Not always, because gases can remain from an old fault that is no longer active. The key question is whether the gas level is still rising between samples, which shows an active fault that needs action.
Dissolved gas analysis gives you weeks or months of warning before an oil-insulated asset fails, but only if every result reaches the right person. Schedule a free demo to see how Cryotos turns DGA findings into tracked work orders, trend history and planned outages.


Cryotos AI predicts failures, automates work orders, and simplifies maintenance—before problems slow you down.



