

The cost of equipment downtime is rarely a single number. It's a stack of direct and indirect costs that most maintenance teams never add up in one place. An hour of unplanned downtime can run from a few hundred dollars on a small line to well over $100,000 on a high-throughput line. It depends on production value, labor rates, and how long the fix takes. The only way to get a defensible figure for your own plant is to calculate it asset by asset, using real timestamps, real labor costs, and real parts spend, not an industry average pulled from someone else's operation.
Key Takeaways

Equipment downtime cost is the total financial impact of an asset being unavailable for production, measured from the moment it stops to the moment it's back to normal output. That figure covers more than the obvious lost output. It includes labor paid for idle time, expedited parts and freight, quality rework once the line restarts, and in regulated industries, potential compliance exposure.
Most maintenance teams can estimate this roughly. Few calculate it precisely, by asset, by shift, by failure mode. The inputs live in different systems.
That gap matters. Averaged numbers hide the parts of the plant where money actually leaks. A compressor that fails twice a year for two hours costs a plant very differently than a conveyor that stops for ten minutes a dozen times a shift, even if the total downtime hours look similar on a report. Computerized Maintenance Management System (CMMS) platforms close that gap. They tie every minute of downtime to a timestamped event, a burden rate, and a root cause.
The concept of downtime sounds simple, but the accounting behind it isn't. A single stoppage touches production, maintenance, quality, and sometimes customer service at once. Each team tends to track its own slice of the cost in its own system.
Downtime cost per hour swings widely depending on what's actually running. A few common patterns show up across sectors:
Most facilities that compare their downtime cost against an industry benchmark quickly learn the benchmark doesn't fit their product mix, batch size, or shift structure. A number built from your own overall equipment effectiveness data and your own labor rates is always more useful than an average pulled from someone else's plant.
This is one reason industry-wide downtime cost statistics should be treated as a starting point, not a target. They're useful for a rough sense of scale before you have your own data. Once real numbers start coming in from your own assets, those numbers should replace the benchmark, not sit alongside it.

A defensible downtime cost figure adds direct costs to indirect costs, then attaches both to a specific asset and failure event rather than a plant-wide average. Getting this right means breaking the number into layers instead of guessing at a lump sum.
The Four-Layer Downtime Cost Stack:
Maintenance teams using Cryotos have reported up to 30% reduction in unplanned downtime and 25% faster repair turnaround once they started tracking cost this way. That gap between guessing and tracking is usually the difference between a maintenance budget nobody trusts and one finance signs off on without a fight.
A downtime tracking module captures the direct costs automatically from work order and downtime data. Teams can then attach indirect cost factors per incident, so the total reflects what the event actually cost the business, not just the machine.
Numbers make the formula easier to apply. Take a packaging line that produces $2,400 worth of finished product per hour when running. It's staffed by four operators earning $28 an hour combined, plus one contractor called in at $150 an hour for a motor failure.
Add the four layers together, and that single hour of downtime cost the plant $3,503, not the $2,400 a rough estimate would have shown. Multiply an undercount like that across a year of stoppages, and it's easy to see why budgets built on lost-production estimates alone tend to come up short.
This is also why per-asset burden rates matter more than a single plant-wide rate. The same motor failure on a bottleneck line feeding three downstream stations would carry a much higher lost-production figure, even if the labor and parts cost were identical.
Run this same math across a full year and the pattern gets clearer. A plant that logs even ten similar stoppages a year on one bottleneck asset is looking at over $35,000 in downtime cost from that single machine alone. That's the kind of number a spreadsheet built after the fact almost never surfaces, because nobody sits down to add up twelve months of small events one by one.
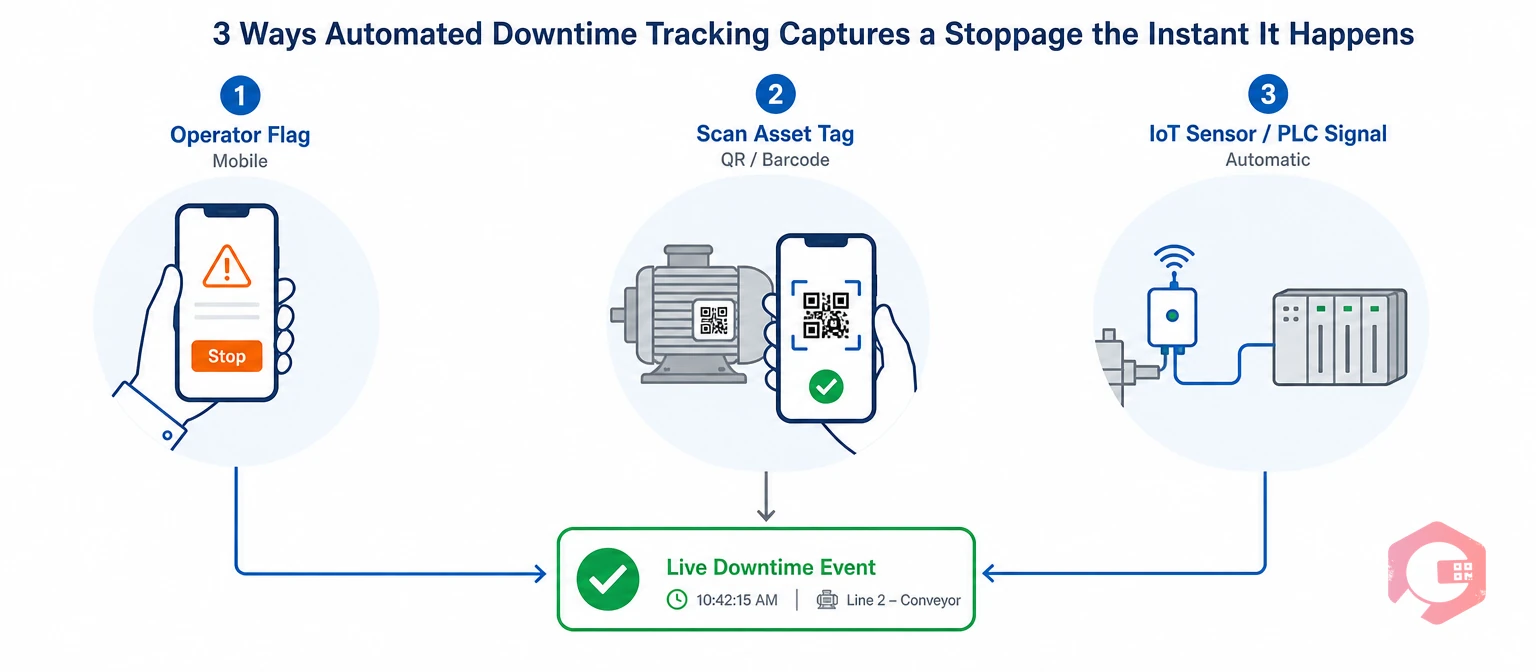
Manual downtime tracking undercounts nearly every incident. A whiteboard note, an end-of-shift log, a rounded-to-the-nearest-hour guess: nobody stops mid-crisis to write down the exact minute a machine went down. That rounding adds up fast across hundreds of stoppages a year.
Automated tracking removes that guesswork. It captures start and stop times the moment an asset's status changes to "down" or a corrective work order opens.
Once the clock starts automatically, teams can configure a burden rate for each asset or line. That means production value per minute, labor rate, contractor rate, and any standing penalty costs for SLA breaches or spoilage. From there, the system calculates the running cost of every downtime event on its own, instead of leaving it to a spreadsheet built weeks later.
The practical effect shows up on the shop floor. A stalled line no longer just reads "down 42 minutes" on a dashboard. It shows the dollar figure that number represents, live, while the technician is still working the fault. That single change, turning minutes into money in real time, is often what gets people moving faster.
Want to see where your own numbers land? Try Cryotos's unplanned downtime calculator to get a first estimate before setting up asset-level tracking.
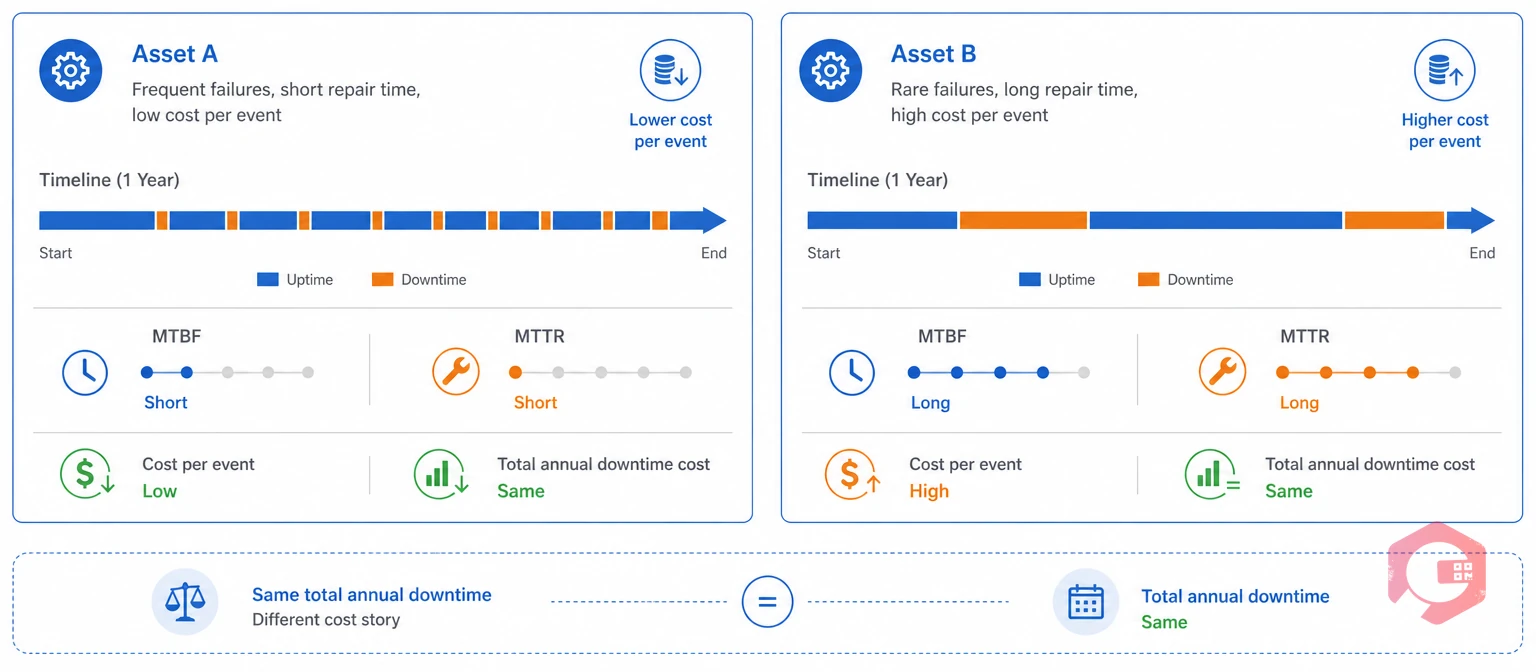
Mean Time Between Failures (MTBF) is the average time an asset runs before it fails. It tells you how often you're paying the downtime cost bill. Mean Time To Repair (MTTR) is the average time it takes to restore a failed asset to service. It tells you how large each bill tends to be. Neither number means much for cost purposes on its own. The two have to be read together, alongside the actual dollar figure attached to each event.
A machine with a short MTTR but a high per-event cost tells a different story than one that rarely fails but expensively so every time. Consider two assets with the same total annual downtime hours:
Reliability-centered maintenance programs treat these as two different problems. Asset A usually needs a root-cause fix aimed at the failure mode itself. Asset B usually needs a redundancy plan, a faster spare-parts pipeline, or a tighter preventive schedule, because when it goes down, the clock costs far more per minute.
Calculating both metrics automatically, then connecting them to the cost data for the same asset, turns a maintenance report into a decision-making tool. Cryotos calculates MTBF and MTTR automatically from the same timestamped events used for downtime cost, so the two numbers never have to be reconciled by hand.
Once downtime cost is tracked at the asset level over months rather than estimated once a year, it stops being a talking point. It starts driving actual budget and scheduling decisions.
When an asset's downtime cost history is visible over time, the case for replacement, redundancy, or a redesigned PM strategy stops being a judgment call. Leadership can compare the cost of continued failures against the cost of capital investment using the plant's own numbers, not a vendor's generic ROI slide.
A three-year downtime cost history on an aging asset often makes the case on its own. If a machine has cost $40,000 in downtime over three years against a $35,000 replacement price, the payback argument writes itself. But only if someone has that $40,000 figure on hand when the capital request comes up for review.
Instead of adjusting preventive maintenance intervals on a fixed calendar, teams can adjust them where the cost data justifies it. That means tightening PM frequency on assets whose failures are most expensive, and relaxing it where failure cost is low and current PM spend outweighs the risk.
This works in both directions. An asset with cheap, infrequent failures may be over-maintained. Pulling back PM frequency there frees up technician hours for the assets where the cost data shows the real risk sits.
Because cost is calculated the same way everywhere, one compressor's downtime cost per hour can be compared directly against another's. That's true across a line, a site, or an entire network, and it surfaces which equipment class deserves the next round of reliability investment.
Operations overseeing several plants can use this to settle a common argument: whether a site's higher downtime numbers reflect worse maintenance practices, or simply a higher-value product mix. Consistent cost calculation answers that question with data instead of opinion.
Contractor response time and repair cost are visible against the downtime they were called in to resolve. That gives maintenance leaders real data for vendor negotiations and service-level reviews, instead of anecdotal impressions of who's fast and who isn't.
A contractor who consistently takes twice as long as a competitor to resolve the same failure mode, at a similar rate, is costing the plant more than their invoice shows. That gap only becomes visible when downtime cost and contractor response time sit in the same record.
This kind of asset-level view lines up with the intent behind ISO 55000 asset management standards, which call for maintenance and investment decisions to be grounded in evidence rather than intuition. Most facilities that adopt this approach find the hardest part isn't the math. It's getting the underlying data to actually connect in the first place.
A computerized maintenance management platform earns its keep here by connecting data that otherwise lives in separate systems. Here's what that looks like in practice.
Cryotos's AI dashboard can also answer direct questions. "What did downtime cost us on Line 3 last quarter?" Or "Which failure mode cost us the most this year?" It returns a chart-based answer without a custom report or an analyst pulling data from three systems.
The result is a number built from the same timestamps, work orders, and parts data the maintenance team already captures every day, not a separate spreadsheet exercise bolted on at year-end.
Most facilities don't need to replace every process to start tracking downtime cost properly. A practical rollout usually starts with the assets that already show up most often in complaints, the ones everyone suspects are expensive but nobody has proven yet.
This staged approach avoids a common trap: trying to build a perfect cost model before capturing a single data point. A rough burden rate applied consistently from day one beats a perfect one that takes six months to agree on.
Even teams that genuinely try to track downtime cost often end up with a number that's lower than reality, usually for one of the same few reasons.
Common practice among maintenance teams that get this right is treating downtime cost the way finance treats any other cost center: tracked continuously, by category, with a clear owner for the number. A reliability-centered maintenance approach builds on exactly this kind of continuous, asset-level data rather than a once-a-year estimate.
Fixing these gaps rarely requires new equipment. It usually just requires moving the tracking from a whiteboard or a spreadsheet into a system that timestamps events automatically and keeps the cost data attached to the asset. That one change alone closes most of the five gaps above without any additional headcount or hardware.
Add the production value lost per minute, labor and contractor cost, parts and expedited freight, and any indirect costs like SLA penalties or rework, then multiply by the length of the event. Doing this per asset, rather than as a plant-wide average, gives the most useful number.
It varies enormously by industry and line, ranging from a few hundred dollars to well over $50,000 an hour on high-volume lines. The only reliable figure is the one calculated from your own production value, labor rates, and historical repair costs.
A complete figure includes both. Lost production value is only one layer. Labor, parts, contractor invoices, and indirect costs like scrap or SLA penalties all belong in the total, because they're all money the stoppage actually cost the business.
Planned downtime happens during a scheduled maintenance window the team chose, so it's budgeted and controlled. Unplanned downtime is an unscheduled stoppage caused by a failure. It typically costs more per hour because it interrupts production without warning and often requires expedited parts or contractor call-outs.
Yes. A CMMS with downtime tracking can timestamp every stoppage automatically, apply a configured burden rate per asset, and roll labor, parts, and contractor costs from the linked work order into a single running total, without a manual spreadsheet.
Because cost depends on what the asset was doing when it stopped, not just how long it was down. A bottleneck machine feeding an entire line costs far more per minute of downtime than a redundant unit with a backup already running, even if both are down for the same length of time.
Monthly is a reasonable minimum for spotting trends by asset and failure mode. Reviewing live dashboards during an active stoppage also helps teams prioritize which fault to resolve first when several assets are down at once.
Pick five to ten assets with the most frequent stoppages or the highest suspected cost. Set a rough burden rate for each one, then let the system log real events for a month. That first month of real data usually reveals more than a year of guessing ever did.
The honest answer to "how much does an hour of downtime cost?" is different for every asset, every line, and every plant. It changes over time as production value, labor rates, and equipment condition shift. Treating it as a fixed number, or an average copied into a budget spreadsheet, hides exactly the information a maintenance leader needs most: which failures are actually expensive, and where the next dollar of reliability spend will do the most good.
Cryotos turns downtime cost from an annual estimate into a live, asset-level number, built from the same timestamps, work orders, and parts data the maintenance team already captures. Schedule a free demo to see how Cryotos can make that number one your team and your finance department can both trust.

Cryotos AI predicts failures, automates work orders, and simplifies maintenance—before problems slow you down.



