
The fishbone tool for root cause analysis is a structured diagram that maps every possible cause of a problem back to its source — giving maintenance and quality teams a visual way to stop failures from repeating. Also called the Ishikawa diagram or cause-and-effect diagram, it organises potential causes into six standard categories so your team investigates the full picture, not just the most obvious symptom.
According to ASQ, facilities using structured root cause analysis methods reduce recurring failures by up to 40% compared to informal troubleshooting. This guide walks you through every step — from drawing your first fishbone to acting on what it reveals — with a real maintenance example you can follow.
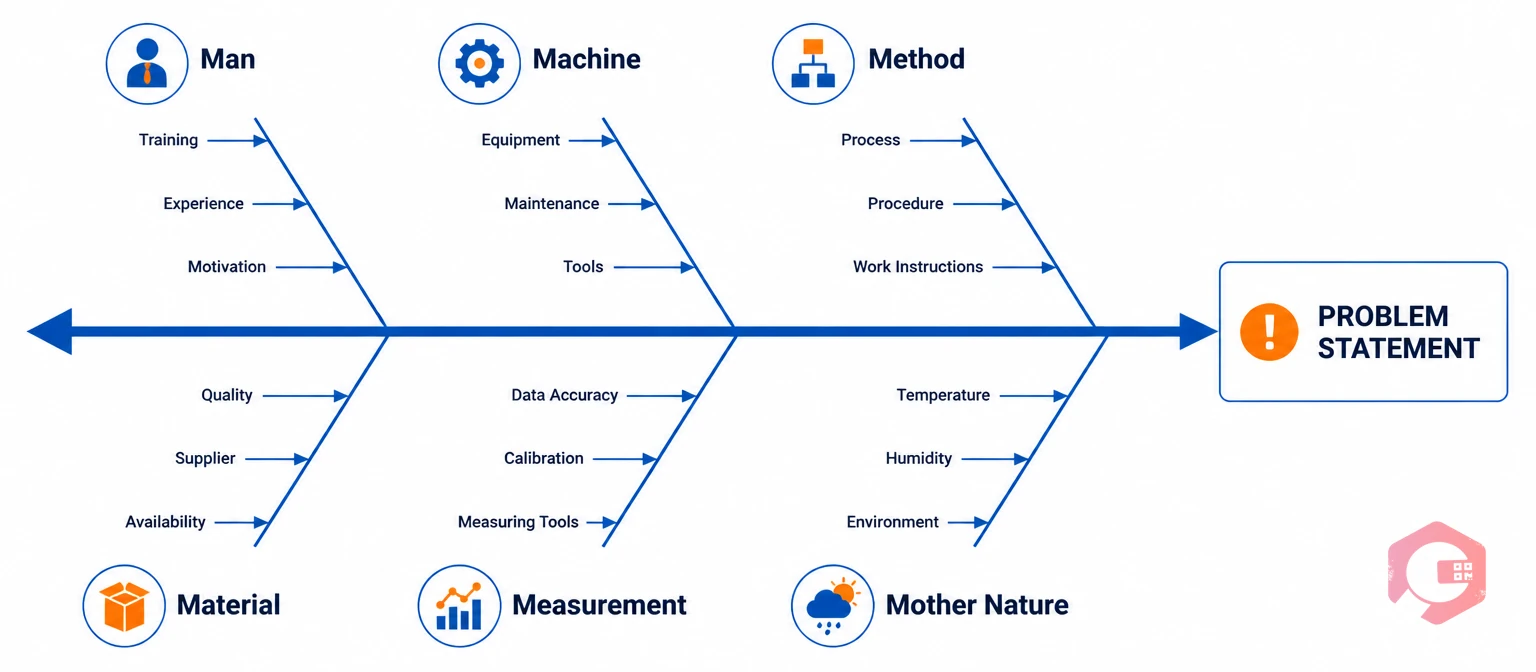
The fishbone tool is a cause-and-effect diagram shaped like the skeleton of a fish. The problem you're investigating sits at the head. The bones branching off the spine represent categories of potential causes. Your team adds specific causes onto each bone during a brainstorming session until you've mapped every plausible path to the failure.
Japanese quality engineer Kaoru Ishikawa developed the diagram in the 1960s while working with Kawasaki's manufacturing teams. It became a cornerstone of the Six Sigma and lean quality toolkits because it makes invisible cause chains visible in a format anyone on the floor can read and contribute to.
The name comes purely from its shape. A horizontal arrow points right toward the problem statement (the head). Diagonal lines branch off above and below (the major bones), each labelled with a cause category. Smaller lines branch off those (the minor bones) for specific causes within each category. The finished diagram looks unmistakably like a fish skeleton — which is why both names, "fishbone" and "Ishikawa," are used interchangeably.
Both are root cause analysis tools, but they serve different situations. The 5 Whys works best for straightforward, single-path problems where you can trace one chain of causes. The fishbone is better when a failure could stem from multiple independent sources — for example, a machine producing defects that could equally be caused by worn tooling, an untrained operator, or an inconsistent material batch. If you're unsure which to use, start with the fishbone to map the landscape, then apply 5 Whys to drill into the most likely branch.
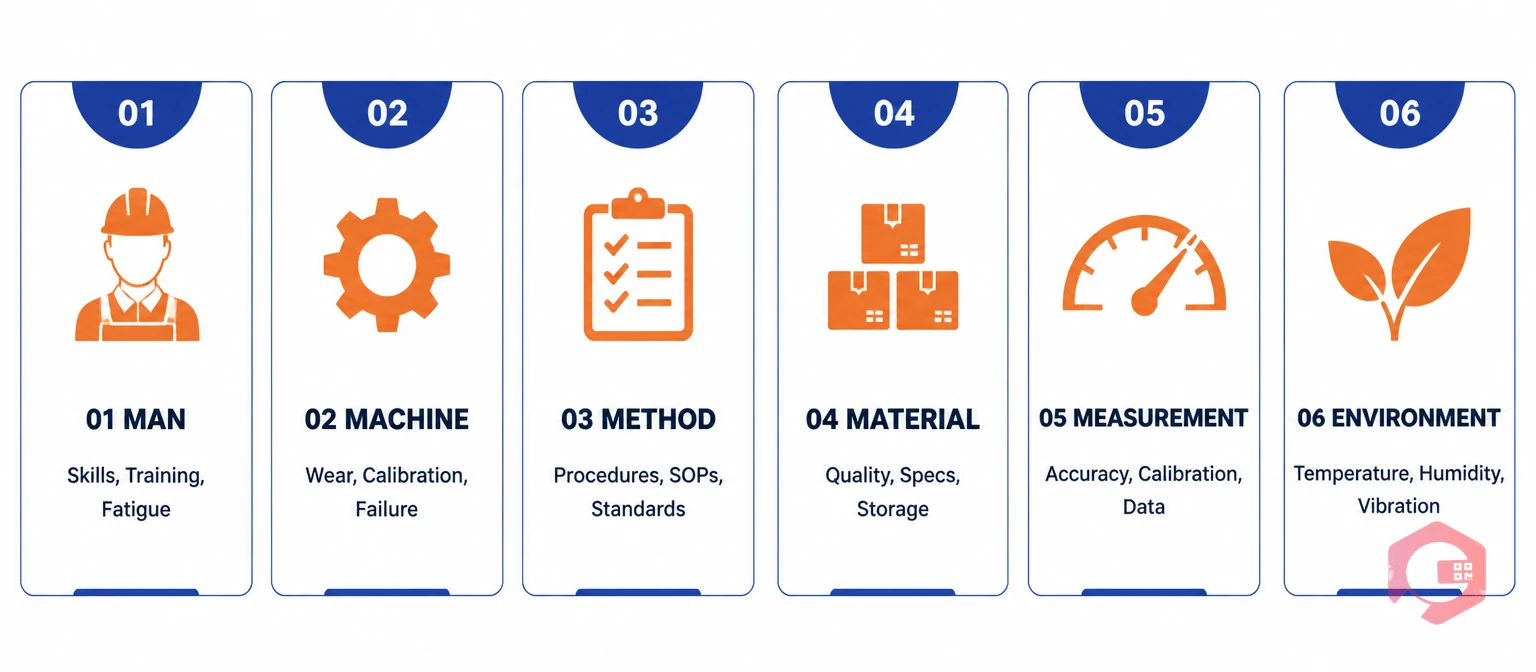
The standard fishbone framework uses six cause categories, often called the 6Ms in manufacturing. Each bone of the diagram corresponds to one category. Every potential cause your team identifies gets placed under the most relevant category.
In a maintenance context, Machine and Method typically hold the most causes for equipment failures, but never assume — all six categories need to be explored before you draw conclusions. A compressor that keeps tripping could trace back to a faulty pressure sensor (Measurement), an operator bypassing the warm-up procedure (Man + Method), or ambient heat in a poorly ventilated room (Mother Nature). Miss any category and you risk fixing the wrong thing.
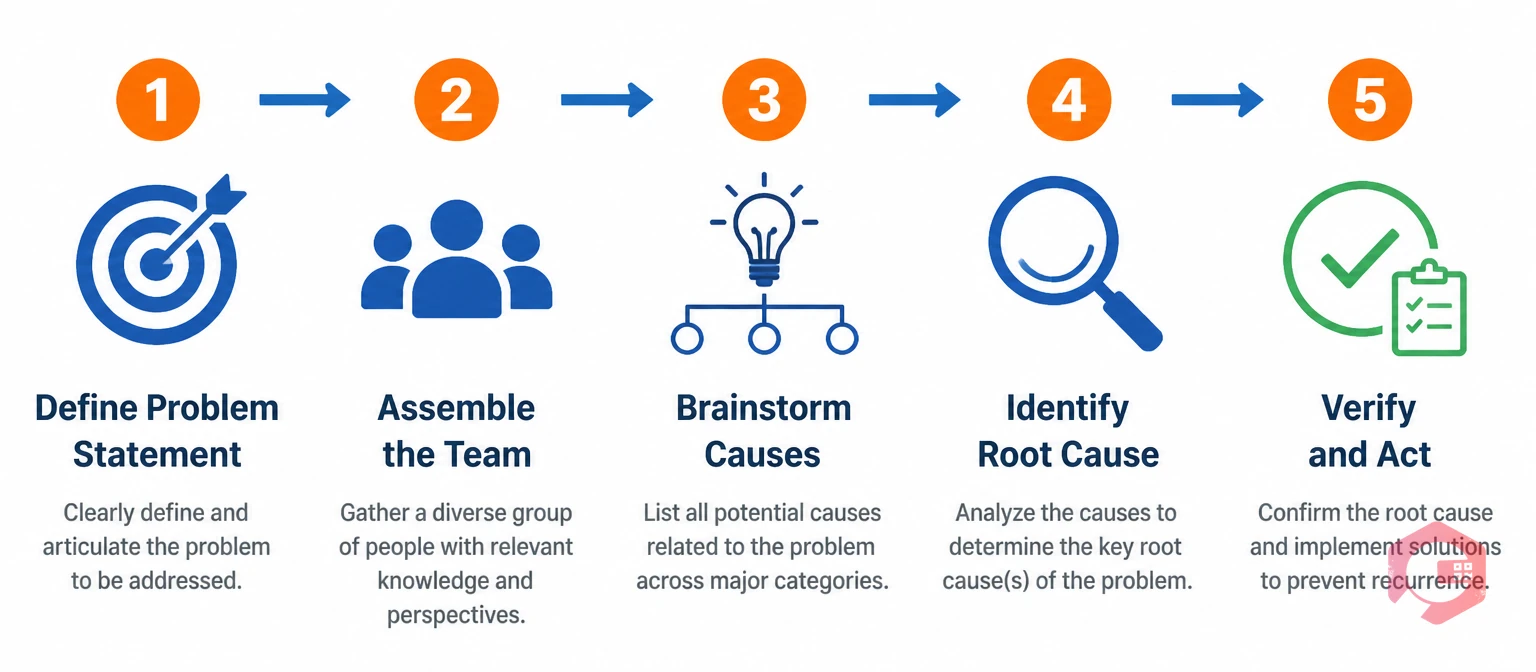
You can run a fishbone session on a whiteboard, in a spreadsheet, or inside a CMMS work order. The medium doesn't matter — the discipline of the process does. Here's the exact sequence to follow:
Write the problem at the right end of the diagram with as much specificity as possible. "Machine stopped" is too vague. "Pump P-204 lost prime three times in the past 30 days during peak load" gives your team something concrete to analyse. A sharp problem statement keeps the session focused and stops the discussion from drifting into unrelated issues.
Invite four to eight people who have direct knowledge of the process or equipment: the maintenance technician who responded to each failure, the operator who ran the equipment, a supervisor, and if relevant, a process engineer. Avoid making it too large — groups bigger than eight tend to lose focus. Everyone should be able to speak freely about what they observed without blame.
Work through each of the six categories one at a time. Ask: "In what ways could [category] have caused or contributed to this problem?" Write every suggested cause onto the diagram without evaluating it yet — the goal is breadth, not filtering. A good session typically surfaces 20 to 40 individual causes across all six bones. Use "Why could this cause the problem?" as your prompt — per the iSixSigma fishbone guide — to push past surface-level answers.
Once the diagram is full, the team votes or uses data to narrow down the most likely root causes — typically two to four items from the full list. For each candidate, ask: "If we fixed this, would the problem stop recurring?" Causes that survive that question are your focus. Cross-reference with failure history, sensor data, inspection records, or maintenance reports — Reliable Plant notes that data verification is the step most teams skip, leading to repeat failures.
A fishbone diagram produces a hypothesis, not a proven answer. Verify your root cause by testing it: change the suspected variable, observe the result, and confirm the failure doesn't recur. Once verified, document the corrective action, update the relevant maintenance checklists and SOPs, and create a preventive task to catch the condition before it becomes a failure next time.
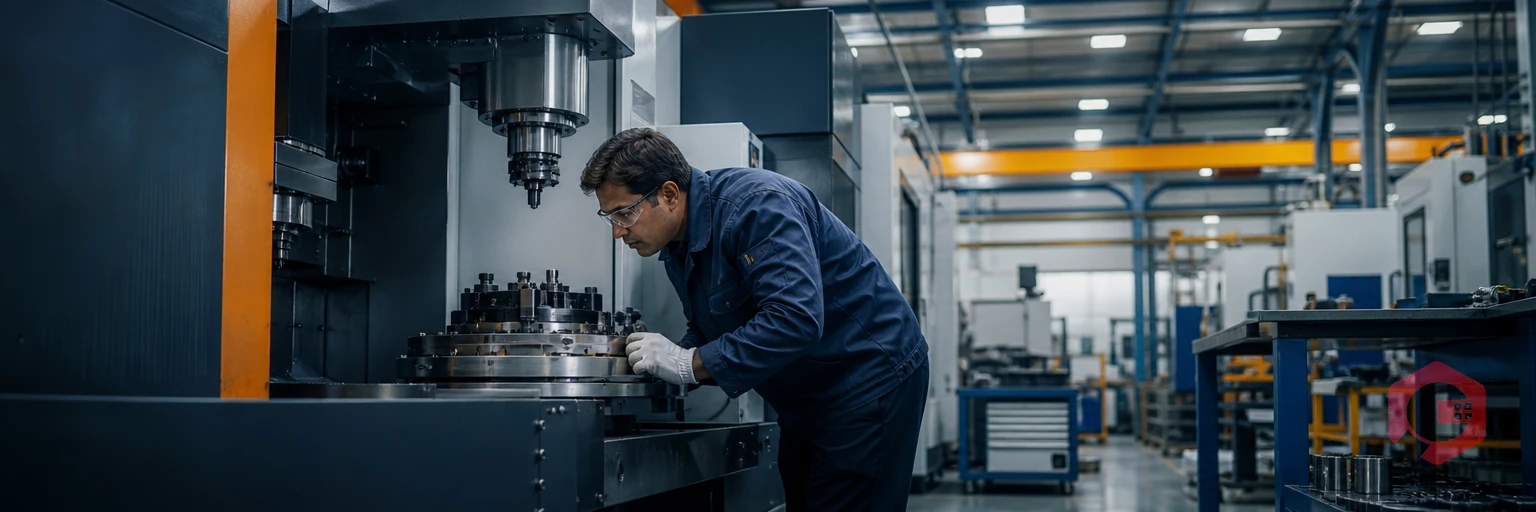
Here's how a maintenance team at a food processing plant used the fishbone tool after a centrifugal pump failed three times in six weeks, each time causing 2–4 hours of unplanned downtime.
Problem statement: "Pump P-07 loses prime during high-viscosity product runs."
The team worked through all six categories and surfaced these causes:
The team identified three root causes: outdated SOP, uncalibrated gauge, and impeller wear. After addressing all three and adding a quarterly pump inspection to the PM schedule, the pump ran without incident for the following four months.
The fishbone diagram is straightforward in concept but easy to misuse. These are the mistakes that undermine results most often:
A fishbone session surfaces root causes — but executing on them requires a system. Without one, corrective actions get lost in email threads, updated SOPs don't reach the floor, and the same failure recurs six months later with a different technician who wasn't in the room.
A CMMS (Computerised Maintenance Management System) closes that gap in several ways. It gives you the failure history needed to build an accurate problem statement — every work order, downtime event, and sensor alert tied to an asset is searchable in seconds. It provides a structured place to record fishbone findings directly on the work order, so the analysis lives alongside the repair record. And it automates follow-on preventive tasks — once your team identifies a root cause, you create a PM task in the CMMS, assign it to a technician, and set the recurrence interval. The task runs automatically from that point on.
Cryotos CMMS includes a built-in BI Dashboard that tracks downtime by asset, department, and failure mode — giving teams the data to prioritise which problems deserve a full fishbone session. For teams running a structured root cause analysis investigation, a digital checklist inside the CMMS ensures every step gets completed consistently — not just when a senior engineer is on shift.
The 6Ms are Man, Machine, Method, Material, Measurement, and Mother Nature (Environment). Each represents a category of potential causes your team explores when building the diagram. Service industries often adapt these to the 8Ps (People, Process, Product, etc.) but the logic is the same.
Use a fishbone when a problem could have multiple independent root causes across different categories. Use the 5 Whys when the cause chain is simpler and more linear. Many teams combine them: fishbone first to map the landscape, 5 Whys to drill down into the most likely branch.
A focused session with the right people and a clear problem statement typically takes 60–90 minutes. Avoid going beyond two hours — cause generation quality drops significantly after that.
Yes. The fishbone tool is used in healthcare, logistics, software, and service industries. The category labels change, but the core method — mapping causes to categories and identifying the root — stays the same.
Recurring equipment failures cost maintenance teams significant time, money, and credibility — and most of them are preventable once the true root cause is identified. The fishbone tool gives your team a proven, repeatable way to find that cause and act on it. If you're ready to build structured RCA into your maintenance workflow and track corrective actions automatically, Cryotos CMMS gives you the platform to do exactly that — from failure logging through to verified fix.


Cryotos AI predicts failures, automates work orders, and simplifies maintenance—before problems slow you down.


