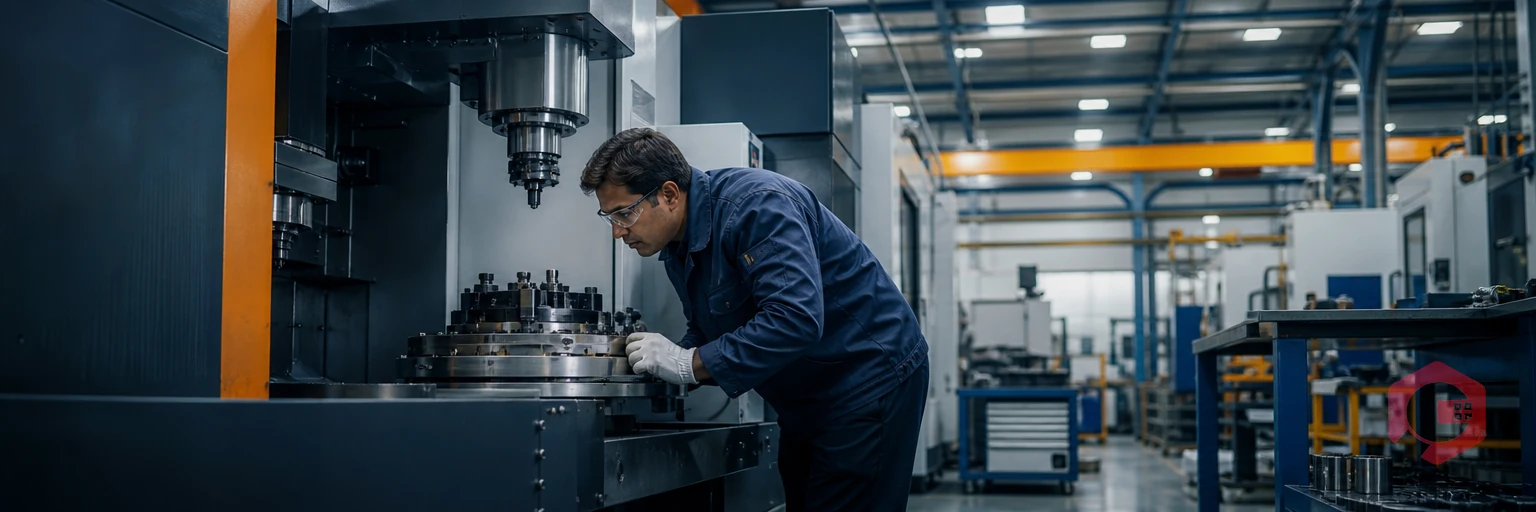
A QM Matrix is a structured quality maintenance tool that maps specific equipment conditions to product quality outcomes — giving maintenance and quality teams a proactive way to prevent defects before they happen. Rather than diagnosing product failures after the fact, the QM Matrix identifies which machine parameters, when they drift out of standard, directly cause which quality defects. For manufacturers running on tight tolerances and high customer expectations, that early-warning capability is the difference between a First Pass Yield above 98% and a costly scrap rate. Used within Total Productive Maintenance (TPM) programs, the QM Matrix is one of the most practical tools for connecting the maintenance team's daily work to the quality outcomes the business depends on.
Key Takeaways
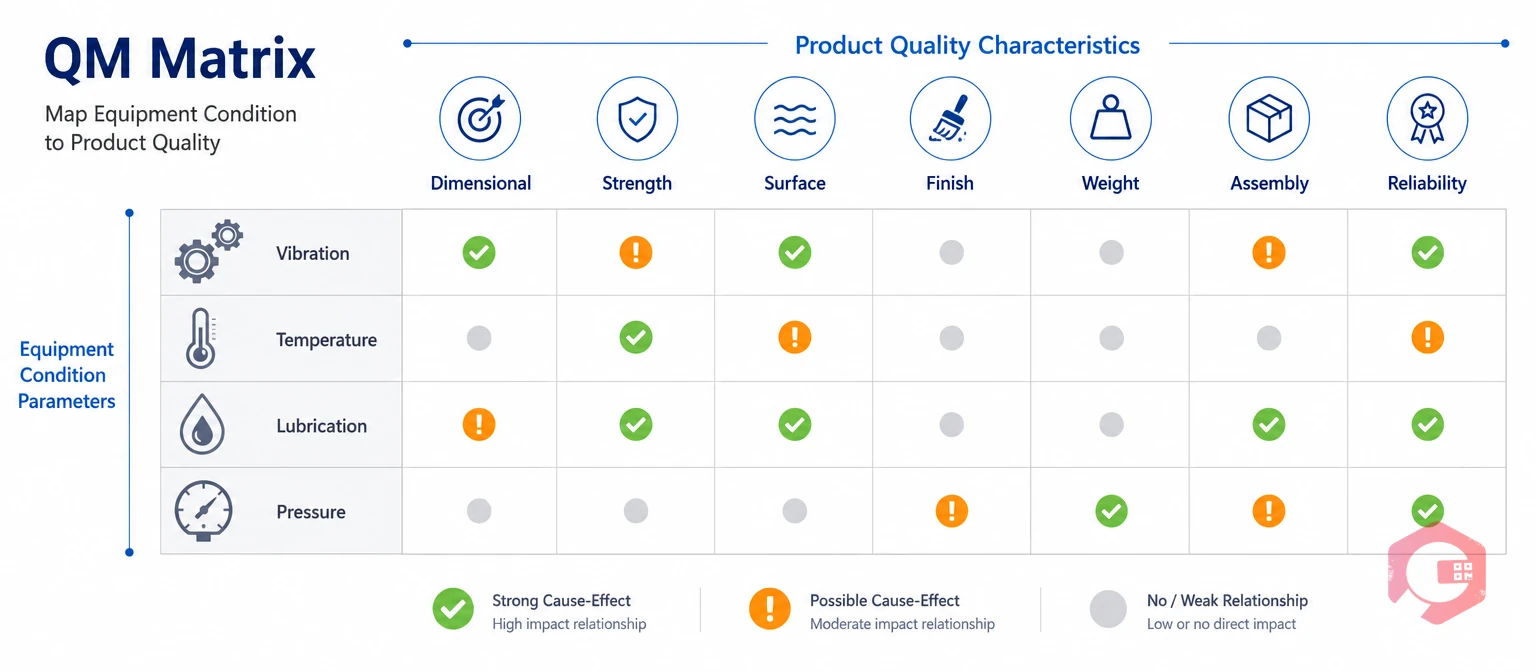
A QM Matrix (Quality Maintenance Matrix) is a structured tool that connects specific equipment conditions to measurable product quality outcomes. When a machine runs out of tolerance — whether the temperature drifts, a clamping force weakens, or a sensor reading shifts — a QM Matrix tells you exactly which product defects that condition produces and what maintenance action should follow.
According to the Society for Maintenance and Reliability Professionals (SMRP), organizations that adopt systematic condition-to-quality mapping reduce their defect rates by 20–35% compared to those relying on reactive maintenance alone. The QM Matrix is the engine behind that improvement.
The QM Matrix comes from the Total Productive Maintenance (TPM) methodology, developed by the Japan Institute of Plant Maintenance (JIPM) in the 1970s. TPM's Quality Maintenance pillar — the eighth of its twelve pillars — tasks maintenance and quality teams with establishing physical standards for equipment that prevent defects at the source.
What makes the QM Matrix unique within this context is the direction of its logic. Most quality systems start with a defect and trace backward to a cause. The QM Matrix inverts that: it starts with equipment conditions and traces forward to potential defects before they occur. That shift from reactive to proactive is what makes the QM Matrix so effective in high-volume, precision manufacturing environments.
Many facilities already run equipment inspection checklists. A QM Matrix goes further. A standard checklist records whether a machine is running — the QM Matrix records what it means for product quality when that machine deviates from its optimal condition.
Every condition in the matrix carries a quality consequence, an inspection frequency, and a corrective action. Checklists capture status; the QM Matrix captures significance. A facility that replaces generic inspection forms with QM Matrix-aligned digital checklists typically closes the gap between "we inspected the machine" and "we prevented a product defect."
The core logic of a QM Matrix is a cause-effect relationship expressed at the equipment level. Each row of the matrix represents a critical equipment parameter — spindle speed, clamp pressure, coolant temperature, conveyor alignment — and each column represents a product quality characteristic — dimensional accuracy, surface finish, tensile strength, weight tolerance.
Where a row and column intersect, the matrix records three things: whether a relationship exists between that condition and that quality characteristic, the severity of the impact if the condition deviates, and the inspection or maintenance action required to keep the condition within standard. The result is a living map of how the shop floor produces — or destroys — product quality.

The 5-Layer QM Matrix Framework is a structured approach for building and sustaining a QM Matrix across any manufacturing environment:
Maintenance teams using Cryotos have reported up to 30% reduction in unplanned downtime and 25% faster repair turnaround after implementing structured condition monitoring with automated work order triggers — the operational backbone of Layers 4 and 5 in this framework.
For facilities moving toward condition monitoring software, IoT sensors can feed Layer 5 data in real time, replacing manual readings with continuous parameter tracking and automatic threshold alerts that integrate directly with the maintenance work order system.
A QM Matrix that gets used — rather than filed away — contains the right data in the right format. The following elements are non-negotiable in any effective matrix:
Facilities that standardize these elements with digital maintenance checklists capture consistent, timestamped condition data that feeds directly back into the matrix for continuous improvement and audit readiness.
If you want to measure how your equipment's condition is currently affecting OEE, try the Cryotos OEE Calculator — it surfaces your availability, performance, and quality losses by asset in under two minutes.

Building a QM Matrix from scratch follows a clear five-step sequence. Most maintenance teams that complete it for even one production line report immediate clarity about which equipment conditions pose the biggest quality risk — and which ones they were previously ignoring.
Start with a production line map and identify every piece of equipment whose condition can affect product quality. Use historical defect data, process FMEAs, and input from operators to shortlist the equipment that deserves matrix coverage. A CNC machining center, a packaging seal unit, or an injection mold temperature controller all qualify. A conveyor between stations typically does not — unless its speed directly affects product formation time or cooling uniformity.
For each piece of critical equipment, list every measurable condition parameter. Then, working with quality engineers and operators who run the line daily, map each parameter to the product quality characteristics it influences. This mapping produces the rows and columns of your matrix. Where a condition can cause a defect, mark the intersection. Where it cannot, leave it blank. A sparse matrix focused on real relationships is far more useful than an overcrowded one that covers every theoretical connection.
For every marked intersection in the matrix, define the acceptable range for that condition parameter. Set inspection frequency based on defect severity: Critical conditions may need daily or continuous monitoring; Minor conditions might only need weekly checks. Specify the measurement tool and method so any technician performs the inspection consistently. Documenting these standards in digital inspection checklists linked to each asset — managed through a preventive maintenance software platform — ensures the standards are accessible at the point of use, not locked in a binder in the maintenance office.
For each condition parameter, define what happens when a reading falls outside the acceptable range. This must be a specific corrective action: "Re-torque spindle bearing to 45 Nm and re-inspect within 2 hours" — not "check with engineering." Assign ownership to a named role and set an escalation path if the action cannot be completed within the defined timeframe. Ambiguous CAPA entries are where most QM Matrix implementations lose their effectiveness — when technicians don't know exactly what to do, nothing happens until the defects appear downstream.
A QM Matrix is not a one-time document. Schedule formal reviews — monthly for high-severity conditions, quarterly for Minor ones — to confirm that standards remain appropriate, corrective actions are being completed on time, and defect rates are trending in the right direction. Update the matrix whenever new equipment is added, process parameters change, or a quality excursion reveals a condition-defect relationship that wasn't previously captured. The QM Matrix earns its value through iteration, not installation.

A Failure Mode and Effects Analysis (FMEA) identifies potential failure modes in a process or design and assesses their risk priority. A QM Matrix, by contrast, focuses specifically on equipment physical conditions and their direct relationship to product quality outcomes during active production. The two tools complement each other — FMEA often informs which conditions belong in the QM Matrix — but they serve different primary purposes and are used by different teams at different points in the production lifecycle.
Many high-performing facilities run both tools: FMEA at product launch to identify the highest-risk conditions, and the QM Matrix operationally to monitor and control those conditions day to day. The ISO 55000 asset management standard supports both approaches by requiring organizations to document condition-to-risk relationships for critical assets and demonstrate ongoing monitoring.
Translating a QM Matrix from a spreadsheet into daily practice requires a maintenance system that can capture condition data, trigger corrective actions, and track results over time. A Computerized Maintenance Management System like Cryotos handles all three — turning the QM Matrix from a static document into an active quality control mechanism that maintenance teams actually use.
Here is how Cryotos maps to each layer of the 5-Layer QM Matrix Framework:
Operations that successfully combine QM Matrix principles with a digital maintenance platform consistently outperform those running the matrix on paper or in disconnected spreadsheets — in First Pass Yield, in maintenance cost per unit, and in audit readiness under ISO quality systems.
The main purpose of a QM Matrix is to create a direct, documented link between the physical condition of production equipment and the quality of the products that equipment produces. Rather than waiting for defects to appear at final inspection, the QM Matrix allows maintenance and quality teams to monitor the equipment conditions that cause those defects and intervene before a quality failure occurs. The result is fewer defects, lower scrap costs, and higher First Pass Yield.
A regular inspection checklist confirms whether equipment is operating or not. A QM Matrix goes further — it defines acceptable ranges for specific equipment condition parameters and maps each parameter to the product quality characteristics it affects. Every entry in a QM Matrix carries a quality consequence and a linked corrective action; a standard checklist typically does not. The QM Matrix turns inspection from a compliance activity into a defect-prevention activity.
The QM Matrix delivers the highest value in industries where equipment condition has a direct, measurable impact on product quality — automotive manufacturing, food and beverage processing, pharmaceutical production, electronics assembly, and precision metal fabrication. Any industry operating under ISO quality standards or TPM-based continuous improvement programs benefits from QM Matrix implementation, particularly where customer specifications require near-zero defect rates.
Critical condition parameters — those linked to the highest severity defects — should be reviewed monthly. The full matrix should be reviewed at minimum quarterly, and always updated when new equipment is introduced, process parameters change, or a quality excursion reveals a condition-defect relationship that wasn't previously captured. A QM Matrix that hasn't been updated in over a year is almost certainly incomplete and may be giving teams false confidence about conditions that have since changed.
Yes — a Computerized Maintenance Management Software (CMMS) is the most practical way to operationalize a QM Matrix at scale. It automates the inspection scheduling defined in the matrix, captures condition readings digitally with timestamps, triggers corrective work orders when conditions fall outside standard, and provides the analytics to measure whether the matrix is working. Without a digital system, most QM Matrix implementations revert to paper-based monitoring within months, losing the consistency and traceability the matrix depends on.
If you're ready to move your QM Matrix beyond a spreadsheet and into daily practice, Schedule a free demo to see how Cryotos automates condition monitoring, inspection workflows, and quality-linked maintenance across your production environment.



Cryotos AI predicts failures, automates work orders, and simplifies maintenance—before problems slow you down.