A flow diagram view in CMMS workflows is a visual map of every step, decision point, and approval gate in a maintenance process — displayed as a connected diagram rather than a flat text list. When your maintenance team can see the entire process at a glance, they make fewer mistakes, skip fewer steps, and escalate the right issues at the right time. According to research published by the British Medical Journal, up to 80% of serious errors in complex operational environments trace back to process ambiguity — not incompetence. A well-built CMMS flow diagram removes that ambiguity entirely.
In this guide, you'll learn exactly what a flow diagram view is, why text-based workflows leave too much room for error, and how to build visual maintenance processes that your technicians will actually follow.
A flow diagram view in a CMMS is a graphical representation of a maintenance workflow. Instead of reading a numbered list of instructions, technicians and managers see boxes connected by arrows — each box is a task or decision, and each arrow shows what comes next. The diagram makes the entire process visible in one screen: who does what, in what order, under what conditions, and who needs to approve it before the next step begins.
This is fundamentally different from how most teams document maintenance processes today. A work order template or a PDF checklist tells you what to do. A flow diagram tells you what to do and what happens based on what you find — which is the part that most maintenance errors happen in.

A text-based workflow list is linear. It assumes every job goes perfectly from step 1 to step 10. In reality, maintenance is full of branch points: the belt is worn — do I replace it now or flag it for the next PM? The pressure is out of spec — do I shut the line down or adjust and monitor? A text list doesn't answer those questions. A flow diagram does, because it builds those decision branches directly into the process.
The practical result: technicians don't have to rely on memory, call a supervisor, or guess. The diagram shows the correct path for every scenario.
A well-built maintenance flow diagram typically includes these elements:
Most maintenance teams run on institutional knowledge. The experienced technician knows the machine, knows the shortcuts, and knows what to do when something looks off. The problem is that knowledge doesn't transfer reliably — especially under pressure, at shift change, or when a newer team member is covering an unfamiliar asset.
Text-based processes make this worse, not better. A PDF procedure or a checklist in a work order tells a technician what to do in ideal conditions. It doesn't help them decide what to do when conditions aren't ideal — which is exactly when errors happen.
Human error is the leading cause of unplanned equipment failures. The Occupational Safety and Health Administration (OSHA) estimates that 65–80% of equipment failures involve human factors — not mechanical failure, not material defect, but a person who missed a step, made a wrong call, or wasn't sure what to do next. The solution isn't to hire better people. It's to design better processes.
Visual workflows are a proven tool in process design. Aviation, healthcare, and nuclear power all use flow diagrams as mandatory process documentation — not because their people are less skilled, but because the consequences of a missed step are too high to leave to memory.
Cognitive load is the mental effort required to track multiple things at once. A technician working on a machine shutdown is simultaneously managing safety procedures, equipment readings, communication with the control room, and documentation requirements. When cognitive load is high, working memory shrinks — and steps get missed.
A flow diagram reduces cognitive load by externalizing the decision-making. The technician doesn't have to hold the entire process in their head. They follow the diagram step by step, and the diagram handles the "what if" questions. Research from Harvard Business Review's analysis of The Checklist Manifesto showed that structured visual process tools cut error rates in complex operational tasks by 36% compared to unguided execution.
The error-reduction effect of flow diagrams isn't accidental. It comes from three specific mechanisms built into any well-designed visual workflow.
When a technician opens a flow diagram view, they see the entire process at once — not just the step they're on. This full-picture view lets them anticipate what's coming next, prepare the right parts or tools before they're needed, and catch sequencing errors before they cause a problem. A maintenance team at a food processing plant that switched from PDF work orders to visual workflow management reported a 40% drop in rework jobs in the first quarter — because technicians were completing steps in the correct order rather than improvising the sequence.
The most error-prone moment in any maintenance task is a decision point: Is this reading within spec? Does this component need immediate replacement or just monitoring? Should I proceed or isolate the machine? A flow diagram with decision branches answers those questions in real time. The technician selects their answer — yes or no, within spec or out of spec — and the diagram routes them to the correct next step automaticall
This is especially critical for Permit to Work procedures and LOTO (Lockout/Tagout) sequences, where a wrong decision doesn't just mean rework — it means a safety incident. A conditional flow diagram makes the safe path the path of least resistance.
Manual approval processes — calls, emails, verbal sign-offs — create gaps. Someone approves work they haven't fully reviewed. A step gets skipped because the supervisor was busy. A safety check is marked complete before it was actually done. Approval gates built into a CMMS flow diagram stop that from happening: the workflow literally cannot advance to the next step until the required sign-off is recorded in the system.
This creates a tamper-proof audit trail — every approval, every decision, every completed step is timestamped and logged. When something does go wrong, your team can trace exactly where the process deviated. That's the kind of accountability that regulators and ISO auditors look for. For more on audit trail functionality, see how Cryotos handles document management within workflows.
Not every maintenance task needs a full flow diagram. But these five process types consistently produce the highest return on visualization effort:
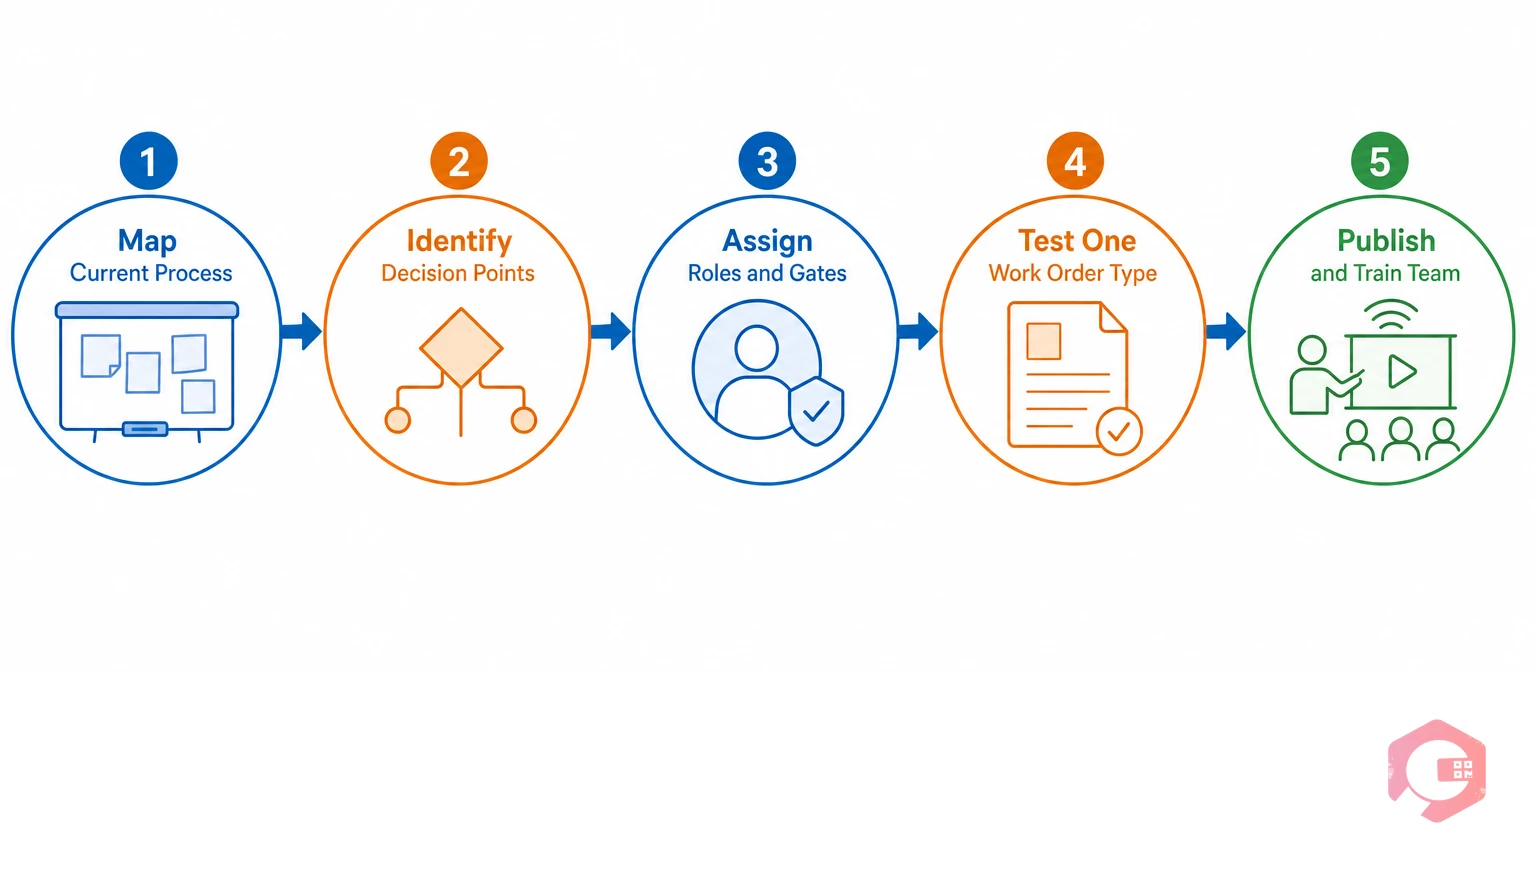
Building a flow diagram sounds technical, but the hardest part is the thinking — not the software. Here's a five-step process that works for any maintenance team, regardless of size or industry.
Before you open any software, sit down with your most experienced technicians and walk through the process as it actually happens — not as it's documented, but as it's done. Write every step on a sticky note or whiteboard. You'll almost always find undocumented decision points, informal approvals, and workarounds that never made it into the official procedure.
Go through your paper map and mark every step where the technician has to make a judgment call. These become your decision diamonds in the flow diagram. For each one, define the two or three possible outcomes and where each outcome leads. If you can't define the correct path for every outcome, that's a process gap — and it means your team has been improvising that decision for years.
Every task block in your flow diagram should have a named role — Maintenance Technician, Shift Supervisor, Safety Officer, Plant Manager. Then decide which steps require formal approval before the next step can begin. Be conservative here: it's better to have one approval gate too many than one too few. You can always remove gates later once you've built trust in the process.
Don't try to build 20 flow diagrams at once. Pick your highest-volume or highest-risk work order type and build that diagram first. Run three to five real jobs through it and collect feedback from the technicians who used it. You'll find gaps, ambiguities, and steps that need reordering — and it's much easier to fix them at this stage than after you've rolled out 20 diagrams across the facility.
A flow diagram your team doesn't know about helps no one. Once your first diagram is tested and validated, run a short training session — not a lecture, but a hands-on walkthrough using the CMMS on a real device. Let technicians navigate the diagram themselves. Address questions in real time. Then push the diagram live and make it the default process for that work order type.
Not all CMMS platforms handle workflow visualization the same way. When evaluating whether your current platform — or a new one — can support the flow diagram approach, look for these five capabilities:
A flow diagram in CMMS software is a visual representation of a maintenance workflow, showing each step, decision point, and approval gate as connected boxes and arrows. It replaces text-based work instructions with a map that guides technicians through the correct path for every scenario, including conditional branches for different findings or outcomes. Most modern CMMS platforms include a drag-and-drop flow diagram builder that lets maintenance managers create and edit these diagrams without coding.
Workflow visualization reduces maintenance errors through three mechanisms: it externalizes decision-making so technicians don't have to rely on memory, it provides conditional branches so every possible scenario has a defined correct path, and it enforces approval gates so no step can be skipped without a recorded sign-off. Research consistently shows that visual process tools cut error rates in complex operational tasks by 30–40% compared to unguided or text-only execution.
Yes — the best CMMS platforms offer no-code visual builders where you drag task blocks and decision diamonds onto a canvas and connect them with arrows. Cryotos's workflow module, for example, supports complex "Either/Or" and "And" conditional logic through a visual interface with optional JSON coding for advanced users who want it. Your maintenance manager should be able to build and publish a complete flow diagram without any developer involvement.
Start with your highest-risk or highest-frequency process — whichever one causes the most rework, incidents, or compliance issues. For most facilities, that's either the emergency breakdown response workflow or the Permit to Work / LOTO procedure. These are the processes where a missed step has the highest consequence, and where a well-built flow diagram delivers the fastest measurable return.
Maintenance errors don't usually happen because your team isn't skilled. They happen because your processes leave too much to interpretation. A flow diagram view in your CMMS closes that gap — it makes the right path the only visible path, so your technicians spend their energy fixing equipment, not figuring out what to do next. Cryotos's workflow management module includes a no-code flow diagram builder with conditional logic, role-based access, approval gates, and a full audit trail — everything you need to turn your maintenance processes from informal habits into repeatable, error-resistant procedures. Talk to the Cryotos team to see how it works in your facility.

Cryotos AI predicts failures, automates work orders, and simplifies maintenance—before problems slow you down.