
Work order cycle time is the total elapsed time from when a maintenance request is raised to when the completed work order is formally closed — including every wait, every handoff, and every gap between steps. Reducing it is one of the highest-leverage improvements available to any maintenance team, because cycle time directly determines how long assets spend in a degraded or failed state, how much emergency overtime is consumed on reactive repairs, and how quickly your technicians can move from one job to the next. According to Reliable Plant benchmarking data, the average maintenance department has 25–35% of total work order time consumed by non-wrench activities — waiting for parts, waiting for approvals, waiting for access — rather than actual repair work. Cutting cycle time means cutting those waits, not pushing technicians to work faster.
Key Takeaways
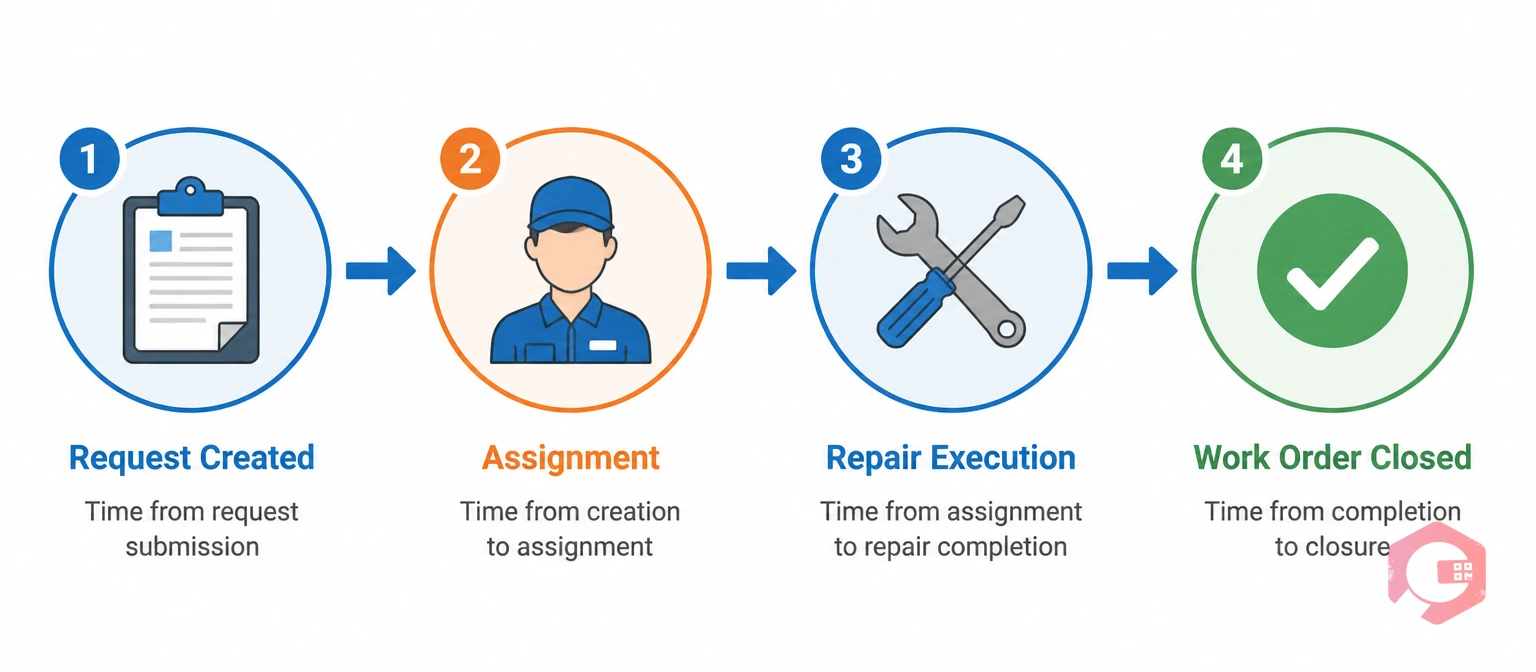
Work order cycle time is the elapsed time between two clearly defined events: the moment a maintenance request is created in your CMMS and the moment the completed work order is closed with a resolution recorded. It encompasses every phase of the work order lifecycle — the time to acknowledge and assign the job, the time to source and stage the required parts, the time to access and complete the repair, and the time to close and document the outcome.
This is distinct from mean time to repair (MTTR), which measures only the active repair execution phase — the time from when a technician starts working on an asset to when the asset is returned to service. MTTR is a subset of cycle time. A work order can have excellent MTTR but terrible cycle time if the technician waited six hours for the right spare part before starting the repair. Managing only MTTR while ignoring the upstream and downstream phases of the work order produces the common situation where technicians are efficient once they start but the overall process is slow.
Cycle time also differs by work order type. Planned preventive maintenance work orders have a known scope, pre-staged parts, and a scheduled access window — their cycle time should be tight and consistent. Emergency corrective work orders have an unknown scope, unplanned parts demand, and immediate access requirements — their cycle time is typically longer and more variable. Tracking cycle time by work order type is essential; averaging planned and corrective work orders together obscures the performance of each.
The business case for reducing cycle time is direct. For corrective work orders, every hour of cycle time is an hour the asset is unavailable. For safety-critical assets, that downtime carries production, safety, and compliance risk. For high-volume routine work orders, a shorter cycle time means more jobs completed per shift and a smaller backlog accumulating over time. A team that can consistently close reactive work orders in under six hours instead of eighteen produces measurably better asset availability even before any improvement in preventive maintenance is considered.

Work order cycle time is not lost in one place — it accumulates across five distinct phases, each with its own causes and its own remedies. Understanding which phase is contributing most of the lost time in your operation is the first step toward reducing it effectively.
The first phase is request to assignment — the time between a fault being reported and a technician being assigned and notified. This phase is often underestimated because it feels administrative rather than operational. In practice, a work request that sits unreviewed in a supervisor's queue for four hours before being assigned is four hours of unnecessary downtime on an asset that could be repaired. The benchmark for high-priority reactive work orders is assignment within 30 minutes of receipt. Delays in this phase almost always trace to manual triage processes, supervisor availability gaps, or the absence of automated priority-based assignment rules.
The second phase is assignment to start — the time between the technician receiving the assignment and physically starting the repair. This phase includes travel to the asset, review of the work order, retrieval of tools, and initial diagnosis. For well-staffed teams with good spatial organisation and digital asset history, this phase should be under one hour for most reactive jobs. Delays typically trace to technicians managing too large a geographic area, asset records that don't include location information, or the absence of digital access to previous repair history before arriving at the job.
The third phase is start to completion — the active repair time, which is what MTTR measures. This is the phase that receives the most management attention and where the least uncontrolled time is typically lost. The most common source of unexpected duration in this phase is parts unavailability discovered after arrival at the asset — a technician who starts a repair, finds they need a specific component that is not in their kit, and must pause to source it.
The fourth phase is completion to documentation — the time between the physical repair being finished and the work order being closed in the system with complete information. This phase is often invisible to management because the asset is running again and the urgency has disappeared. But closure lag — work orders that are completed physically but open in the system for hours or days — is a significant source of data quality problems, inaccurate backlog reporting, and inflated cycle time averages. Teams that close work orders from memory at shift end consistently produce lower data quality and longer apparent cycle times than teams that close from the floor in real time.
The fifth phase is documentation to analysis — the time it takes for closed work order data to be reviewed, patterns to be identified, and improvements to be actioned. This phase does not affect the cycle time of the current work order, but it determines whether the same delays recur on the next one. A maintenance team that never reviews cycle time data by phase cannot identify which phase is their constraint or track whether improvements are working.

Most cycle time problems trace to one of six root causes. Identifying which ones are dominant in your operation before attempting to fix them is essential — the intervention for a parts availability problem is completely different from the intervention for a supervisor triage delay.
The most common root cause is unplanned parts demand. When a technician arrives at a corrective repair without the required spare parts, the work order stops. The technician either waits for parts to be sourced from the storeroom or external vendor, returns to other work (which fractures focus and adds restart overhead), or improvises a temporary fix that will require a follow-up work order. According to SMRP maintenance benchmarks, parts-related delays account for 28% of all lost wrench time in reactive maintenance. The fix is not simply stocking more parts — it is linking asset history and failure modes to the parts required for likely repairs, so that technicians arrive prepared for the most probable job scope.
The second cause is manual triage and assignment. If every work request requires a supervisor to manually review, prioritise, and assign it, the throughput bottleneck is the supervisor's availability. Supervisors who are responding to active breakdowns, in meetings, or on break create a queue of unassigned work that grows throughout the day. Automated assignment rules — routing work requests to the right technician based on asset type, location, skill, and priority — eliminate this bottleneck for the majority of routine and emergency work orders.
The third cause is incomplete work order information. A technician who receives a work order with no asset location, no fault description, no recent repair history, and no parts list is starting from zero at the job. They spend time physically finding the asset, diagnosing without context, and manually looking up what was done previously. Each of these lookups adds minutes. Across a day of work orders, the cumulative time lost to incomplete information is substantial.
The fourth cause is closure lag — work orders completed on the floor but not closed in the system for hours or days. This inflates cycle time metrics, distorts backlog data, and means that the failure codes, parts records, and repair observations from each job are captured from memory rather than in real time. Closure lag is almost entirely a tool problem: when closing a work order requires returning to a desktop terminal rather than tapping a mobile app at the asset, batch closure at shift end becomes the path of least resistance.
The fifth cause is approval bottlenecks. Work orders that require manager sign-off before a technician can start, or that require documented approval for parts expenditure before procurement begins, introduce serial delays that add to cycle time without adding to repair quality. Not all approvals can or should be eliminated — safety-critical or high-cost work warrants appropriate oversight. But an approval workflow that requires three signatures for a $50 bearing replacement is disproportionate to the risk and creates a queue of waiting work orders throughout the day.
The sixth cause is scheduling conflicts. A work order assigned to a technician who is already committed to another job, in a different location, or off shift creates an unplanned delay that appears in cycle time data as unexplained lag. This typically reflects a planning process that assigns work without visibility into current technician workload and location — a problem that a real-time work order management dashboard solves directly.
These eight strategies target the dominant cycle time drivers. Each one addresses a specific phase or root cause, and each can be implemented progressively rather than requiring a wholesale transformation of the maintenance process.
The first strategy is pre-staging parts for predictive and corrective work orders. When a work order is created for a known repair — a recurring failure mode, a condition-based alert, or a scheduled replacement — the required parts should be pulled from inventory and staged before the technician is dispatched. This eliminates the parts wait that accounts for the largest single share of lost cycle time. Cryotos's spare parts inventory software links parts directly to work order templates, so when a work order is generated for a specific asset or failure mode, the required parts list is already attached and the storeroom can begin staging before the technician receives the assignment.
The second strategy is automating work order assignment. Replace manual supervisor triage with rules-based routing that assigns work requests to the right technician automatically based on asset type, location, skill set, and current workload. Reserve supervisor intervention for exceptions — complex multi-technician jobs, unusual failure modes, and situations where the automated assignment is clearly inappropriate. For the 70–80% of work orders that are routine enough to match a clear rule, automated assignment cuts the request-to-assignment phase from hours to minutes.
The third strategy is equipping technicians with complete digital work orders on mobile. A technician who receives a work order on their phone with asset location pinned on a site map, the last five repair records for that asset, a parts list with storeroom bin locations, and the maintenance procedure attached has everything they need to start the job without a single additional lookup. The mobile CMMS makes this information available at the point of work — which compresses the assignment-to-start phase and reduces the diagnosis time at the asset.
The fourth strategy is enforcing same-session work order closure. Require technicians to close work orders from the floor immediately after completing the job, while the details are fresh and before moving to the next assignment. Same-session closure eliminates closure lag entirely, ensures that failure codes and repair observations are captured accurately, and means that parts consumption is recorded against the work order before the technician leaves the area. This single change typically reduces average reported cycle time by 2–4 hours on reactive work orders — not because the repair took less time, but because the administration no longer extends the cycle past shift end.
The fifth strategy is streamlining the approval workflow. Audit every approval step in your work order process and ask whether each one is justified by the risk or cost it controls. Set threshold-based automatic approvals for work orders below a defined cost or risk level — for example, all reactive work orders with estimated parts cost under $500 can start without supervisor sign-off. Reserve approval steps for work orders that genuinely warrant them: high-cost repairs, safety-critical interventions, and work on assets with complex lockout requirements. This reduces the approval bottleneck without removing the oversight that matters.
The sixth strategy is improving storeroom organisation and access. If the fastest path to the required part is a 15-minute search through a poorly organised storeroom, storeroom organisation is a cycle time problem. Parts that are needed frequently should be located closest to the exit, labelled clearly, and organised by asset or work order type rather than by generic category. This structural investment pays back in technician time on every reactive work order that requires a storeroom visit.
The seventh strategy is using your MTTR calculator to set phase-specific targets. Once you have established your baseline cycle time by phase — request to assignment, assignment to start, start to completion, completion to documentation — set a target for each phase separately and track performance against each target weekly. This prevents the common situation where improvement effort focuses on the execution phase (where the team already performs reasonably well) rather than the triage or closure phases (where the real time is being lost). The MTTR calculator provides the execution phase baseline; your CMMS reporting should provide the others.
The eighth strategy is running a monthly cycle time review. Pull all work orders closed in the month and segment them by type (planned PM, reactive corrective, emergency), by priority, and by asset class. Identify the 10% of work orders with the longest cycle times and conduct a root cause review on each one. In most facilities, the longest-cycle work orders cluster around three or four predictable failure modes on a handful of assets — which means the improvement target is specific, not systemic, and the ROI on fixing those specific patterns is high. This review should be a standing item in the monthly maintenance planning meeting, not an ad hoc exercise.
Mean Time to Assign (MTTA) measures the average time from work order creation to first technician assignment. If MTTA rises, the triage process is the bottleneck. Target under 30 minutes for emergency work orders and under four hours for standard corrective work orders during business hours.
Mean Time to Repair (MTTR) measures the average time from repair start to asset return to service. This is the execution phase metric. Rising MTTR typically signals incomplete information at job start, parts availability problems encountered mid-repair, or jobs with systematically underestimated complexity. Use the MTTR trend alongside cycle time to distinguish execution problems from process problems.
Parts-Blocked Work Order Rate measures the percentage of active work orders that are currently waiting for parts as the primary delay. This is the most direct measure of parts availability impact on cycle time. Above 15% is a signal that stocking levels, storeroom organisation, or parts pre-staging need review. Cryotos's work order management software tracks work order status in real time, including the ability to flag and report on parts-blocked work orders as a distinct category.
Work Order Backlog Age measures the average age of open work orders that have not yet been started. A rising backlog age indicates that work is being created faster than it is being completed — which puts pressure on cycle time because older work orders are eventually completed under urgency, increasing their execution cost. The target is to maintain backlog age below two weeks for standard corrective work orders.
Closure Lag measures the time between job physical completion and work order system closure. Even if you don't formally track this, your CMMS will show it as a spike in work orders moving from in-progress to closed at shift end or start-of-next-shift. Any average closure lag above two hours is a signal that same-session closure is not being enforced. Your BI Dashboard in Cryotos surfaces work order status age automatically, making closure lag visible without manual extraction.
Cryotos CMMS is designed to address cycle time at every phase of the work order lifecycle — from intelligent notification on request creation through real-time asset information at the job through automated closure from the field.
At the request-to-assignment phase, Cryotos supports automated routing rules that assign work requests to the right technician based on asset type, location, skill tag, and shift. QR code-based fault reporting allows operators and floor staff to raise work requests directly from the asset — with the asset ID, location, and reported fault pre-populated — reducing the information gathering that adds to manual triage time. High-priority alerts from condition monitoring or IoT sensors generate work orders automatically, bypassing the request queue entirely.
At the assignment-to-start phase, Cryotos pushes the complete work order to the technician's mobile device with asset history, site map location, procedure checklist, and pre-staged parts list. Technicians on the Cryotos mobile CMMS receive work order notifications with a single tap to accept and navigate to the asset — compressing the start lag from the time they receive the assignment. The offline capability ensures that connectivity issues on the plant floor don't add wait time before a technician can see their assigned work.
At the completion-to-documentation phase, technicians close work orders from the asset through the mobile app — selecting the failure code, adding closure notes, recording parts used, and signing off the checklist in a guided workflow that takes under two minutes for a standard reactive job. This same-session closure eliminates closure lag and means that the repair record is complete and accurate before the technician's next assignment begins.
At the analysis phase, the Cryotos asset management platform surfaces average cycle time by work order type, phase, asset, and technician — without any manual report assembly. Maintenance managers can identify which assets have the longest average cycle times, which phases are consuming the most elapsed time, and which technicians or shifts are contributing to cycle time outliers. This visibility converts the monthly cycle time review from a data-gathering exercise into a targeted improvement conversation. The Report Builder module and preventive maintenance software further reduces emergency cycle times over time by replacing reactive events with planned maintenance — the most reliable long-term cycle time reduction strategy available.
According to Plant Engineering's maintenance software ROI research, organisations that implement full mobile work order management see average cycle time reductions of 25–40% in the first six months — with parts availability improvements and automated assignment delivering the largest individual contributions. Reducing work order cycle time is not a single project with a finish line — it is an ongoing discipline that compounds with every improvement made to each phase of the process. Cryotos gives maintenance managers the tools to measure it at every phase, act on it in real time, and sustain the improvement over time. Schedule a free demo to see how Cryotos reduces cycle time across your specific asset types and work order mix.
Work order cycle time is the total elapsed time from when a maintenance request is created to when the completed work order is formally closed in the CMMS. It encompasses every phase of the work order lifecycle — triage and assignment, parts staging, repair execution, and documentation closure — including all waiting time between phases. It is distinct from MTTR, which measures only the active repair execution phase. Cycle time is the more complete measure of maintenance process efficiency because it captures all the non-wrench time that MTTR ignores.
Benchmarks vary significantly by work order type and industry. For emergency corrective work orders on production-critical assets, best-in-class cycle times are under four hours from request creation to work order closure. For standard corrective work orders, a target of under 24 hours represents strong performance. For planned PM work orders with pre-staged parts and scheduled access, cycle time should be within 20% of the planned job duration. The most useful benchmark is your own historical average by work order type, used as the baseline to measure improvement against rather than a fixed external standard.
The most common causes are: parts unavailability discovered after technician arrival at the job, manual supervisor triage creating an assignment queue, incomplete work order information causing technicians to spend time on lookups, closure lag where completed jobs remain open in the system for hours or days, approval bottlenecks that create waiting time before work can start, and scheduling conflicts where work is assigned to technicians who are already committed elsewhere. In most operations, two or three of these causes account for the majority of total cycle time above the execution phase baseline.
A CMMS reduces cycle time at multiple phases simultaneously. Automated assignment routing cuts the request-to-assignment phase. Mobile work order delivery with complete asset history, parts lists, and procedures cuts the assignment-to-start phase. Parts inventory integration with pre-staging capabilities cuts the parts wait within the execution phase. Mobile same-session closure eliminates closure lag. And BI dashboards with phase-level cycle time analytics enable targeted improvement by identifying which phase is the current bottleneck. The aggregate effect of these improvements across all phases is typically a 25–40% reduction in average cycle time within six months of full implementation.
MTTR (Mean Time to Repair) measures the average time from when a technician begins active repair work to when the asset is returned to operational status. Work order cycle time measures the full elapsed time from initial fault reporting to work order closure, including all the administrative, waiting, and documentation time that surrounds the repair. MTTR is a subset of cycle time — a work order can have excellent MTTR but poor cycle time if significant time was lost in the triage, parts, or closure phases. Both metrics should be tracked because they diagnose different parts of the maintenance process.


Cryotos AI predicts failures, automates work orders, and simplifies maintenance—before problems slow you down.


