

A QA matrix is a structured framework that links critical machine process parameters — temperature, pressure, cycle time, and similar variables — to the specific product defects they cause. It replaces old-style tribal knowledge with one shared reference. Quality, production, and engineering teams all read it the same way. Instead of investigating each defect from scratch, teams look up which parameter is out of range and go straight to the fix. This guide covers how to build a QA matrix linking machine parameters to defect types, one step at a time. You'll define critical quality characteristics, list the parameters worth tracking, classify defects consistently, build and validate the matrix, and keep it current as your process changes.
Key Takeaways
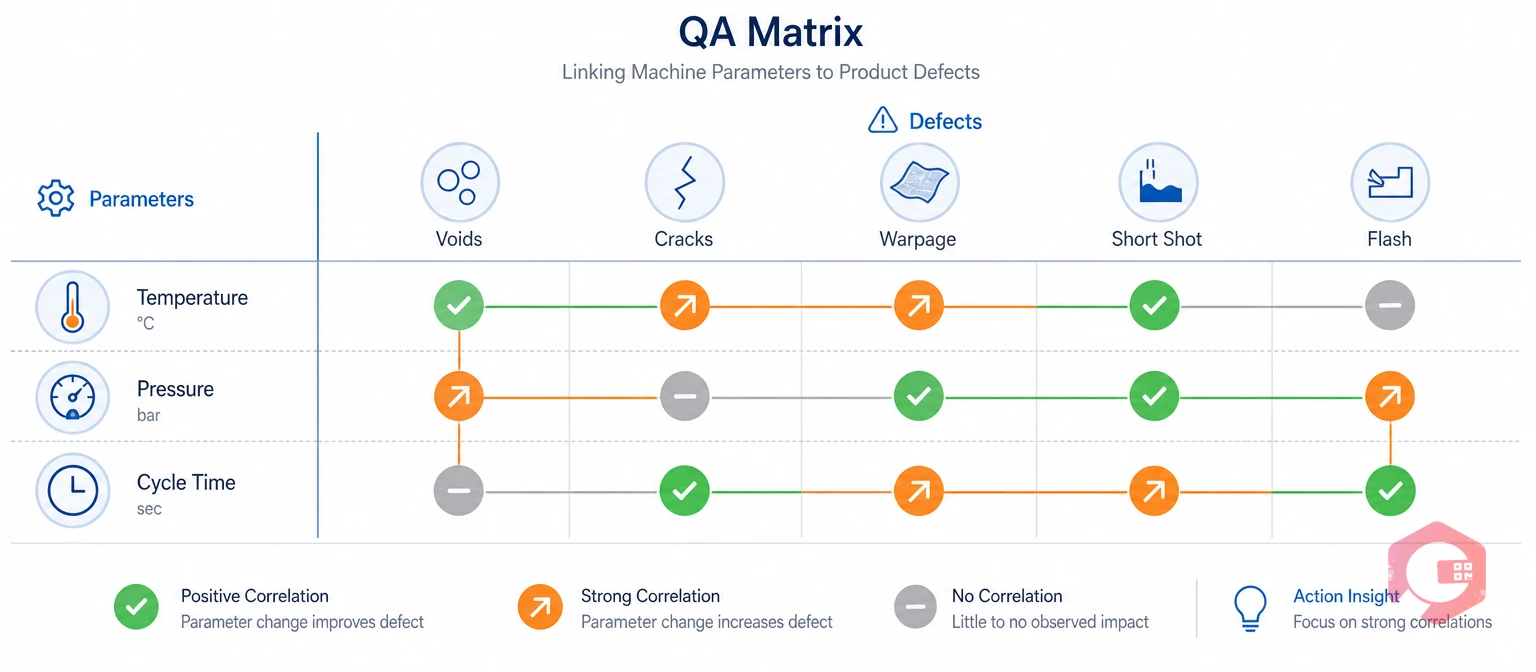
A QA matrix is a documented map of which machine parameters influence which product defects. Each link is rated by correlation strength and paired with a detection method and a corrective action. Quality teams build it to answer one question fast: when a defect shows up, which setting is the likely cause? That question gets harder every year. A single production line can generate thousands of data points. Only a handful of them actually drive the defects customers see.
Most plants already collect this data through SCADA systems, PLC logs, and inspection reports. What's usually missing is the link between the two data sets. A QA matrix closes that gap. It also lines up with the process approach behind ISO 9001, which asks manufacturers to control the variables behind output quality, not just inspect finished parts. Once parameters and defects sit in the same table, engineering, production, and quality all work from one source of truth instead of three separate spreadsheets.
Start by listing the quality traits your customer actually cares about. Common ones are dimensions, surface finish, tensile strength, color, weight, or seal integrity, depending on what you make. These critical-to-quality (CTQ) characteristics are the foundation your defect types will map back to. Getting this list right matters more than any other step.
Most facilities find that fewer than ten CTQs cover most of their scrap and warranty claims. Resist the urge to list every measurable trait on the part print.
Document every process variable that can push a CTQ out of spec. Common ones include temperature, pressure, speed, torque, cycle time, vibration, feed rate, humidity, cooling time, and tool wear. For each one, record the target value, the acceptable range, and how often it gets measured.
Teams already logging these variables through IoT sensors can route them into a reporting dashboard. That way, a drifting parameter gets flagged before it turns into a defect on the line.
Create standardized defect categories before anyone starts filling in the matrix. Dimensional defects, scratches, cracks, burn marks, porosity, misalignment, incomplete filling, contamination, and cosmetic defects cover most discrete manufacturing lines. Standard definitions matter here. Two inspectors who define "minor scratch" differently will rate the same part at different severities.
A defect category is a standardized label for one specific type of nonconformance. It should be defined narrowly enough that two inspectors classify the same part the same way. Vague labels like "cosmetic issue" hide the exact pattern data the matrix is supposed to reveal.
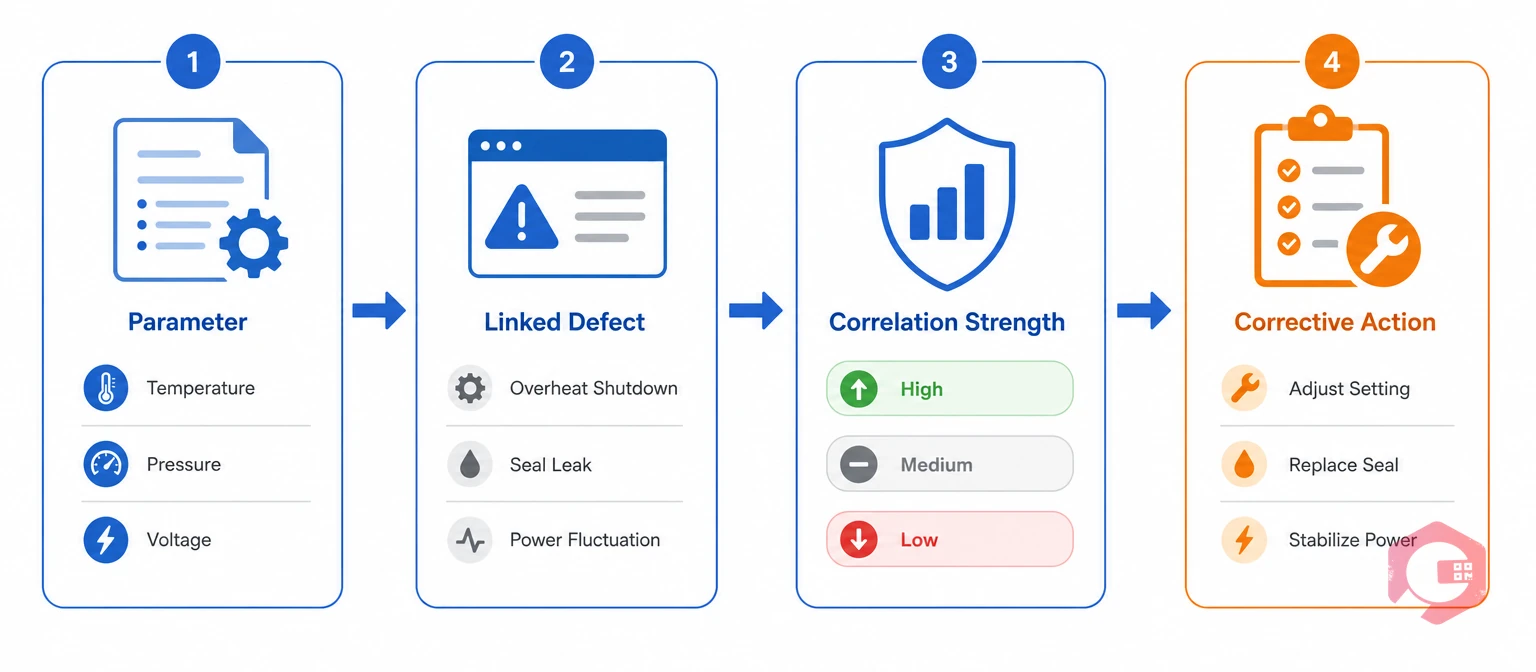
With CTQs, parameters, and defect categories defined, the matrix itself is a table. Rows list machine parameters. Columns list defect types. Each cell records the correlation strength, the acceptable range, the detection method, and the corrective action.
The 4-Column QA Matrix Framework:
| Machine Parameter | Linked Defect Type | Correlation Strength | Recommended Corrective Action |
|---|---|---|---|
| Injection/Barrel Temperature | Burn marks, discoloration | High | Reduce barrel temperature 5-10°C; verify heater band calibration |
| Molding/Forming Pressure | Incomplete filling (short shots) | High | Increase hold pressure; inspect gate and runner size |
| Cycle Time | Warping, dimensional variation | Medium | Extend cooling phase; adjust ejection timing |
| Tool/Die Wear | Surface scratches, flash | Medium | Schedule preventive tool maintenance; inspect cavity surface |
| Ambient Humidity | Porosity, surface bubbling | Medium | Pre-dry material; monitor plant humidity controls |
| Machine Vibration | Misalignment, seal failure | Low | Check mounting bolts; run vibration analysis |
A matrix this size is enough to start. Most facilities expand it to fifteen or twenty rows once they've validated the first batch of relationships against real production data.
Don't publish a matrix built on assumptions. Pull historical production data first, then add statistical process control charts, designed experiments, and Pareto analysis. Use this evidence to confirm or correct every correlation rating before the matrix goes live. A parameter that looks like a strong driver of scratches on paper can turn out to be weak once real data comes in.
When the matrix and the data disagree, run a proper root cause analysis before you change the rating. Teams already running a formal FMEA for new products can pull severity and occurrence scores straight into the matrix. That saves the work of rebuilding them from scratch. Control charts help here too, since they reveal whether a parameter shift is a real signal or just normal process noise.
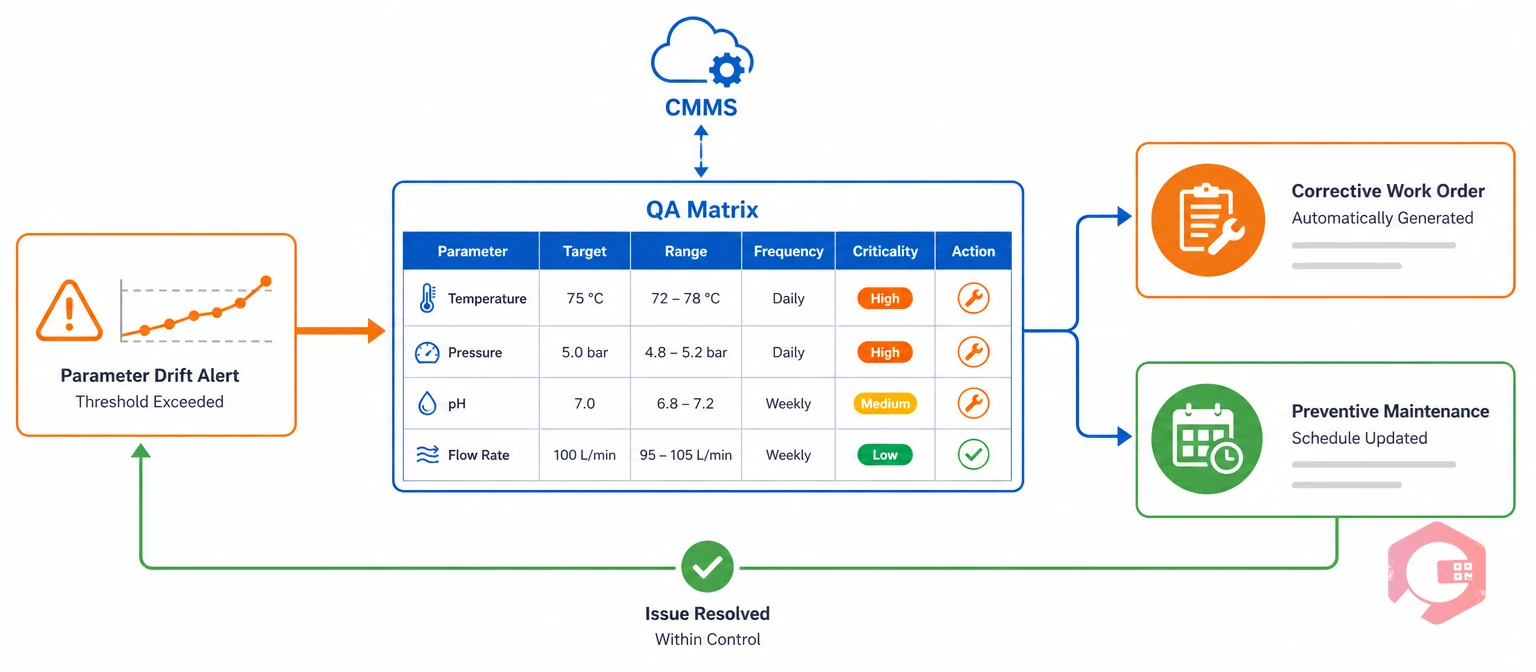
A QA matrix earns its keep once it becomes part of daily work, not a document sitting on a shared drive. Use it during process setup, first article inspection, and change management reviews. Use it for operator training too, so the same parameter-defect logic guides every decision, no matter who is on shift.
Most facilities connect the matrix to two systems. The first is work order management, so a parameter drifting out of range triggers a corrective work order automatically. The second is the preventive maintenance schedule, so tool wear and calibration drift get caught before they surface as defects. A Computerized Maintenance Management System (CMMS) ties both together. It logs parameter history against the work orders it generates.
Maintenance teams using Cryotos have reported up to 30% reduction in unplanned downtime and 25% faster repair turnaround. Those gains trace back to catching parameter drift early, through a system like a QA matrix, instead of after a customer complaint arrives.
Review the matrix on a set schedule, not just when something breaks. Defect trends, machine data, customer complaints, and audit findings all give fresh evidence that a rating needs updating. This is true even after a process change most teams assume is minor.
Build the update review into your regular maintenance audit checklist. That way, the matrix never goes more than a quarter without a fresh look. Tie it back into FMEA, control plans, and SOPs so every update stays linked across documents.
A QA matrix maps process parameters to the defects they cause today, based on validated correlations from production data. An FMEA scores potential failure modes before they happen, ranking them by severity, occurrence, and detection. Many teams build the QA matrix from FMEA outputs and keep both documents linked.
Most facilities start with 10 to 20 parameters tied to their highest-frequency defects rather than mapping every variable on day one. Add parameters once you've validated the first set against real production data, and retire any with a Low correlation rating that never improves.
A quality engineer typically owns the matrix, but updates should draw on input from production supervisors, maintenance technicians, and process engineers who see the equipment daily. Ownership without cross-functional input tends to produce a matrix that looks tidy on paper but misses real-world drift.
Yes, a spreadsheet-based QA matrix works fine for a single line with a handful of parameters. Once you're tracking dozens of parameters across multiple lines, a digital system that links parameter logs to maintenance checklists and work orders keeps the matrix current without constant manual re-entry.
A QA matrix only pays off once it's tied to the work orders, checklists, and maintenance schedules that keep your machines running inside the ranges it defines. Schedule a free demo to see how Cryotos connects parameter tracking, corrective work orders, and preventive maintenance in one system.




Cryotos AI predicts failures, automates work orders, and simplifies maintenance—before problems slow you down.



