

Maintenance spend breaks down into three core cost categories — labor, materials, and contractors — and each one behaves differently, hides waste differently, and responds to different reduction strategies. Most maintenance teams can tell you their total annual maintenance budget. Very few can tell you what percentage goes to overtime labor, what portion of parts spend is emergency-driven, or how much contractor markup they're absorbing on routine jobs. That precision gap is where most maintenance cost control efforts fail. According to the Society for Maintenance and Reliability Professionals (SMRP), world-class facilities spend no more than 15–18% of their total maintenance budget on reactive work. Most facilities spending 40%+ reactively are paying premium labor rates, emergency parts surcharges, and unplanned contractor callouts that a structured cost visibility programme would eliminate.
Key Takeaways

A maintenance budget figure on its own tells you almost nothing useful. $2M in annual maintenance spend could mean a highly efficient, proactive programme protecting $50M of assets — or it could mean a reactive, crisis-driven operation that should cost $800K but is haemorrhaging money in overtime, emergency parts, and unplanned contractor callouts. The total number looks identical. The cost composition is completely different.
Cost visibility means knowing not just what you spent, but on what type of work, on which assets, through which cost category, and whether that spending was planned or reactive. That granularity is what makes maintenance spend manageable rather than simply accountable. Without it, every budget review becomes a negotiation over a number nobody can defend or attack with precision.
The maintenance costs glossary framework — which categorises spend as labor, materials, and contractor — is the standard starting point for building that visibility. Once you can see your spend by category and by work order type, you can find the specific levers that move your numbers rather than applying broad budget cuts that hurt the wrong things.
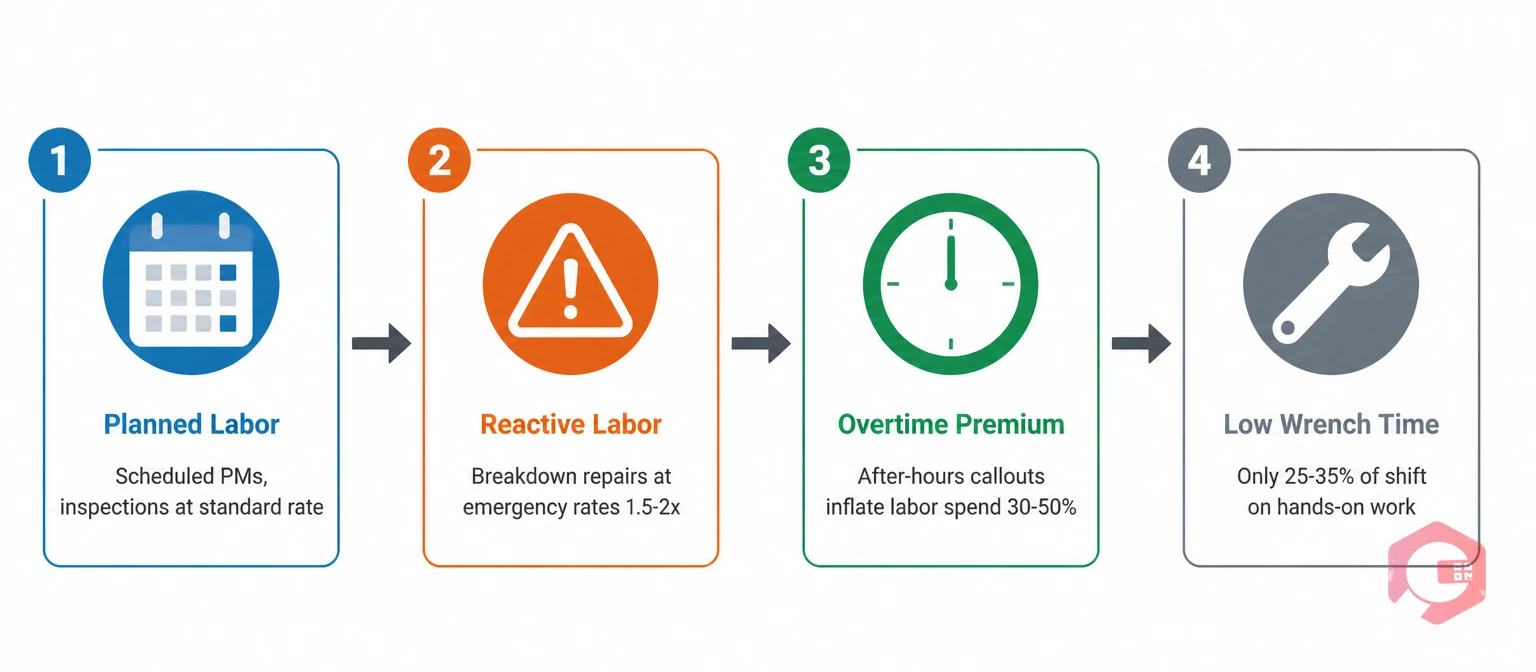
Labor is the dominant cost category for most maintenance operations, accounting for 40–60% of total maintenance spend across industrial and facility environments. But the headline labor cost figure — total technician salaries and wages — is the least useful number in the category. What matters is the composition of that labor spend.
The most important split is planned versus reactive labor. Planned labor is work you scheduled in advance: preventive maintenance tasks, inspections, scheduled overhauls. Reactive labor is work that arrived unannounced: breakdown repairs, emergency callouts, unplanned corrective work. Reactive labor costs substantially more per hour than planned labor, even when the underlying hourly rate is identical, because reactive work carries premium costs that planned work does not.
Overtime is the most visible reactive labor premium. A technician called in outside scheduled hours to repair a failed asset typically costs 1.5–2× their standard rate. Emergency callouts for contractors carry even steeper premiums — many vendor contracts specify 2× or 2.5× rates for after-hours emergency callouts. Facilities with poor PM compliance consistently run reactive labor rates that are 30–50% higher than their planned labor rate — for the same physical work.
The second hidden labor cost is low wrench time: the proportion of a technician's shift actually spent on hands-on maintenance work versus administrative tasks, travel, waiting for parts, or searching for asset information. Industry benchmarks from Reliabilityweb put average wrench time at 25–35% for facilities without structured work order systems. That means for every hour paid to a maintenance technician, as little as 15–20 minutes is spent on productive maintenance. The rest is absorbed by inefficiencies that a structured work order management system directly addresses by giving technicians job information, asset history, and parts availability on their phone at the point of work.
Labor cost benchmarks to target: planned labor should represent at least 70% of total labor spend. Overtime as a percentage of total labor should be below 10%. Wrench time should be above 45%.
Material costs — spare parts, consumables, lubricants, and MRO supplies — typically represent 30–40% of total maintenance spend. Like labor, the aggregate number conceals a layered cost structure that only becomes visible when you separate planned from reactive purchasing.
Emergency parts procurement is the single highest-cost element within materials. When a critical asset fails unexpectedly and a replacement part isn't on the shelf, procurement happens under time pressure: expedited freight at 3–10× standard shipping cost, after-hours supplier surcharges, and in some cases premium pricing from the only vendor who can deliver same-day. A bearing that costs $85 on a standard purchase order can cost $300–400 when sourced as an emergency across a weekend. According to Plant Engineering, facilities running reactive-heavy operations routinely see 20–35% of their total parts spend consumed by emergency procurement premiums.
Over-stocking is the opposite failure mode. Without consumption data linked to actual asset failure patterns, maintenance planners default to conservative stock levels — holding large quantities of parts that rarely fail while frequently running out of the consumables that predictably exhaust themselves on PM schedules. The result is working capital tied up in slow-moving inventory and recurring stockouts on the items that actually matter. The mean maintenance cost calculator helps surface your current materials cost per work order — separating planned PM parts costs from reactive repair parts costs — so you can see exactly where purchasing premiums are accumulating.
A useful materials cost benchmark: emergency parts procurement should represent no more than 10–15% of total parts spend. Inventory turnover rate for MRO stock should be above 2× per year. Parts stockout rate — the percentage of PM tasks delayed due to missing parts — should be below 5%.
Proper inventory management within a CMMS connects parts consumption directly to work order history. When every corrective and PM work order records the exact parts consumed, the system builds a consumption-based replenishment model that replaces intuition-driven buffer stocking with data-driven minimum thresholds and automatic reorder triggers.
Contractor costs are typically 20–30% of total maintenance spend for facilities that use external service providers for specialist work, high-volume seasonal tasks, or coverage during peak demand periods. They are also the cost category with the highest variance and the least visibility in most organisations.
The core problem is scope management. When a contractor arrives on site without a documented scope of work tied to a specific work order, scope creep is almost inevitable. A routine electrical inspection becomes a panel upgrade recommendation. An HVAC service becomes a refrigerant recharge, duct inspection, and controller replacement. Without a documented baseline of what the job should cost and what scope it should cover, every invoice is a negotiation rather than a verification.
The second contractor cost driver is reactive callouts. Most contractor agreements include standard rates for planned, scheduled work and premium rates for emergency callouts. Facilities with poor PM programmes call contractors reactively — paying emergency rates for work that, with adequate preventive scheduling, would have been planned at standard rates. A compressor inspection scheduled quarterly at $800 per visit becomes a $3,000 emergency callout when the compressor fails because the inspection was deferred three times.
Hidden contractor cost layers include markup on materials (many contractors mark up parts by 20–40% above their procurement cost), mobilisation fees buried in small print, and minimum charge clauses that mean a 30-minute job costs two hours of labor. Without a CMMS that records every contractor visit, its scope, its actual cost, and its comparison to the original work order estimate, these layers accumulate invisibly across the year.
Contractor cost control starts with requiring every contractor visit to open against a work order with a defined scope, estimated cost, and assigned asset. That single discipline — linking every contractor invoice to a work order — creates the audit trail that makes overcharges challengeable and scope creep visible.
| Cost Factor | In-House Labor | External Contractor | Key Consideration |
|---|---|---|---|
| Hourly rate (planned work) | $35–$65 fully loaded (salary + benefits + overhead) | $80–$150 per billable hour | In-house is cheaper per hour for high-volume, repeatable tasks |
| Hourly rate (emergency) | 1.5–2× standard rate (overtime) | 2–2.5× standard rate (emergency callout) | Both cost more reactive; contractors cost proportionally more |
| Materials cost | At procurement cost (your purchase price) | At procurement cost + 20–40% markup | Contractor materials markups are a significant hidden cost |
| Mobilisation / minimum charge | None — technician is already on site | $150–$500 minimum charge per visit | Batching contractor tasks into single visits reduces this significantly |
| Specialist knowledge | Limited to trained in-house skills | High — justifies premium for complex or infrequent tasks | Contractors earn their premium on tasks requiring rare expertise |
| Scope control | High — directly managed and verifiable | Low without documented work order scope | Scope creep is the largest uncontrolled contractor cost driver |
| Knowledge retention | Asset history stays in organisation | Institutional knowledge leaves with the contractor | Documenting contractor work in CMMS preserves the asset history |
The in-house versus contractor decision is rarely an either/or choice — most facilities use both. The strategic question is which tasks should be performed by which resource type, and whether that allocation is driven by data or by habit. A CMMS that tracks actual cost-per-task by resource type gives you the data to make that decision objectively rather than by intuition.
Cost per work order is the most actionable unit metric in maintenance cost management. It converts your aggregate spend into a per-task rate that reveals efficiency trends that are invisible at the budget level, and it enables meaningful comparison across asset types, work order types, and time periods.
The formula is: Total maintenance spend (labor + materials + contractor) ÷ Total work orders completed = Cost per work order.
But the aggregate cost per work order is only the starting point. The diagnostic value comes from segmenting it. Cost per reactive work order versus cost per planned PM work order typically shows a 3–5× difference in well-run operations and a 7–10× difference in poorly managed ones. That ratio tells you immediately how much your reactive rate is costing you above your planned rate — and by implication, what you'd save by converting reactive events into planned PMs.
Cost per work order by asset class tells you which assets are consuming disproportionate maintenance spend. An asset representing 5% of your fleet but 25% of your corrective work order costs is a candidate for replacement, redesign, or a targeted reliability improvement programme. Without cost allocation at the work order level, that asset's cost burden is invisible in the aggregate budget.
The project and budget management module in a CMMS enables cost tracking at the work order level — logging labor hours, parts consumed, and contractor spend against each specific job. The resulting data feeds directly into cost per work order reports that make these patterns visible in real time rather than in quarterly budget reviews.

The data captured by a CMMS across labor, material, and contractor cost categories does more than measure spend — it creates the visibility needed to systematically reduce it. Each cost category responds to specific CMMS-driven interventions.
For labor costs, the primary reduction levers are PM compliance rate and wrench time. A CMMS tracks PM schedule compliance in real time — showing which tasks were completed on time, which were deferred, and which were missed entirely. Improving PM compliance directly reduces reactive labor by preventing the breakdown events that generate emergency overtime. The report builder can surface PM compliance by asset, by technician, and by work order type — giving supervisors the data to intervene before missed PMs become reactive events rather than after.
For material costs, the reduction leverage comes from consumption-based inventory management. When every work order records parts consumed with specific quantities and part numbers, the CMMS accumulates the failure history needed to set minimum stock thresholds that reflect actual demand rather than conservative guesswork. This eliminates both the over-stocking that ties up working capital and the stockout events that force emergency procurement. Automatic reorder triggers linked to minimum thresholds remove the human judgment that creates stockout gaps.
For contractor costs, the CMMS enables three specific controls. First, every contractor visit opens against a work order with a defined scope and estimated cost — making scope creep immediately visible when the invoice arrives. Second, contractor work order history builds a cost database that makes it possible to challenge invoices that deviate from historical rates for the same task type. Third, batching: a CMMS that tracks all pending contractor-appropriate tasks enables schedulers to consolidate multiple small jobs into a single contractor visit, eliminating repeated minimum charges and mobilisation fees.
The BI dashboard across all three cost categories — updated in real time from closed work orders — gives maintenance managers a live view of where spend is accumulating and which cost drivers are growing or shrinking. That visibility is what converts maintenance cost management from a retrospective budget exercise into a live operational control.
SMRP benchmarks suggest that for typical industrial operations, labor accounts for 40–60% of total maintenance spend, materials for 25–40%, and contractors for 10–25%. The specific split varies significantly by industry — facilities with large amounts of specialist equipment (power generation, oil and gas) tend to have higher contractor proportions, while labour-intensive facility management environments lean more heavily toward in-house labor. The more important benchmarks are the ratios within each category: planned vs. reactive labor, emergency vs. standard parts purchasing, and planned vs. reactive contractor callouts.
The fully loaded labor rate includes base salary, employer-paid benefits (healthcare, pension, social insurance), payroll taxes, training and certification costs, tools and PPE, and a share of management overhead. A technician earning $45,000 per year in base salary typically carries a fully loaded rate of $70,000–$80,000 per year when all costs are included — translating to approximately $35–$40 per productive hour assuming 2,000 annual working hours and 45% wrench time. Always use the fully loaded rate when comparing in-house versus contractor costs to avoid understating the true cost of in-house resources.
Emergency procurement — parts ordered outside the normal purchasing cycle with expedited freight or after-hours supplier fees — should represent no more than 10–15% of total parts spend in a well-run maintenance operation. Facilities exceeding 25% emergency procurement are carrying a significant reactive premium that structured PM programmes and inventory minimum thresholds can eliminate. Tracking emergency procurement as a percentage of total parts spend is one of the clearest leading indicators of PM programme effectiveness — as PM compliance improves, emergency procurement percentage typically falls proportionally.
Every contractor engagement should be recorded against a specific work order with the asset, the defined scope of work, the agreed rate basis (fixed fee, hourly, or day rate), and the estimated cost before work begins. When the invoice arrives, it is compared to the work order estimate — with any variance requiring documented justification. Contractor invoices approved without a linked work order are the primary source of contractor cost overruns because they have no baseline to compare against. Over time, the work order cost history builds a contractor performance database that makes future estimates more precise and invoice challenges more credible.
Facilities implementing a CMMS from a spreadsheet-based baseline typically see cost-per-work-order reductions of 15–30% within the first 18 months, driven primarily by reductions in emergency labor (through better PM compliance) and materials premiums (through inventory management improvements). The improvement rate depends heavily on the starting reactive rate — facilities starting from a 60%+ reactive ratio see faster and larger improvements than those already operating at 40% reactive. The metric to track alongside cost per work order is the planned-to-reactive ratio, since the reactive rate is the primary driver of cost premiums across all three categories.
Breaking down maintenance spend into labor, material, and contractor categories is the first step toward genuine cost control — because each category has different waste patterns, different benchmarks, and different reduction levers. Tracking total spend without category visibility is like trying to reduce a household budget by looking only at the bank balance rather than the itemised statement. Cryotos gives your maintenance team the CMMS infrastructure to track cost at the work order level across all three categories — with live dashboards, cost-per-asset reports, contractor scope tracking, and inventory consumption analytics that convert your maintenance budget from a number you report into a number you control. Schedule a free demo to see how Cryotos surfaces the cost breakdown your management team is asking for.




Cryotos AI predicts failures, automates work orders, and simplifies maintenance—before problems slow you down.



