

Maintenance reports are only as useful as the decisions they drive — and most operations leaders are drowning in data that produces zero decisions. The average CMMS generates dozens of reports on demand, yet when a critical machine breaks down unexpectedly, the root cause is still hard to pin down. The gap is not data volume. It is knowing which five reports to rely on and what each one is actually telling you.
Operations leaders who consistently achieve world-class reliability work with five core maintenance reports: one that surfaces bad-actor assets, one that tracks whether work is planned or reactive, one that monitors real-time equipment health, one that connects maintenance spend to asset value, and one that filters PM compliance through an equipment criticality lens. Each report drives a specific category of decision — and together they convert raw CMMS data into a maintenance operation that gets proactive rather than staying reactive.
Key Takeaways
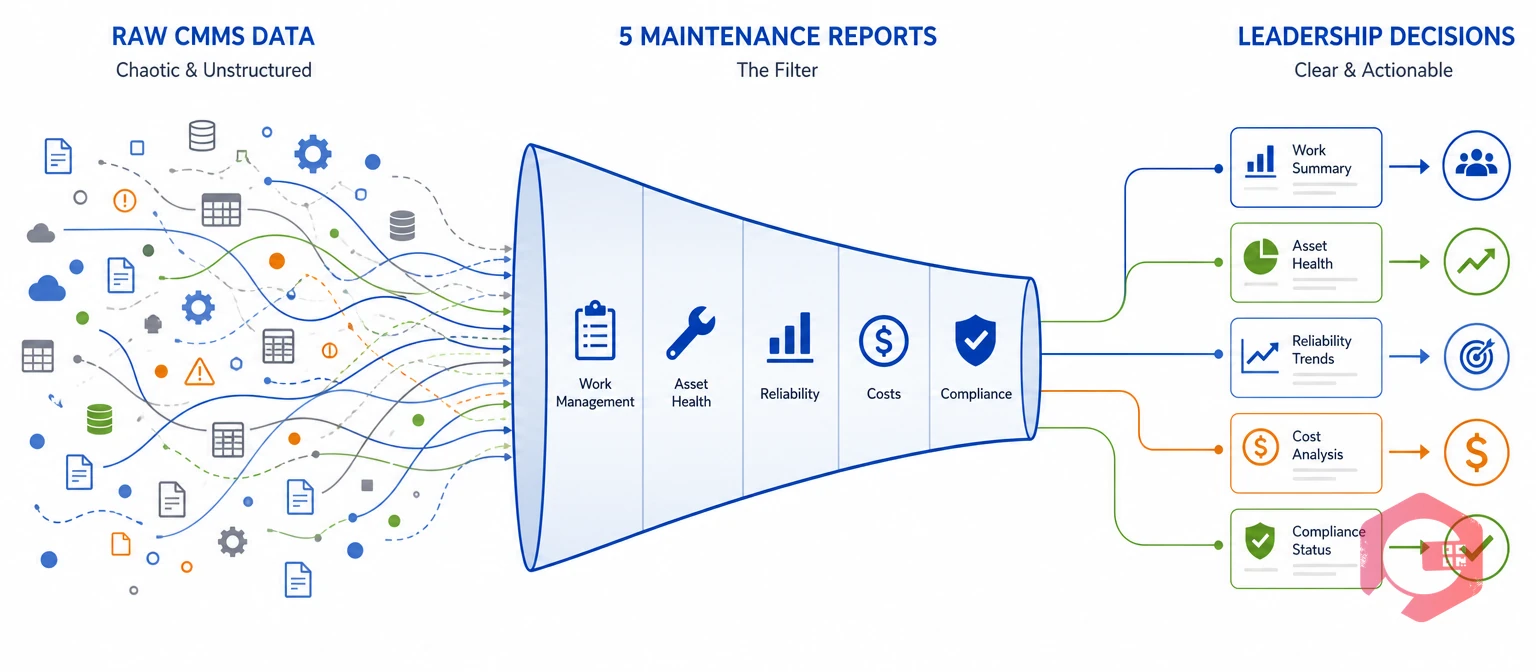
Operations leaders typically receive more reporting data than they can act on. Automated emails arrive daily, spreadsheets circulate weekly, and the CMMS has a reporting menu with 50 options. Yet in most facilities, maintenance still operates reactively — because the reports on hand describe what happened, not what to do about it.
The problem is structural. Most reporting systems are built to log activity for compliance purposes, not to surface decisions for leadership. A report showing 1,247 work orders completed this month tells you your team is busy. It does not tell you whether that workload is proactive or reactive, whether the same three assets are driving most of the emergency calls, or whether your maintenance budget is being absorbed by one aging machine that should have been replaced last year.
Effective maintenance reporting acts as a filter, not a firehose. Research from the Society for Maintenance and Reliability Professionals (SMRP) consistently shows that maintenance teams tracking more than seven to ten KPIs without a clear decision hierarchy experience decision paralysis — more time spent interpreting data than acting on it. The five reports below are the ones that operations leaders in high-performing facilities actually use, because each one drives a specific category of decision at the leadership level.
The Downtime and Failure Behavior Report identifies your "bad actor" assets — the machines consuming a disproportionate share of maintenance hours and production capacity — so you can eliminate recurring breakdowns at their source rather than treating the same failure repeatedly.
Overall availability metrics hide more than they reveal. A facility reporting 92% availability on paper can still have two or three assets generating the majority of production losses, hidden behind site-wide averages. This report ranks assets by total downtime hours and failure frequency to expose the exact bottleneck machines. Once those assets surface, the report triggers the right response: structured Root Cause Analysis (RCA) rather than another reactive repair cycle.
The leadership shift this report enables is from measuring repair speed to interrogating failure causes. When an asset shows a repeat failure rate of four or more breakdowns on the same failure code within 60 days, the data is telling you the repair approach is wrong — not that the technician is slow. That diagnostic shift is worth more than any incremental improvement in response time.
According to Plant Engineering's annual maintenance benchmarking data, facilities that use structured failure frequency reports to prioritize RCA consistently reduce their top bad-actor asset downtime by 30–45% within two maintenance cycles — without adding headcount or increasing maintenance spend.
The Work Management Report measures your planned-to-reactive work ratio — the single most reliable indicator of whether your maintenance operation is under control or permanently caught in an emergency-response cycle.
When technicians spend most of their time responding to unplanned breakdowns, costs rise across every dimension: emergency parts procurement at premium prices, overtime labor, accelerated asset wear from deferred preventive maintenance, and a backlog of scheduled tasks that never gets cleared. This report tracks labor allocation, backlog health, and schedule adherence so operations leaders can see exactly how much of the team's capacity is going toward proactive work versus firefighting.
This report drives two types of decisions: shift and labor distribution when bottlenecks appear, and backlog intervention before accumulated deferred work forces a reactive crisis. If the backlog ratio climbs above 1.3 for three consecutive weeks, operations leadership has a data-backed case to either temporarily add labor, defer lower-criticality planned work, or escalate resource constraints to management before the situation becomes an emergency-driven cost spike.
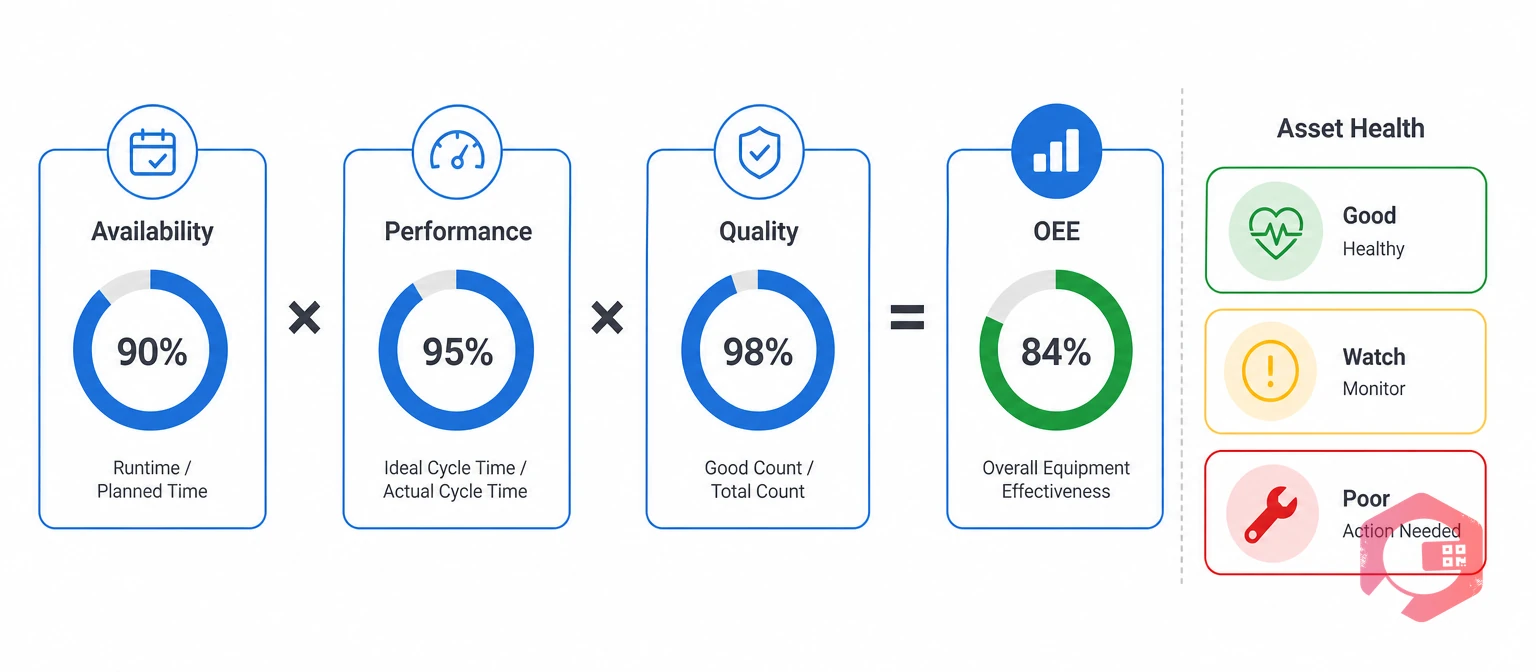
The Asset Health Report gives operations leaders continuous visibility into machine condition and plant-wide uptime — converting scattered sensor readings and historical maintenance data into a single view of which assets are healthy, which are at risk, and which are already in performance decline.
Equipment availability directly dictates total plant output. A single percentage point reduction in availability on a critical production line can translate to tens of thousands in lost production output per shift. This report synthesizes condition monitoring data, operational status, and overall equipment efficiency into color-coded visual indicators — typically Green/Yellow/Red thresholds — so leadership can respond to early warning signals before they become unplanned failures.
The leadership value of this report lies in exposing what the International Society of Automation calls the "six big losses" in manufacturing — unplanned downtime, planned downtime, speed losses, minor stoppages, quality defects, and startup losses. Each of these translates directly into OEE points lost. Identifying which loss category is the largest allows operations leaders to direct continuous improvement effort where it returns the highest production value rather than spreading resources across every problem at once.
The Maintenance Financials Report connects labor hours, contractor fees, and spare parts costs directly to individual assets — transforming maintenance from a black-box budget line into a transparent, data-backed cost centre that leadership can manage with precision.
Without asset-level financial tracking, maintenance is frequently characterized in budget conversations as either essential overhead or avoidable spend, depending on who is arguing. Neither framing is accurate, and neither is actionable. This report replaces subjective claims with objective data — cost by asset, cost relative to replacement value, and inventory cash exposure — giving operations leaders and finance directors a shared factual basis for capital decisions.
This is the report that converts the maintenance manager from a cost requester into a cost explainer. When an asset's MC/RAV has run at 8.7% for three consecutive years — meaning the facility has spent almost nine percent of the machine's replacement value annually just to keep it running — the repair-versus-replace conversation changes from a budget negotiation into a straightforward financial calculation. The data makes the case without requiring anyone to advocate for it.
The PM Compliance and Criticality Risk Report filters preventive maintenance completion rates by equipment criticality class — because a 90% overall compliance score is actively misleading when the 10% of missed tasks belong to your highest-consequence production assets.
Standard PM compliance scores treat every task as equal weight. A lubrication check on a non-critical utility pump and a safety valve test on a Class A bottleneck machine both count as one task in an aggregate compliance figure. This structural problem means a facility can report strong overall PM compliance while systematically neglecting the assets where failure has the most severe operational, safety, or financial consequence.
Implementing a structured Reliability Centered Maintenance (RCM) framework — which assigns PM tasks, frequencies, and criticality classifications based on failure consequence rather than arbitrary schedules — is the methodology that makes this report actionable at scale. Research documented in the SMRP best practices library shows that RCM-based maintenance programs can reduce corrective downtime by 55.8%, lower total maintenance costs by 52.2%, and raise operational availability from 57.1% to 90.7%. Those outcomes are not achievable from compliance reports alone — but they are unreachable without them, because the report is what ensures the framework is being followed on the assets where it matters most.
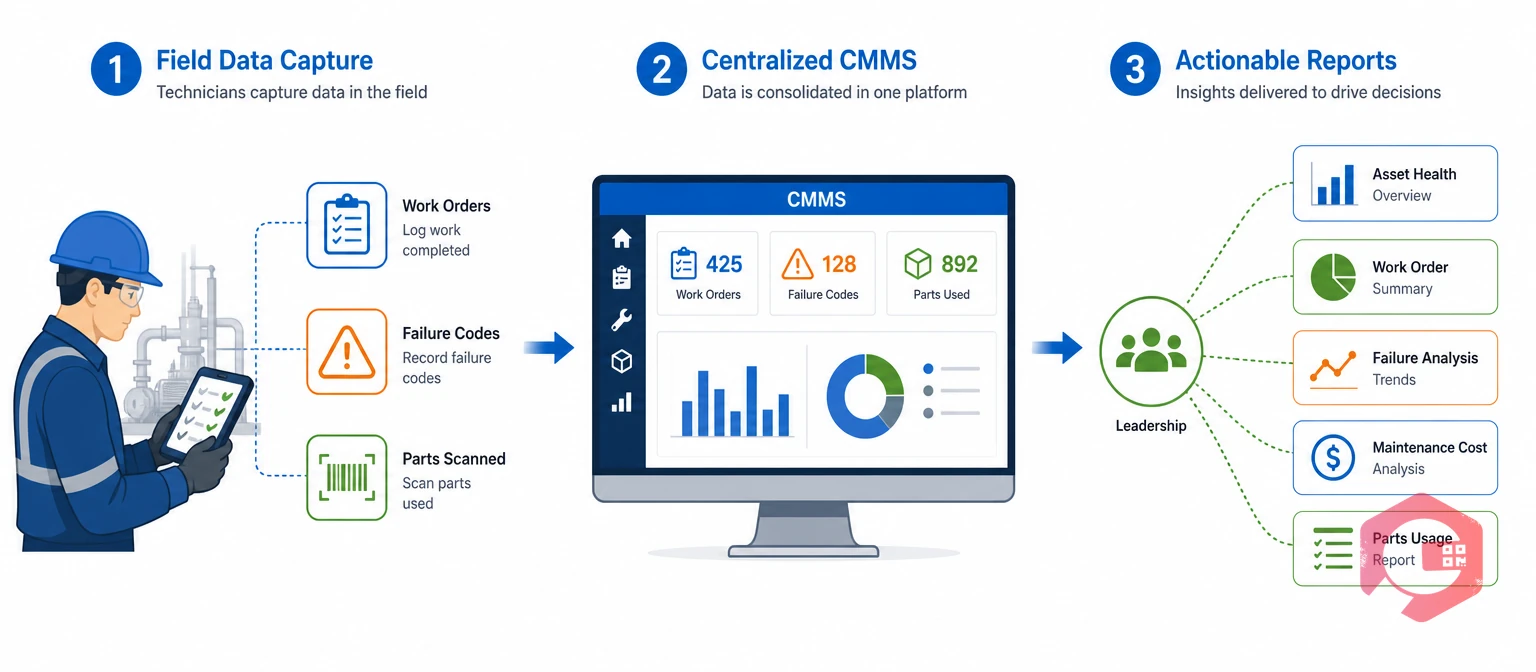
The value of these five reports depends entirely on the quality of the underlying data — and that data comes from technicians consistently logging work orders, recording failure codes, completing digital checklists, and scanning parts in and out of inventory. A CMMS that integrates all these activities in one platform generates all five reports from the same data source, eliminating manual calculation and ensuring the numbers leadership sees reflect what technicians record in the field.
Cryotos builds each of these report views directly into its BI dashboard, with live data drawn from active work orders, PM schedules, asset cost records, and condition monitoring inputs. Drill-down capability lets operations leaders move from plant-level summaries down to individual asset histories without switching systems or exporting data.
The report builder in Cryotos lets maintenance managers configure custom report templates — setting the metrics, date ranges, asset filters, and criticality classes that matter for their specific operation — and schedule automated delivery to the right stakeholders via email or WhatsApp. The weekly downtime summary that used to take a maintenance manager two hours to compile manually becomes a scheduled report that arrives in the plant director's inbox on Monday morning with no manual effort.
For the financial reporting view, Cryotos automatically calculates asset-level maintenance costs from work order labor logs, parts consumption, and contractor invoices — no manual cost aggregation required. The MC/RAV ratio calculates automatically when replacement asset values are configured in the asset register. For condition monitoring, IoT sensor data flows directly into the asset health dashboard, updating threshold status in real time rather than requiring manual readings.
| Report | Primary Decision | World-Class Benchmark | Warning Threshold |
|---|---|---|---|
| Downtime and Failure Behavior | Trigger RCA on bad-actor assets | MTBF improving quarter-on-quarter | Same failure code >3x in 60 days |
| Work Management Efficiency | Redistribute labor; reduce reactive ratio | ≥80% planned work; ≥90% schedule compliance | Planned ratio below 70%; backlog ratio above 1.3 |
| Asset Health and Availability | Direct CI effort to highest OEE gain | OEE ≥85%; availability ≥95% | OEE below 60%; any asset on Red threshold |
| Maintenance Financials | Justify repair-vs-replace; manage inventory | MC/RAV 2.0–2.5% general manufacturing | MC/RAV above 6% for 2+ consecutive years |
| PM Compliance by Criticality | Protect Class A assets; prioritize when stretched | Class A compliance ≥95% | Any Class A task overdue by >7 days |
The Downtime and Failure Behavior Report is the highest-impact starting point for most operations leaders. It immediately ranks which assets are consuming the most production time and maintenance effort — giving you a data-backed priority list for where to focus improvement action first. Once bad-actor assets are identified and failure rates start declining, the Work Management Report becomes the next priority: confirming that the improvement in reactive calls is translating into a genuine shift toward planned work.
The standard industry target is 80% planned work — meaning 80% of total maintenance hours go toward scheduled tasks rather than emergency responses. World-class facilities consistently exceed 90% planned work. Most facilities beginning a reliability improvement program operate below 60%, which means more than half of all maintenance activity is reactive. Each 5-percentage-point gain toward planned work typically reduces total maintenance cost by 8–12% through elimination of emergency parts premiums, overtime costs, and collateral asset damage from uncontrolled failures.
OEE equals Availability multiplied by Performance efficiency multiplied by Quality rate. Availability is the percentage of scheduled production time the asset was actually running — calculated from MTBF and MTTR. Performance compares actual output rate to the maximum rated output rate. Quality measures the proportion of output meeting specification versus total output produced. A facility with 94% availability, 88% performance, and 97% quality has an OEE of 80.3%. World-class OEE is 85% or higher; 60–70% OEE is typical for well-managed facilities that have not yet implemented a structured improvement program.
World-class MC/RAV sits at 2.0–2.5% for general manufacturing. This means annual maintenance spend — combining labor, parts, and contractor costs — should be between 2 and 2.5% of the total replacement value of your production assets. Capital-heavy sectors including oil and gas, mining, and utilities target below 3.5%. An MC/RAV above 5–6% for a specific asset signals that continued maintenance is becoming economically questionable compared to replacement. Above 8–10%, the asset has typically already "paid for itself" in annual maintenance spend and the replacement case is straightforward.
An aggregate PM compliance score treats every task as having equal importance — which masks critical gaps. A plant can report 92% overall PM compliance while consistently missing inspections on its most consequential bottleneck machines. Filtering completion rates by criticality class (Class A direct-impact assets, Class B significant-impact assets, Class C/D lower-consequence assets) ensures that leadership focus aligns with operational risk rather than administrative tidiness. A Class A asset with 75% PM compliance represents genuine production risk, regardless of what the headline compliance figure shows.
Yes — provided the CMMS captures work orders, failure codes, PM completion data, asset criticality classifications, parts consumption, and maintenance costs in a single integrated system. When all five data streams feed from the same source, all five reports stay consistent and current without manual compilation. Cryotos is built specifically for this: each report draws from the same data technicians capture through daily work order activities, with the BI dashboard and report builder making each view available to the right stakeholders automatically.
Operations leaders who want to see these five reports built around their actual asset register and maintenance environment can schedule a free Cryotos demo and walk through each report view with data from their own facility.



Cryotos AI predicts failures, automates work orders, and simplifies maintenance—before problems slow you down.



