

The 2026 Maintenance Benchmark Report distills the numbers maintenance teams most often ask about into one readable reference. It covers the seven KPIs that separate world-class plants from reactive ones — OEE, planned maintenance percentage, MTBF, MTTR, maintenance cost as a percentage of RAV, schedule compliance, and wrench time — with the industry-accepted targets your plant can compare against today.
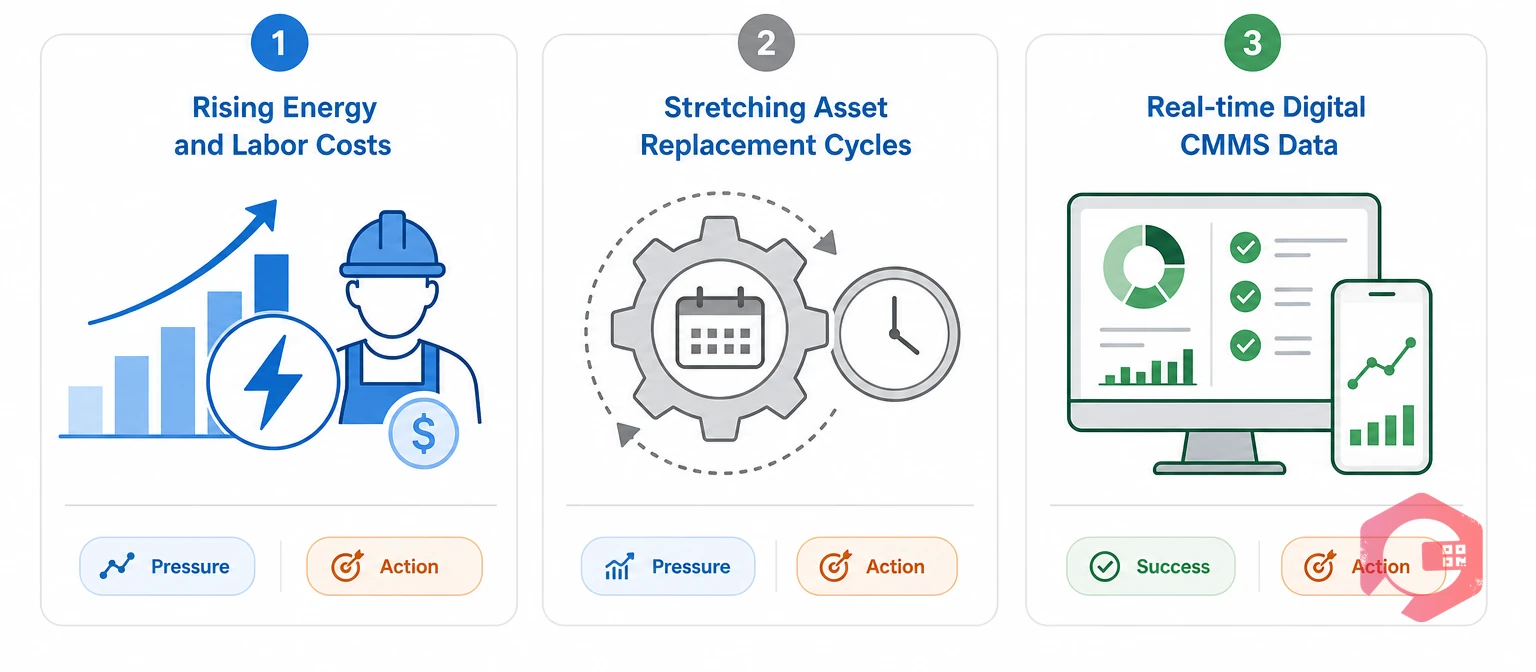
Benchmarks give maintenance teams a reference point that internal history alone can't provide. A plant that cut its MTTR from 6 hours to 4 hours looks like a success story on a trend chart. Compared to an industry benchmark of 2 hours, the same data reveals significant room to improve. The Society for Maintenance and Reliability Professionals (SMRP) has tracked plant maintenance benchmarks since 1992, and their data consistently shows that plants comparing KPIs against external benchmarks outperform plants relying on internal trending alone.
In 2026, three pressures make benchmarking more relevant than before:
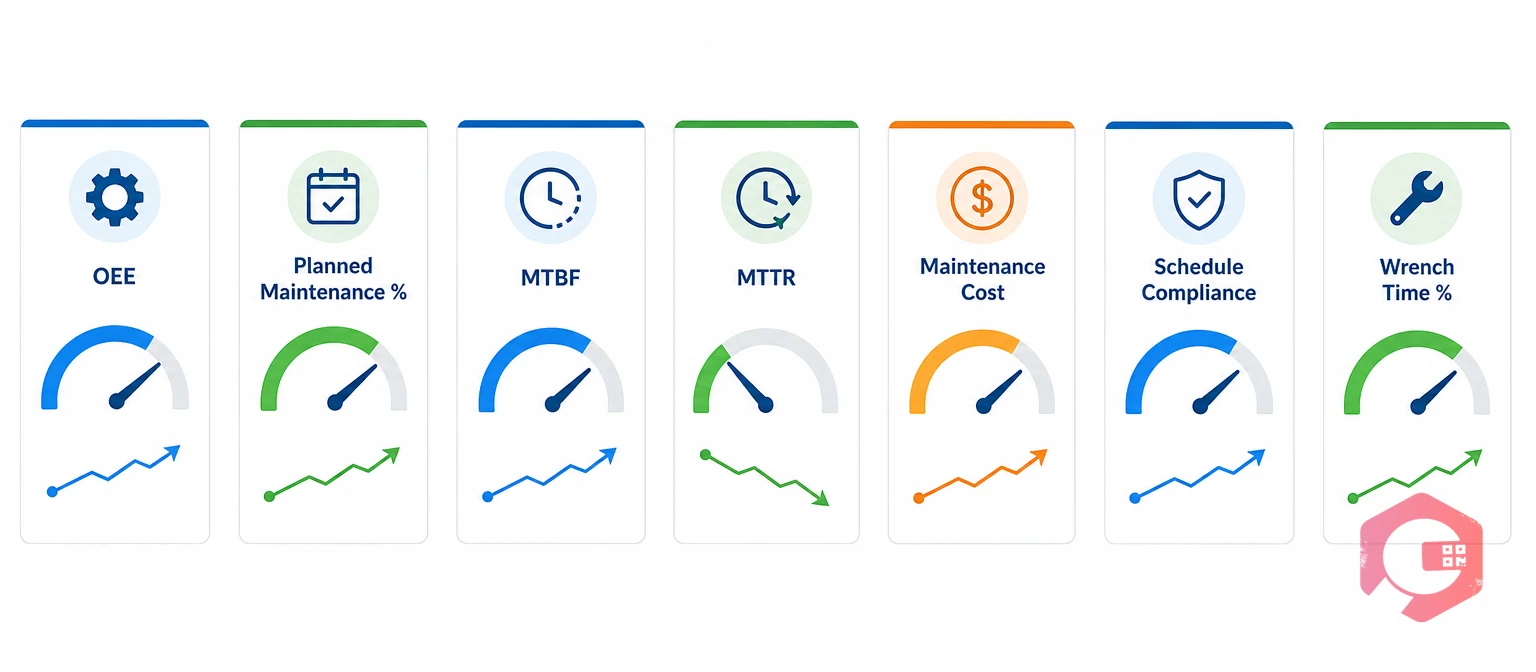
OEE is the single most widely recognized production efficiency metric in manufacturing. It combines availability, performance, and quality into one percentage. A score of 85% or above is the accepted world-class target. Most plants operate between 40% and 65%. Use the OEE calculator to get your baseline before comparing against the scorecard below.
PMP measures what share of your total work orders are planned rather than reactive. World-class programs run at 80% planned or above. A plant stuck below 50% is spending more than half its maintenance hours chasing breakdowns — which costs roughly twice as much per labor hour as planned work.
MTBF is the average time an asset runs between failures. Higher is better. A rising MTBF on critical equipment signals that your preventive maintenance program is working. A falling MTBF signals asset aging or a PM program that isn't catching what it should. A 10–15% year-over-year improvement is a realistic and meaningful target for most plants.
MTTR measures how long it takes to restore a failed asset from the moment the fault is detected. World-class operations in discrete manufacturing target MTTR under 2 hours for critical assets. The industry average sits between 3 and 6 hours. MTTR is often driven more by parts availability and diagnostic clarity than by the repair itself — meaning the fix is usually a planning problem, not a people problem.
This ratio compares annual maintenance spend against the replacement asset value of the plant's equipment. World-class plants hold this under 2–3%. Anything sustained above 4–5% points to reactive, breakdown-driven spend. It ties cost directly to asset value, making it one of the few KPIs that both finance and maintenance can use in the same conversation.
Schedule compliance measures what percentage of planned maintenance tasks are completed within their scheduled window. The target is 90% or above. Low schedule compliance often points to poor parts availability, crew interruptions from reactive work, or overloaded PM schedules. Plants above 90% typically have a mature backlog management process backed by a real-time maintenance KPI dashboard.
Wrench time is the percentage of a technician's shift spent on actual hands-on maintenance work — as opposed to waiting for parts, traveling, or handling paperwork. Industry averages sit at 25–35%. High-performing teams push this to 55–65% through structured planning, kitting, and digital work orders. Use the wrench time calculator to check where your team stands.
The table below consolidates all seven KPIs into a single reference. Compare your current numbers against the three performance bands and identify which metrics deserve attention first.
| KPI | World-Class | Average | Below Average / Reactive |
|---|---|---|---|
| OEE | 85%+ | 65–84% | Below 65% |
| Planned Maintenance % | 80%+ | 55–79% | Below 55% |
| MTBF (critical assets) | Trending up 10–15% YoY | Flat year-over-year | Declining |
| MTTR (critical assets) | Under 2 hrs | 2–6 hrs | 6+ hrs |
| Maintenance Cost as % RAV | Under 2–3% | 3–4% | 4–5%+ |
| Schedule Compliance | 90%+ | 70–89% | Below 70% |
| Wrench Time | 55–65% | 35–54% | Below 35% |
If two or more KPIs fall in the "Below Average" column, the root cause is almost always the same: reactive work crowding out planned activity. Addressing that one problem — through better PM scheduling, parts availability, and backlog discipline — moves multiple metrics at once.
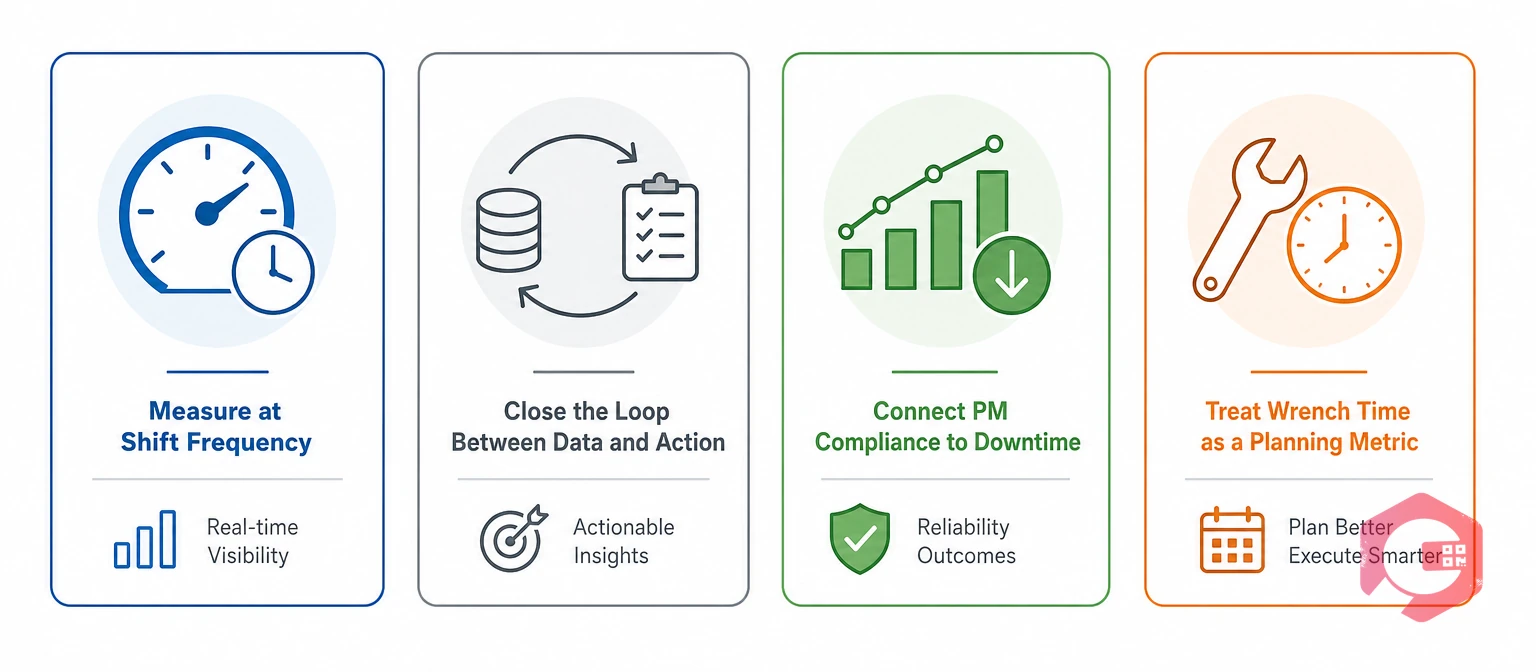
Plants at the top of the maintenance benchmark table share a few operating habits that average plants rarely manage consistently.
According to Plant Engineering's ongoing maintenance surveys, the strongest predictor of top-quartile plant performance is not which maintenance strategy a plant uses — it's the consistency and frequency of performance measurement. Plants that review KPIs weekly outperform plants that review them monthly, regardless of framework.
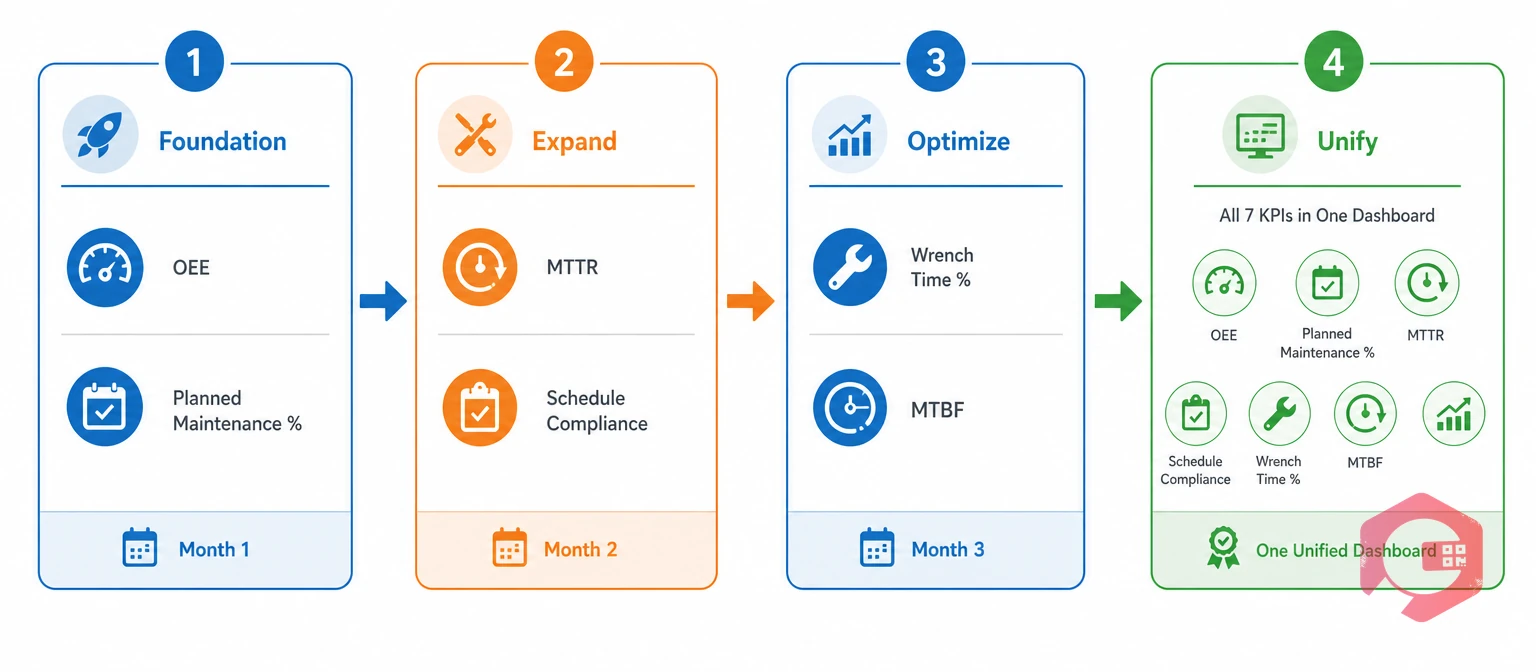
Tracking all seven KPIs at once can feel overwhelming. A sequenced approach removes that barrier — get the data flowing first, then layer in the analysis.
The goal in month one isn't perfection. It's getting a live number for each maintenance benchmark KPI so the team has a real reference point to improve against, rather than a feeling that things are going well or badly. Cryotos customers report up to 30% reduction in unplanned downtime and 25% faster repair turnaround after implementing structured KPI tracking — gains that show up across the entire benchmark scorecard when the data flows automatically rather than landing in a quarterly spreadsheet. Track overall equipment effectiveness and the six supporting metrics together, and the compounding effect becomes visible within weeks.
A world-class OEE score for discrete manufacturing is 85% or above. Most facilities globally start between 40% and 65%. Process industries such as chemical refining target 90–95% due to the continuous nature of their production and the high cost of any unplanned stop. The right benchmark depends on your industry and production model, but 85% is the most widely cited reference for general manufacturing.
A planned maintenance percentage of 80% or above is world-class. This means at least 8 in 10 work orders are scheduled in advance rather than triggered by breakdown. The industry average for most manufacturing facilities sits closer to 55–65%. Moving from 60% to 80% PMP typically cuts emergency labor costs significantly, since planned work runs roughly half the cost per labor hour of reactive work.
World-class plants review OEE and schedule compliance at shift level — meaning every morning. MTTR and MTBF are typically reviewed weekly by asset class. Wrench time and maintenance cost as a percentage of RAV are usually reviewed monthly or quarterly. No KPI should go more than a month without review — monthly gaps leave corrective action too late to stop a trend from becoming a cost problem.
The industry average for wrench time is 25–35% of a technician's working shift. High-performing teams achieve 55–65%. The gap between average and world-class is almost always driven by parts delays, permit and access waits, and excess travel time — not slow technicians. Improving wrench time is primarily a planning and logistics problem that a mobile work order system and pre-kitted parts processes address directly.
Yes. A well-configured CMMS captures the underlying data for all seven KPIs — work order timestamps, failure history, parts consumption, and labor hours — and surfaces them in a live dashboard without manual export or spreadsheet work. The key requirement is that every work order must capture start and end timestamps, link to a specific asset, and classify the work type as planned or reactive. Without that discipline in data entry, the raw events exist but the benchmarks can't be calculated reliably.
Knowing where your plant sits against the 2026 maintenance benchmark is the first step. Closing the gap is where the work happens. Schedule a free demo to see how Cryotos surfaces all seven KPIs in one live dashboard — so your team spends time acting on the numbers, not gathering them.


Cryotos AI predicts failures, automates work orders, and simplifies maintenance—before problems slow you down.



