

Maintenance cost as a percentage of RAV is the ratio of total annual maintenance spend to the replacement asset value of a plant's equipment, shown as a percentage. You calculate it by dividing total maintenance spend by replacement asset value, then multiplying by 100. Reliability groups have quoted a rough target for decades: world-class plants keep this number under 2 to 3%. Anything sustained above 4 to 5% usually points to reactive, breakdown-driven spend. Most maintenance teams have heard this benchmark in a conference talk at least once. Almost none of them can pull the number up on a screen today.
Key Takeaways
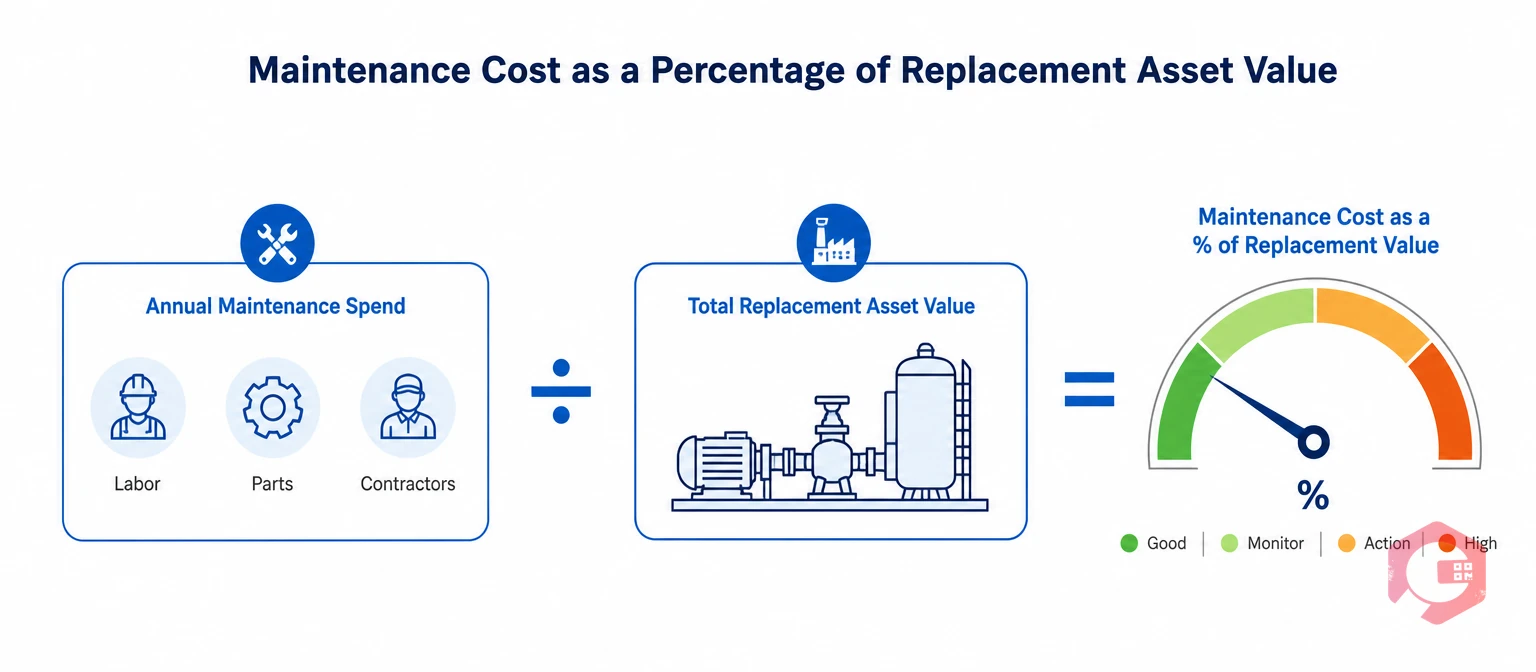
Maintenance cost as a percentage of RAV is a ratio that compares yearly maintenance spend to the cost of replacing every asset a plant owns. It answers one simple question: how much does it cost to keep the equipment running, compared to what it would cost to buy it all new today?
Replacement Asset Value, or RAV, is the current-day cost to replace every asset in a facility with new equivalent equipment. That is a different number than book value. Book value depreciates every year on a balance sheet. RAV does not depreciate — it reflects what a new pump, compressor, or conveyor line would cost to buy and install right now.
The formula behind maintenance cost as a percentage of RAV looks like this:
Here's a simple example. A plant spends $1.2 million a year maintaining equipment worth $40 million to replace. Divide $1.2 million by $40 million, multiply by 100, and you get 3%. That sits inside the range most reliability associations call average to good.
Maintenance cost as a percentage of RAV is one of the few numbers that both finance and maintenance teams recognize right away. It gives a plant one ratio to compare itself against industry norms, defend a maintenance budget, and catch spend drifting toward reactive firefighting years before that drift shows up in a downtime report.
The idea traces back to asset management frameworks like ISO 55000. That standard treats maintenance spend as an investment in protecting asset value. It is not just a cost to minimize. Plants that adopt this framing find it easier to justify preventive maintenance budget. The conversation shifts. Instead of asking "why does maintenance cost so much," leaders start asking "is this spend proportional to what we're protecting."
Two things block a plant from tracking this ratio continuously. First, most CMMS platforms don't hold a defensible RAV figure for every asset. That number usually lives in a capital planning spreadsheet that finance owns. It sits disconnected from the system maintenance teams use every day. Second, even where cost data exists, nobody rolls it up against replacement value automatically. Someone has to reconstruct the whole thing by hand at year-end using invoices and timesheets. That work is tedious. Most teams simply skip it until someone in finance asks for the number.
Without a live number, reactive drift hides in plain sight. A plant might spend an extra $200,000 a year on emergency repairs and never notice, because the maintenance budget still looks roughly the same size it always has. The RAV ratio would catch that shift immediately, because emergency work costs more per hour than planned work. Skipping the ratio means skipping an early warning system that costs nothing extra to run once the data is already in the CMMS.
The numerator of maintenance cost as a percentage of RAV is easy to name but hard to capture in full. Most plants under-count it without realizing.
Leave any one of these out consistently, and the ratio understates real spend. That makes a plant look better than it actually is, right up until a capital request gets denied because the numbers didn't match reality on the shop floor. A simple fix works for most teams: audit the numerator once a quarter against actual invoices, and flag any cost category that hasn't shown up in the roll-up for more than sixty days.
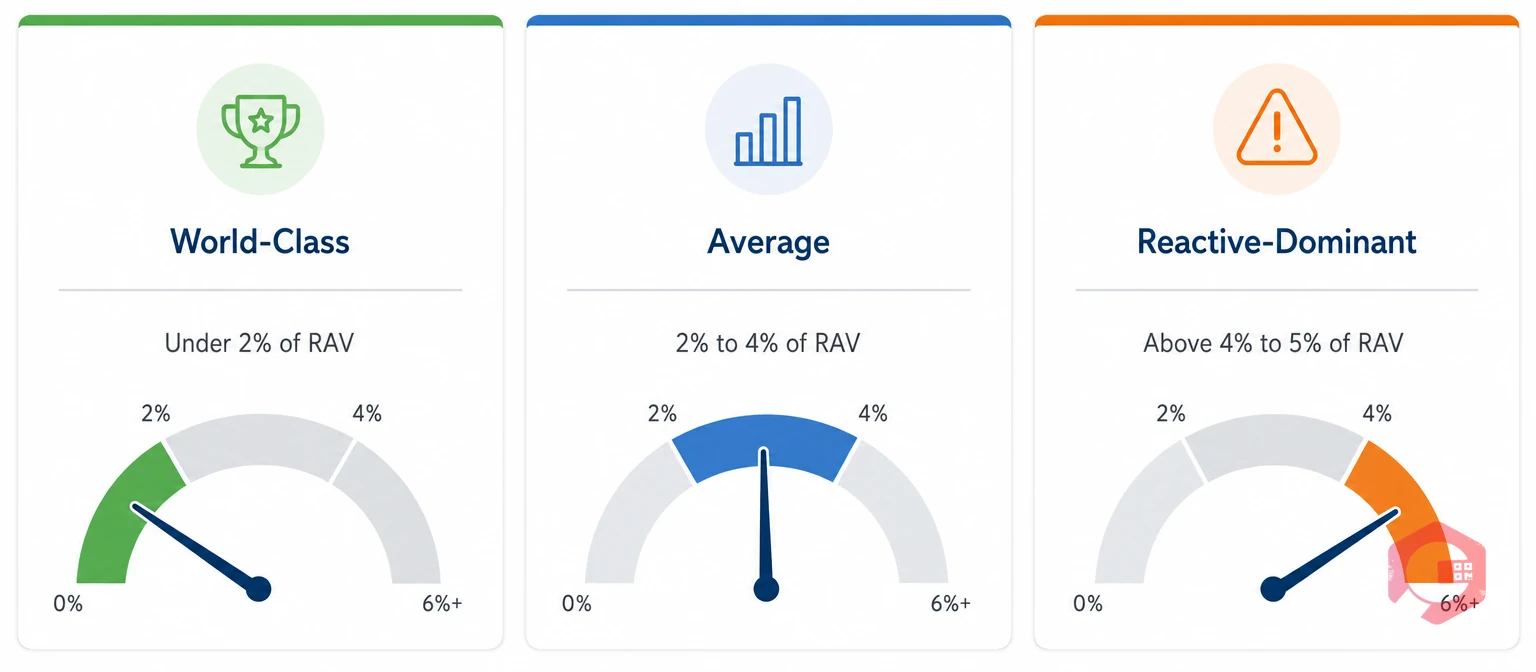
Reliability practitioners sort maintenance cost as a percentage of RAV into three bands. Where a plant lands tells a fairly specific story about how its maintenance program runs day to day.
| Band | Ratio Range | What It Signals | Typical Action Needed |
|---|---|---|---|
| World-Class | Under ~2% | Mature preventive and condition-based programs, low reactive spend | Keep the program running, watch for under-investment |
| Average | 2% – 4% | Mixed planned and reactive work, room to improve | Shift budget toward preventive and condition-based work |
| Reactive-Dominant | Above 4–5% | Breakdown-driven spend, aging assets, or heavy contractor use | Investigate the cost breakdown and prioritize reliability work |
A site running at 1.8% becomes a reference case other plants get measured against. A site running at 6% becomes a priority for reliability intervention. The cost category breakdown behind that number usually points straight at the cause.
Curious where your own numbers land? Try the mean maintenance cost calculator to check your ratio before reading further.
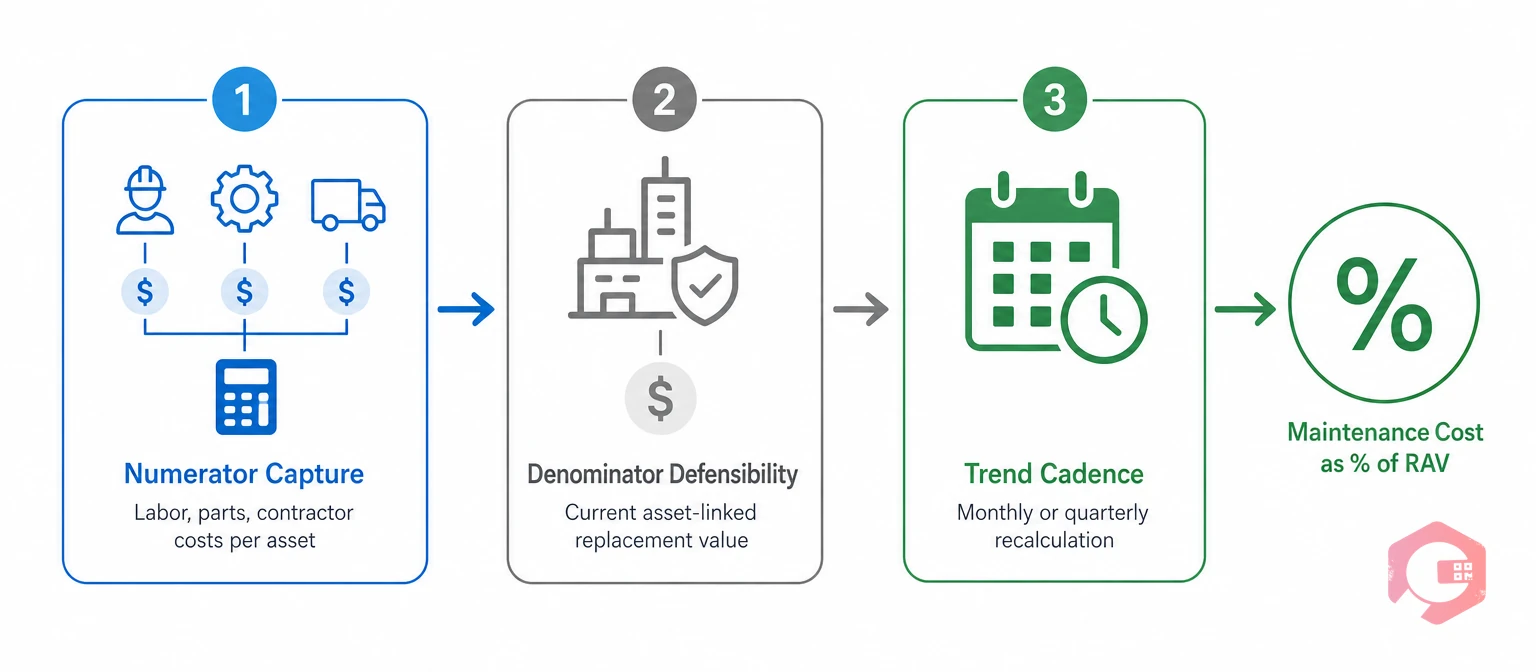
Getting a trustworthy maintenance cost as a percentage of RAV depends on three things working together. Plugging numbers into a formula once a year isn't enough on its own.
The RAV Ratio Health Framework:
Say a mid-size manufacturing plant logs $180,000 in preventive labor, $95,000 in parts, $140,000 in contractor invoices, and $35,000 in overhead for one quarter. That totals $450,000. If the plant's replacement asset value is $18 million, the quarterly ratio is $450,000 divided by $18,000,000, times 100, which equals 2.5%. Annualized, that's close to 10%. That number sits well above the reactive-dominant line, which would prompt most maintenance managers to break the spend down by category before the next budget cycle.
A few habits quietly wreck the accuracy of maintenance cost as a percentage of RAV before anyone notices.
Most maintenance teams already use a Computerized Maintenance Management System to log work orders and track costs. The gap isn't a lack of cost data. It's that the RAV figure lives somewhere else entirely, disconnected from the system that tracks daily maintenance work.
The result is a metric everyone quotes from a conference slide and almost nobody calculates correctly on a rolling basis.
Cryotos closes the gap between the maintenance cost as a percentage of RAV benchmark teams quote and the number they can actually see day to day.
Every asset in Cryotos carries a Replacement Asset Value field next to its standard record — purchase cost, depreciation schedule, and current replacement estimate. Teams populate it once during asset tracking onboarding or bulk import, so the figure sits beside maintenance history instead of in a separate finance file.
Cryotos pulls labor hours, parts consumed, and contractor costs from every work order back to the originating asset automatically. Incidents, PMs, and corrective work orders are already linked to an asset record, so total maintenance cost for any period is a live number instead of a year-end reconstruction from invoices.
The ratio calculates automatically at the asset level, the equipment class level, and the plant level. A manager can see whether a single compressor is running hot against its replacement value, or whether an entire site has crossed the reactive threshold.
Cryotos plots the live ratio against the world-class, average, and reactive-dominant bands. Teams can set a target band per asset class or site. When rolling spend crosses that threshold, Cryotos notifies the maintenance manager and finance stakeholders automatically, instead of surfacing the problem at year-end.
A rising ratio on its own tells you there's a problem, not what caused it. Cryotos breaks maintenance cost into preventive, corrective, emergency, and contractor spend inside the same BI dashboard, so a spike traces back to its source instead of staying a mystery.
The ratio is built from the same structured report builder data used for work orders and assets. Cryotos exports RAV-ratio reporting in a format finance and capital planning teams can use directly for budget defense, without a manual data-gathering exercise.
Maintenance teams using Cryotos have reported up to 30% reduction in unplanned downtime and 25% faster repair turnaround. Those gains show up directly in the RAV ratio's numerator over time, since fewer emergency repairs mean lower cost per asset.
Once maintenance cost as a percentage of RAV is calculated automatically, it stops being a benchmark quoted from a conference paper. It becomes an operating number that informs budget, staffing, and capital decisions in real time.
When an aging asset's individual ratio climbs well above the plant average, that asset becomes a clear candidate for replacement instead of continued repair. The decision gets made on cumulative cost evidence, not just one expensive breakdown.
A maintenance manager asking for more preventive maintenance budget has a stronger case when the plant's ratio sits above the reactive-dominant threshold. A cost breakdown proving the overage is emergency and contractor spend, rather than planned work, makes that case concrete through project and budget tracking.
Multi-site operators compare the ratio across plants on the same footing, because every site calculates it the same way from the same underlying maintenance cost and asset data. A site running low becomes the internal reference case for the rest of the network.
A rising ratio driven by corrective and emergency work is typically a leading indicator. It shows up in cost data before it shows up in downtime or MTBF figures. Most facilities that catch the drift early avoid the failure escalation that follows a few months later.
When a plant shifts investment toward preventive maintenance or condition monitoring, the RAV ratio is one of the few metrics that shows the financial payoff of that shift over time. Declining reactive spend against a stable asset base connects reliability engineering effort directly to a number finance already recognizes.
The AI Dashboard inside Cryotos answers plain-English questions like "What is our maintenance cost as a percentage of RAV this quarter?" or "Which site is furthest above the reactive threshold?" That turns a manual finance-and-maintenance exercise into an on-demand answer.
Most plants can get maintenance cost as a percentage of RAV live within a single quarter, following a straightforward rollout order.
A useful RAV ratio dashboard does more than display one number. It should show the current ratio next to its target band, a trend line for the last twelve months, and a one-click breakdown by cost category. A manager should be able to glance at the screen, see whether the plant sits inside its target band, and know within seconds whether the trend is improving or getting worse. If the dashboard can't answer those three questions at a glance, it isn't finished yet.
Maintenance cost as a percentage of RAV and capital budgeting sit closer together than most teams realize. Capital planners decide when to replace an asset. Maintenance teams decide how much to spend keeping it running in the meantime. The RAV ratio is the bridge between those two decisions.
Think of it this way. Every dollar spent on reactive repair for an aging asset is a dollar not spent on its eventual replacement. When the ratio for a specific asset class climbs past the reactive-dominant line and stays there, that's a signal. It tells capital planning that the cheaper path forward is probably a new asset, not another year of patch repairs.
Many reliability teams use a rough rule to decide when repair no longer makes sense. If an asset's own RAV ratio runs at double the plant average for two years running, it goes on the capital replacement shortlist. This rule isn't perfect, but it gives finance and maintenance a shared trigger point instead of an argument that starts fresh every budget cycle.
Plants that connect the two numbers early tend to avoid the worst outcome: an asset that fails catastrophically after years of rising repair bills nobody flagged in time. The RAV ratio, tracked consistently, removes the guesswork from that call.
Capital-intensive operations feel maintenance cost as a percentage of RAV the hardest, because a small percentage swing represents a large dollar figure against their asset base. Manufacturing plants track it to justify reliability investment against production equipment worth tens of millions of dollars. Utilities, oil and gas operators, and mining sites track it for similar reasons. Their RAV is enormous, so even a one-point shift in the ratio moves the budget conversation significantly.
Frameworks like reliability-centered maintenance and benchmarking guidance from the Society for Maintenance and Reliability Professionals both treat this ratio as a core input for deciding where reliability investment goes next. Most facilities that adopt formal asset management practices track it as a standing KPI rather than a once-a-year exercise buried in a spreadsheet.
Healthcare facilities and hospitals track a version of this ratio too, though their RAV mix leans toward medical equipment rather than production machinery. Food and beverage plants watch it closely because unplanned downtime on a single line can spoil an entire batch, pushing reactive costs up fast. In every one of these industries, the same rule holds. The bigger the asset base, the more a small shift in the ratio matters in real dollars.
A ratio under roughly 2 to 3% is generally considered world-class. It points to a mature preventive or condition-based maintenance program. Anything sustained above 4 to 5% usually signals reactive, breakdown-driven spend or an aging asset base that needs capital investment instead of continued repair.
Replacement asset value is the current-day cost to replace every asset with equivalent new equipment, not the depreciated book value on a balance sheet. Most teams build it by pricing current market replacement cost per asset class, then rolling that total up across the facility. Update it whenever equipment gets added, retired, or replaced.
Differences usually come from how consistently maintenance cost and RAV get captured, not from an actual performance gap. A facility that includes contractor spend and overhead in its numerator but leaves half its assets out of the denominator will show an artificially high ratio compared to a facility that captures both sides completely.
Yes. A ratio that climbs steadily, especially when the increase traces back to emergency and corrective work, is a leading indicator of reliability problems. It typically shows up in cost data months before the same drift appears in downtime or MTBF metrics. That gives maintenance managers a head start on fixing the problem.
Monthly or quarterly recalculation catches drift while it's still cheap to correct. Calculating it once a year during budget season means a plant discovers reactive drift long after the spend already happened, rather than while there's still time to redirect the budget toward preventive work.
Yes, though the dollar amounts involved are smaller. A facility with a $2 million asset base benefits from the same 2 to 3% target band as a facility with a $200 million asset base. The ratio scales with the size of the operation. That scaling is exactly why it works as a cross-industry benchmark in the first place.
Most maintenance KPIs measure a single dimension, like MTTR for repair speed or OEE for equipment output. Maintenance cost as a percentage of RAV is different because it ties spend directly to asset value. It works as a summary metric that finance and maintenance can both use in the same conversation, rather than a purely operational number that only makes sense to a reliability engineer.
Maintenance cost as a percentage of RAV doesn't have to live in a once-a-year benchmarking report. Schedule a free demo to see how Cryotos turns this benchmark into a number your team can act on every day, not just during budget season.




Cryotos AI predicts failures, automates work orders, and simplifies maintenance—before problems slow you down.



