

PM optimization means matching preventive maintenance frequency and scope to an asset's real failure risk. It replaces a fixed calendar or an OEM default with intervals based on actual conditions. Most maintenance teams lean toward one extreme without realizing it. Some burn labor hours on PM tasks that never stop a failure. Others skip enough PM work that breakdowns keep climbing. Good PM optimization finds the calibration point between those two problems for every critical asset.
Key Takeaways

PM optimization is the ongoing practice of adjusting preventive maintenance intervals and task scope so they match an asset's real failure risk. It replaces one-size-fits-all calendars with criticality-based, usage-based, or condition-based intervals chosen per asset.
Most facilities build their first PM program from OEM manuals or industry defaults. These defaults rarely match actual operating conditions on the plant floor. A pump running two shifts a day wears differently than the same pump running one shift. ISO 55000 asset management guidance treats this kind of calibration as core to good asset management. It is not an optional extra.
Left unchecked, a PM program drifts toward one of two problems. It can become over-maintained. That means doing more work than the asset needs. It can become under-maintained instead. That means doing less work than the asset needs. Both waste money in different ways. Both get fixed with the same diagnostic process. The rest of this guide walks through that process step by step.

Over-maintenance and under-maintenance show up as opposite patterns in the same metrics. Comparing PM compliance, work order mix, and failure trends side by side makes the direction of drift easy to spot.
| Signal | Over-Maintenance | Under-Maintenance |
|---|---|---|
| PM compliance rate | 95%+ but failures aren't dropping | Below 80%, backlog keeps growing |
| Reactive work order share | Very low, but planned downtime is high | Rising month over month |
| MTBF trend | Flat despite heavy PM spend | Declining on specific assets |
| Downtime type | Planned downtime rising, unplanned flat | Unplanned spikes on a few "bad actor" assets |
A facility rarely drifts the same way on every asset. It is common to see over-maintenance on low-criticality equipment and under-maintenance on the high-value assets that need the most attention. Spotting this split early is often the fastest win in the whole PM optimization process, since it lets a team fix the biggest risk first.
Condition-based PM triggers from sensor data can fix both problems at once. Maintenance only fires when a real wear indicator appears, not on a fixed date.
PM programs drift out of calibration when intervals are set once and never revisited against real failure data. A handful of root causes explain most of the drift maintenance teams see.
Most maintenance teams do not drift on purpose. The schedule was correct on day one. It simply never got revisited as the asset, the plant, or the workload changed.
Over-maintenance quietly eats into the maintenance budget. It shows up as wasted labor hours, unneeded parts spend, and planned downtime that cuts into production capacity. Under-maintenance carries a sharper cost. It shows up as expedited repairs, safety incidents, and shorter asset life. Both problems compound over a year. That is why a periodic calibration check pays for itself quickly, often within a single quarter.
Digital maintenance checklists that log completion time, parts used, and technician notes give teams the data trail needed to catch this drift early instead of a year later.
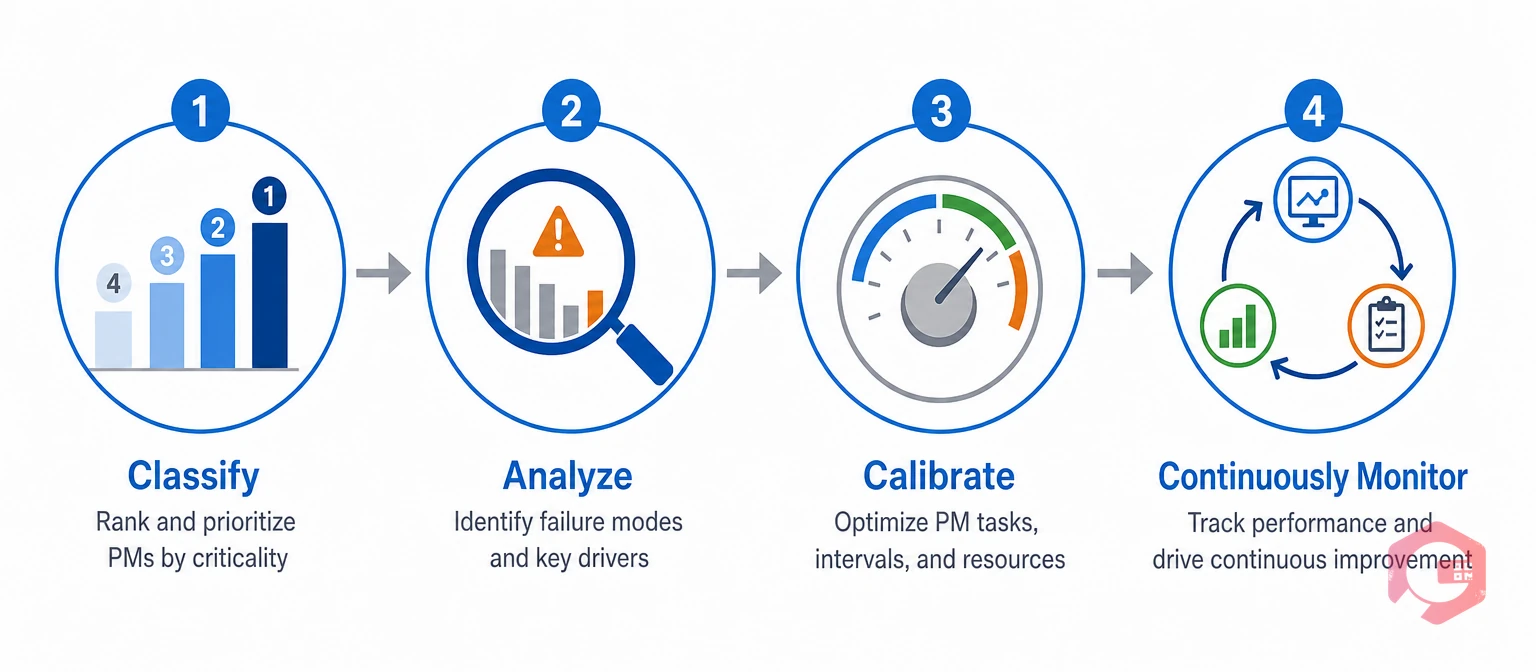
The Four-C PM Optimization Framework gives maintenance teams a repeatable four-step process for calibrating any PM program. It works for one asset. It also works for an entire facility. Teams can run it once a year or after any major change in production volume.
The Four-C PM Optimization Framework:
Score every asset on safety impact, production impact, and repair lead time. Critical assets earn tighter PM. Low-criticality assets can shift to a lighter or purely condition-based schedule. This one step usually fixes the "same PM frequency for everything" problem on its own.
A lightweight failure mode review, similar in spirit to an FMEA, shows whether a scheduled PM task ever actually addresses the failure modes an asset experiences. Tasks that do not are candidates for removal or redesign. This step is where most over-maintenance gets caught.
Optimization is not a one-time project. Maintenance teams that successfully hold their calibration re-check PM compliance, MTBF, and reactive-work ratio on a fixed monthly or quarterly cadence. Skipping this step is the single biggest reason a well-calibrated program drifts back out of shape within a year.
Maintenance teams using Cryotos have reported up to 30% reduction in unplanned downtime and 25% faster repair turnaround after recalibrating PM intervals with a framework like this.
Picture a mid-size plant with 40 pumps on the same calendar-based PM schedule. Compliance sits at 97%. Failures have not dropped in a year. A quick criticality review finds only 8 of the 40 pumps are actually critical to production.
The team moves the other 32 pumps to a lighter, condition-based check. They keep tight calendar PM only on the 8 critical pumps. Six months later, PM labor hours drop by a third. Unplanned downtime on the critical pumps also falls, because technicians now have time to do those PM tasks properly instead of rushing through 40 identical checklists.

Four metrics reliably show whether a PM program is over- or under-calibrated: compliance rate, reactive work ratio, MTBF, and cost per asset. None of them tell the full story alone, which is why they need to be read together.
A high compliance rate paired with a rising reactive ratio is a red flag. It usually means PM tasks are getting done. But they may not be the right tasks for that asset's real failure modes. Most operations that successfully optimize PM check all four numbers together. They avoid reacting to any single metric in isolation. A MTBF calculator makes it easy to benchmark this trend without building a spreadsheet from scratch.
A Computerized Maintenance Management System supports PM optimization by combining scheduling flexibility with the downtime and cost data needed to calibrate it. A CMMS holds the schedule, the failure history, and the cost data in one place. Cryotos CMMS covers each stage of the Four-C framework directly.
Facilities layering in reliability-centered maintenance principles find that condition-based maintenance triggers cut down the guesswork that causes drift in the first place. Service only fires when sensor data actually shows wear, not when the calendar says so.
Most facilities do not need to overhaul their entire PM program at once. Start with the ten or fifteen most critical assets. Apply the Four-C framework to those assets first. Expand to the rest of the plant from there. This smaller first step is usually enough to show a measurable drop in wasted PM labor and unplanned downtime within a single quarter.
Watch for PM compliance staying above roughly 95% while corrective work orders and failure rates are not improving. That gap between high compliance and unchanged failure risk is the clearest sign maintenance effort has stopped paying off.
Over-maintenance means servicing assets more often than their failure risk requires. It wastes labor and creates unnecessary planned downtime. Under-maintenance means servicing them less than required, which raises unplanned failures and reactive repair costs.
It depends on asset criticality and usage pattern. Stable, low-risk assets can run on a calendar schedule. Variable-use assets do better on usage-based intervals. High-value or high-risk assets benefit most from condition-based triggers.
Yes. A CMMS with usage-based and condition-based PM scheduling, plus downtime and cost reporting, shows exactly which recurring PM tasks are not preventing failures. That makes it easy to right-size or remove them.
PM compliance rate, the reactive-to-planned work order ratio, MTBF, and PM cost per asset together give a clear read. Healthy calibration looks like high compliance paired with a falling reactive-work ratio and stable or improving MTBF.
Pick your ten most critical assets first. Pull their last twelve months of failure and PM history. Run them through the Classify and Analyze steps before touching the rest of the plant. That small, focused first pass is usually enough to show whether the wider program leans over-maintained or under-maintained.
Getting PM optimization right is less about doing more or less maintenance. It is more about matching effort to actual asset risk. Schedule a free demo to see how Cryotos helps maintenance teams calibrate PM schedules with real downtime and compliance data.




Cryotos AI predicts failures, automates work orders, and simplifies maintenance—before problems slow you down.



