An ABC analysis report is an inventory report that ranks items by annual consumption value into classes A, B and C. Class A holds the few items that drive most of your spend, and class C holds the many that barely move the total. Reading the report well shows a maintenance store where to focus counting, ordering and supplier time.
This guide shows how to read an ABC analysis report in five steps, with a worked example and a rule for each class. It also explains how a Computerized Maintenance Management System like Cryotos builds the report, so you do not have to maintain it in a spreadsheet.
Key Takeaways
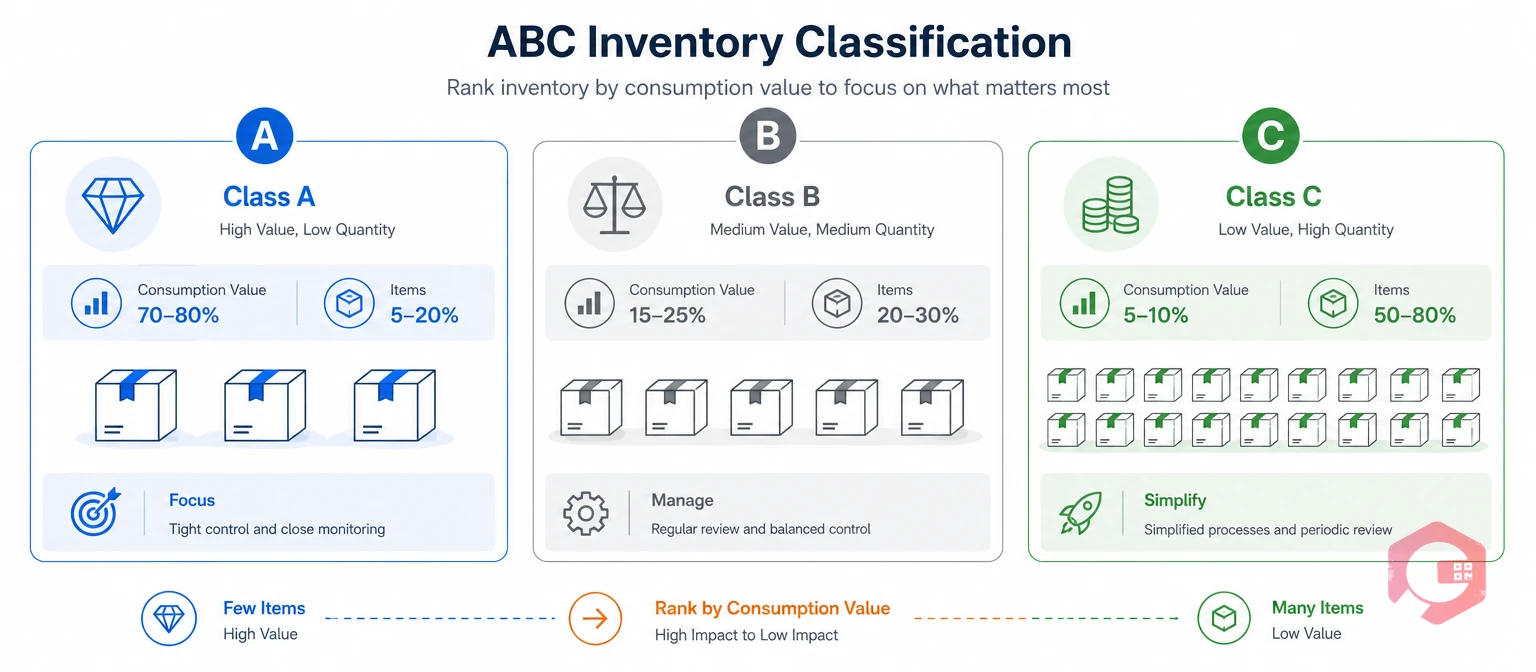
An ABC analysis report sorts every inventory item by its share of total consumption value and labels it A, B or C. It applies the Pareto principle to stock, because a small share of items usually drives most of the spend.
An ABC class is a value tier that sets how closely you control an item. The shares below are typical guides, not fixed rules.
ISO 55001 asks organizations to base asset decisions on evidence, and an ABC analysis report supplies the value side of that evidence for spare parts. Background on the method is in this overview of ABC analysis.
Most maintenance teams pair the report with a criticality rating, because value alone does not show which cheap part can stop a line. A clear report turns a long parts list into three control levels.
An ABC analysis report needs four inputs: issued quantity, unit cost, a time period and a scope. Annual consumption value is issued quantity multiplied by unit cost over the period.
Most facilities find the weak point is the data, not the math. Missing unit costs and one-off project purchases cause most misleading rankings, so clean the inputs before you trust the result.
Want these inputs gathered for you? Cryotos inventory management records issues, returns and costing methods (FIFO, LIFO or average cost) against each item, so the report reads from live stock data.
A sample ABC analysis report lists items from highest to lowest value, then adds a running total to show where each class ends. The figures below are illustrative, from a small store with $100,000 of annual consumption.
| Rank | Item | Annual value | % of total | Cumulative % | Class |
|---|---|---|---|---|---|
| 1 | Hydraulic pump assembly | $46,000 | 46% | 46% | A |
| 2 | Servo motor 750 W | $22,000 | 22% | 68% | A |
| 3 | Spindle bearing set | $12,000 | 12% | 80% | A |
| 4 | Proximity sensors | $7,000 | 7% | 87% | B |
| 5 | Timing belts | $5,000 | 5% | 92% | B |
| 6 | Contactors | $3,000 | 3% | 95% | B |
| 7 | Cable ties and fasteners | $3,000 | 3% | 98% | C |
| 8 | Cleaning supplies | $2,000 | 2% | 100% | C |
Three items reach 80% of value, so they form class A. The next three take the total to 95% and form class B, and the last two make up the final 5% as class C. An item that reaches a cutoff stays in the higher class, which is why the 80% and 95% rows keep their class.
A short sample skews the item shares, because 3 of 8 items is far above the usual 10-20%. In a store with 1,000 parts, class A is normally a much smaller slice of the catalog.
The ranking also shows where a counting hour pays off most. A record error on the hydraulic pump assembly affects $46,000 of yearly spend, while the same error on cable ties affects $3,000.
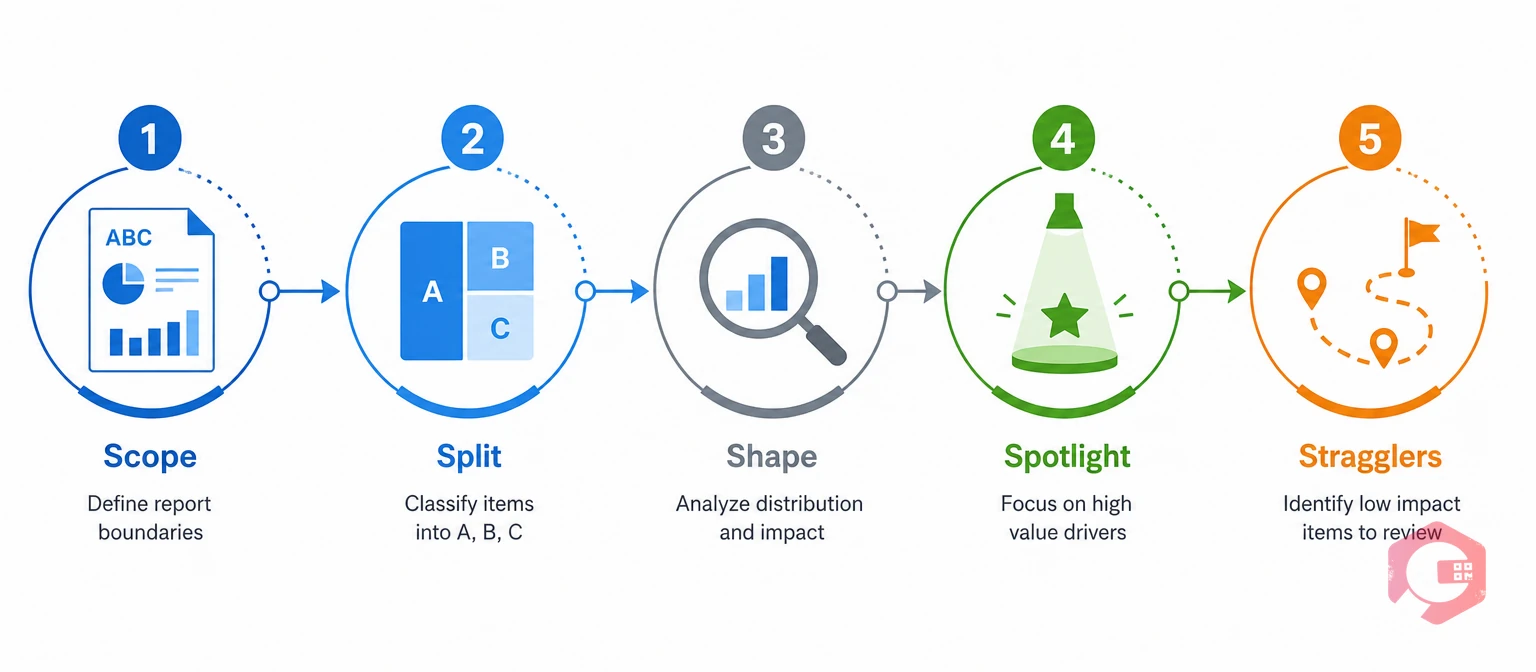
To read an ABC analysis report, check five things in order: scope, class split, chart shape, rows near the cutoffs and items outside the ranking. The method below names each check.
The Pareto Read-Through Method:
Start with the period, site, store, costing basis and thresholds, because every number depends on them. A three-month window or the wrong costing basis can move the same item into a different class.
Confirm the thresholds too. The common split is 80% for class A, 15% for class B and 5% for class C.
Read three numbers for each class: its share of items, its share of consumption value and its share of stock value. A class that holds a much larger share of stock than of consumption is overstocked.
For example, if class C holds 17% of stock value but only 5% of consumption, cash is tied up in slow stock. Class A usually shows the opposite, with a stock share well below its consumption share.
A Pareto chart plots item values as bars with a cumulative line over them. A steep line means a few items drive spend, while a flat line means spend is spread across many items.
If the line is flat, the usual 80/15/5 cutoffs may not fit. Try a different split and check whether the class A list becomes more useful.
Items slightly above or below a cutoff can change class after one unusual month. Review them with the planner or storekeeper before you lock the class.
A straggler is an item that cannot be ranked fairly by consumption value. Three groups need their own review.
Five short checks turn a page of numbers into a review you can finish in one sitting.
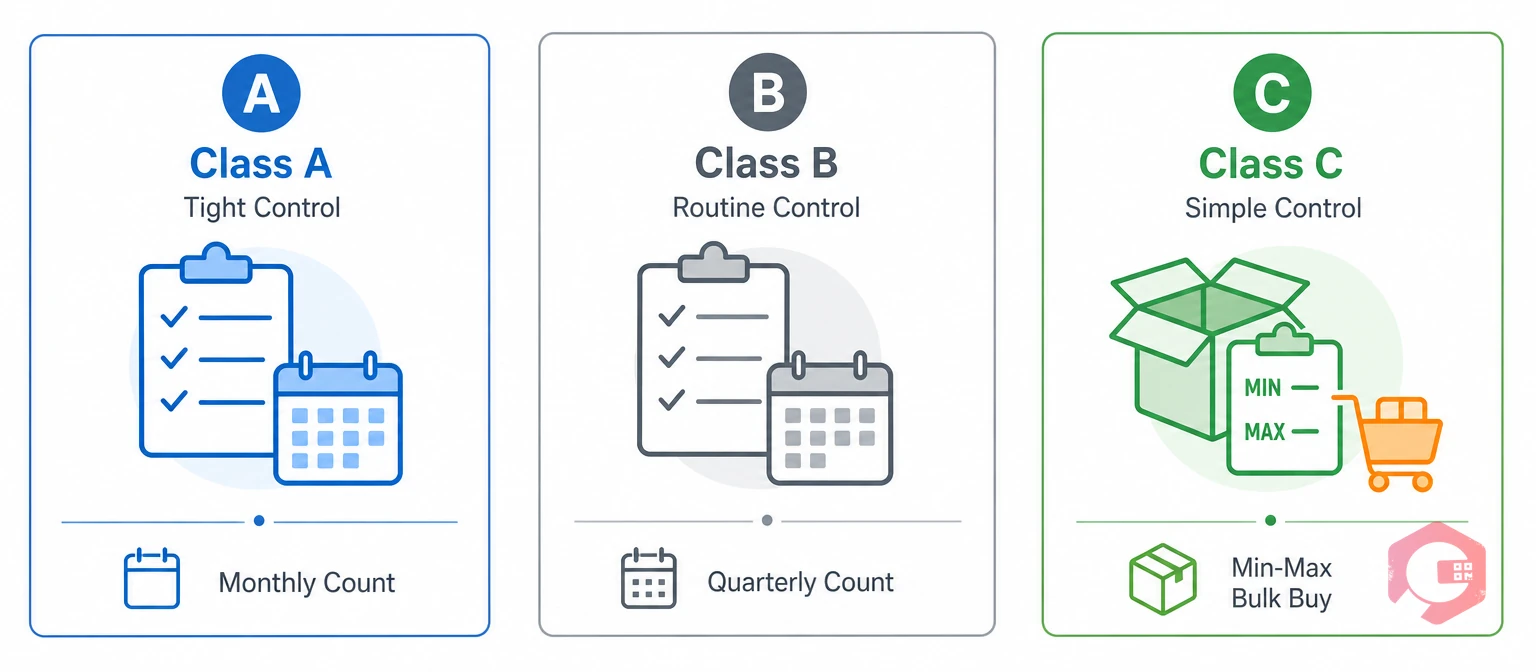
Set one control rule per class right after the review: tight for class A, routine for class B and simple for class C. This list is a common starting point.
Cryotos warehouse management maps storerooms, racks and bins, so the counts you plan for class A items match where the stock sits. Set minimum levels with low-stock alerts on the items that matter most.
SMRP publishes shared metric definitions for maintenance and reliability, which helps when you set inventory targets by class. A rule per class keeps counting effort in step with the money at risk.
Most maintenance teams make the same few mistakes with an ABC analysis report, and most come from treating it as a final answer. Avoid these six.
The total is also a clear view of the maintenance costs tied up in parts, so share it with finance each year. Rerun the report at least yearly and after major equipment changes, because fixing these mistakes costs little and makes every stocking decision more reliable.
A spreadsheet can produce an ABC analysis report, but a maintenance system removes the manual export and rebuild each time you want a fresh ranking. The table shows how the two handle the tasks that take the most time.
| Task | Spreadsheet | Cryotos ABC analysis report |
|---|---|---|
| Getting usage data | Export issues and costs, then clean them by hand | Reads issued quantities and costs from inventory records |
| Changing the period | Rebuild formulas and filters | Pick a new period and apply |
| Setting cutoffs | Edit formulas for the A, B and C limits | Edit the A and B thresholds (defaults 80 and 15) |
| Spotting problem items | Filter by hand for zero usage and missing costs | Non-moving and cost-missing items listed separately |
| Covering several sites | Separate tabs or files for each site | Site and store filters on one report |
| Sharing results | Email the file | Export to Excel or PDF with the filters shown |
A spreadsheet still works for a one-off audit of a small store. Once you run several sites or want a monthly review, a system report saves hours of cleanup.
Cryotos helps with ABC analysis by ranking your inventory by consumption value in one report and flagging the items that need review. The ABC analysis report draws on the issue history and costs already stored in spare parts inventory software, so the ranking reflects real stock movements.
Pair it with the 50+ reports and custom reports in the Cryotos report builder, so inventory and maintenance reporting live in one place.
Maintenance teams using Cryotos have reported up to 30% reduction in unplanned downtime and 25% faster repair turnaround. Having the right parts on the shelf is one of the levers behind faster repairs.
The ABC analysis report is an analysis view. It does not change item records, assign criticality or set reorder rules for you, so use it to decide the rules and then set them in your inventory settings.
It is a report that ranks inventory items by annual consumption value and assigns each one to class A, B or C. Class A items drive most of the spend, so they get the tightest control. The report tells you where to focus counting and ordering.
Check the scope first, then each class's share of items, value and stock. Study the chart shape, review items near the cutoffs, and finish with non-moving, cost-missing and new items. This order keeps you from acting on a misleading ranking.
Class A is usually 10-20% of items and 70-80% of value. Class B is about 30% of items and 15-25% of value, and class C is 50% or more of items and about 5% of value. Your own numbers will differ, so treat these as guides.
Run it at least once a year, and again after major equipment changes, new suppliers or a large shift in production. Many stores add a quarterly check on class A items. A fresh run catches parts that move between classes.
Class C ranks items that are used but have low value. Non-moving items have no use in the period, so they need a different decision: keep them as critical spares, return them or write them off.
No. The report ranks by value only. Pair it with a criticality rating such as VED, so a cheap but vital part still gets protected.
Clean inputs and a clear review turn an ABC analysis report into better stocking decisions. Schedule a free demo to see how Cryotos ranks your stock by consumption value and flags non-moving and cost-missing items.


Cryotos AI predicts failures, automates work orders, and simplifies maintenance—before problems slow you down.