
Acoustic emission monitoring is a non-destructive testing method that detects the high-frequency stress waves a material releases when it cracks, bends, or rubs under load. Sensors pick up these signals in the 20 kHz to 1 MHz range. That often means catching a fault before it shows up on a vibration reading at all.
For maintenance teams running a predictive maintenance program, that head start matters. Bearings, pressure vessels, pipelines, and structural parts all give off measurable signals long before they fail outright. This breaks down how acoustic emission monitoring works. It covers which faults it catches first, how it compares to vibration analysis and thermography, and how the data should turn into real work — not sit unused in a sensor dashboard.
Key Takeaways

Acoustic emission monitoring detects tiny stress waves. A material gives off these waves when it bends, cracks, or rubs at a contact point. An acoustic emission event is a short burst of energy from a small change inside a material. A crack tip moving forward is one trigger. A small leak at a seal is another. Sensors turn these waves into electrical signals that engineers can read.
The method sits inside the wider condition monitoring toolkit, next to vibration analysis and thermography. Groups like ASNT and the ISO 22096 standard set the rules for how non-destructive testing methods like this one get set up and read. Most plants pair acoustic emission monitoring with other checks. Few rely on it alone.

Acoustic emission monitoring works by mounting sensors near a part, then running checks to catch stress-wave "hits" as they happen. Each hit gets logged with details like strength, length, and energy. Together, these build a signature for the type of damage taking place.
Hit rate is the number of acoustic emission events over a set time period. A rising hit rate is often the first sign of a worsening fault. Placement matters more here than in vibration work. Signals lose strength fast as they move through a material.
Most plants place sensors near known stress points — weld seams, bearing housings, valve bodies. Many setups use several sensors at once. That helps teams find exactly where an event started.
Raw hits flow into a data acquisition unit, which filters out background noise and stores each event with a timestamp. Most setups then pair this with software that groups events into patterns over time. That pattern view is what turns thousands of raw hits into something a reliability engineer can actually act on.

Acoustic emission monitoring detects faults that cause friction, cracks, or fluid loss. It often catches these well before they show up as heat or vibration. Early bearing wear gives off a clear signal from surface friction long before vibration readings shift.
Most teams running a predictive maintenance program use acoustic emission monitoring as an early-warning layer for these exact faults. That matters most on assets where a failure carries safety or environmental risk.
Turning these alerts into real work is where most programs get stuck — see how IoT-based condition monitoring integration connects sensor data straight to work orders.
Acoustic emission monitoring, vibration analysis, and thermography each catch different faults at different stages. Most mature programs use more than one. Vibration analysis works best on rotating gear with wear patterns that have already formed. Acoustic emission monitoring tends to catch those same faults earlier.
Most plants don't pick just one of these methods. They layer acoustic emission monitoring, vibration analysis, and thermography based on the faults each key asset tends to develop.
Acoustic emission monitoring shows up most in fields where early crack or leak detection prevents safety incidents or costly downtime. Oil and gas, power generation, and heavy manufacturing make up most of the use cases.
Most plants in these fields don't roll out acoustic emission monitoring on every asset. They target it where a missed early fault carries the highest risk.
Most teams start small. They pick three or four critical assets — often the ones tied to safety cases or past failures — and run a pilot before any wider rollout. That keeps cost and setup time in check while the team builds skill at reading the data. A short pilot also gives the team real numbers to justify a wider budget later, instead of relying on a vendor's general claims.

Acoustic emission monitoring offers real gains over other condition monitoring methods. It also comes with limits that teams should plan around before a wider rollout.
Most plants treat these limits as planning points, not reasons to skip the method. They simply target acoustic emission monitoring at the assets where early detection pays off most.
Acoustic emission monitoring only pays off when an alert turns into scheduled, tracked work. Sensor data sitting in a separate dashboard doesn't stop a failure on its own. Condition-based maintenance is maintenance triggered by an asset's actual measured condition. It swaps a fixed calendar schedule for real data. Acoustic emission monitoring is one of the data sources that feeds it.
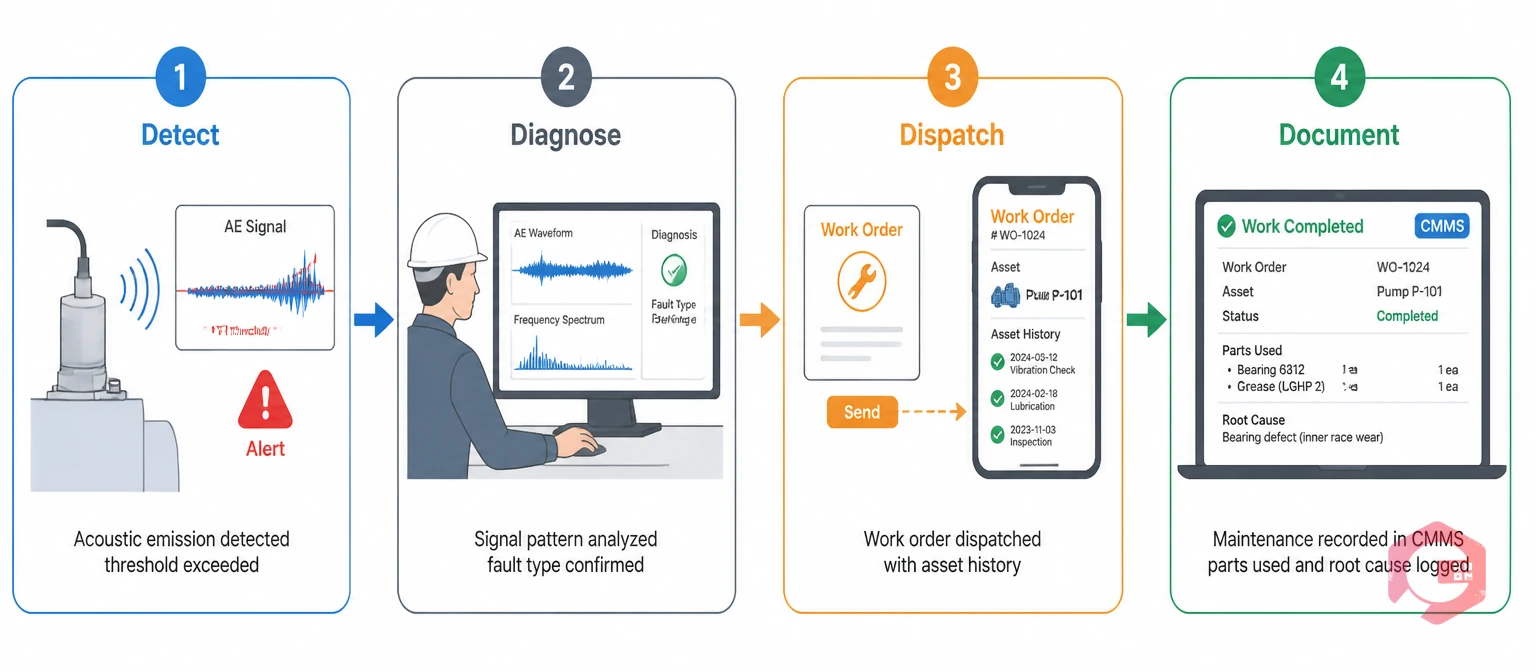
The Detect-Diagnose-Dispatch-Document Framework:
Maintenance teams using a Computerized Maintenance Management System to automate this handoff have reported up to 30% reduction in unplanned downtime and 25% faster repair turnaround. That gain mostly comes from alerts no longer sitting unactioned in a separate tool. Pairing acoustic emission data with enterprise asset management tools also keeps the full failure history attached to the asset for future reliability work.
Signal attenuation is the loss of acoustic emission signal strength as a wave moves through a material. Knowing how fast a given material loses signal strength is a big part of why sensor placement planning matters so much before a program goes live.
Ownership of an acoustic emission monitoring program usually sits with the reliability team, with maintenance picking up the resulting work orders. Most plants run a short weekly review where both groups check open alerts together. That habit keeps signal interpretation sharp and stops alerts from going stale in a queue.
Acoustic emission monitoring is used to catch cracking, leaks, bearing wear, and electrical insulation breakdown at their earliest stage. It works well as an early-warning layer inside a broader condition-based maintenance program.
It picks up the high-frequency stress waves released by friction, cracking, and fluid loss. These signals happen at the moment of small-scale damage, well before a fault grows large enough to shift vibration or temperature readings.
Acoustic emission monitoring detects stress waves from the damage itself. Vibration analysis measures the motion caused by a fault that has already grown. As a result, acoustic emission monitoring typically flags issues earlier, especially on slow-speed equipment.
Oil and gas, power generation, and heavy manufacturing use it most. These fields depend on it for pressure vessels, pipelines, and rotating gear, where a missed crack or leak carries real safety or downtime risk.
It usually costs more upfront than basic vibration monitoring because of the special sensors and signal processing involved. Most plants offset that cost by targeting a small set of high-risk assets instead of covering the whole site.
Yes. Acoustic emission sensors can feed alerts straight into a CMMS through IoT integration. That triggers a work order the moment a signal crosses a set threshold, instead of waiting for a scheduled check.
A small pilot on three or four critical assets usually takes a few weeks to set up and tune. Full plant-wide coverage takes longer, since teams need time to confirm sensor placement and build a baseline signal library for each asset type.
Acoustic emission monitoring gives maintenance teams an earlier, more reliable warning than almost any other condition monitoring method available today, but that warning only matters if it reaches the right technician in time. Schedule a free demo to see how Cryotos turns sensor alerts into tracked, accountable work orders.


Cryotos AI predicts failures, automates work orders, and simplifies maintenance—before problems slow you down.


