
Tracking MTBF (Mean Time Between Failures) and MTTR (Mean Time to Repair) for warehouse conveyor and sortation systems gives maintenance teams the quantified failure frequency and repair speed data they need to make evidence-based decisions about PM intervals, spare parts stocking, technician allocation, and capital replacement. Without these metrics tracked per system and per zone, conveyor maintenance runs on intuition — and intuition consistently underestimates failure frequency on high-utilisation sorter lines and overestimates it on lower-throughput accumulation conveyors. According to MHI research on material handling reliability, unplanned conveyor downtime in distribution centres costs an average of $5,000 to $15,000 per hour depending on throughput, making conveyor and sortation MTBF and MTTR the maintenance metrics most directly connected to operational cost in a warehouse environment.
This guide covers how to calculate MTBF and MTTR correctly for conveyor and sortation systems, what benchmarks to target, and how a CMMS generates these metrics automatically from work order data — so your maintenance team is working from numbers rather than feel.

Most warehouse assets fail independently — a forklift breakdown affects one truck, a dock leveller fault affects one bay. Conveyor and sortation systems are different: they are interdependent chains where a failure at any point stops the flow for everything downstream. A single induction belt fault on a crossbelt sorter can halt the entire sortation line within seconds. A jammed divert on a pop-up wheel sorter stops parcels queuing across multiple upstream zones simultaneously. The blast radius of a conveyor failure is always larger than the failed component itself.
This interdependency is why MTBF and MTTR have a different operational significance for conveyor systems than they do for most other assets. A forklift MTBF of 200 hours means one truck is out of service for a period. A sorter induction MTBF of 200 hours means the entire sortation line is at risk every 200 operating hours. A forklift MTTR of 4 hours means one truck is unavailable for a shift. A sorter MTTR of 4 hours means zero throughput on the sortation line for half a shift — with associated despatch delays, SLA breaches, and labour cost for operatives who can't work productively while the system is down.
Sorter line utilisation compounds the urgency. A crossbelt sorter or shoe sorter in a high-throughput distribution centre may run 20 to 22 hours per day across two or three shifts. At that utilisation rate, a system with an MTBF of 500 operating hours experiences a failure every 3 to 4 weeks. If nobody is tracking MTBF, that failure frequency feels like bad luck. If the MTBF is tracked and trended, a declining MTBF from 500 to 350 to 200 hours over six months tells the maintenance manager that the system is degrading — and that intervention is needed before the MTBF drops further and failures become weekly events during peak season.
MTTR is equally important. The difference between a 45-minute MTTR and a 3-hour MTTR on the same sorter failure mode is often spare parts availability and technician familiarity. A maintenance team that tracks MTTR by failure mode knows which faults take longest to resolve — and can address the root cause: pre-staging spare parts in a trackside cabinet, building a fault code-to-procedure guide in the CMMS knowledge base, or training additional technicians on the most time-consuming repair procedures. MTTR improvement on high-frequency failure modes is the highest-leverage maintenance investment available on a conveyor system.
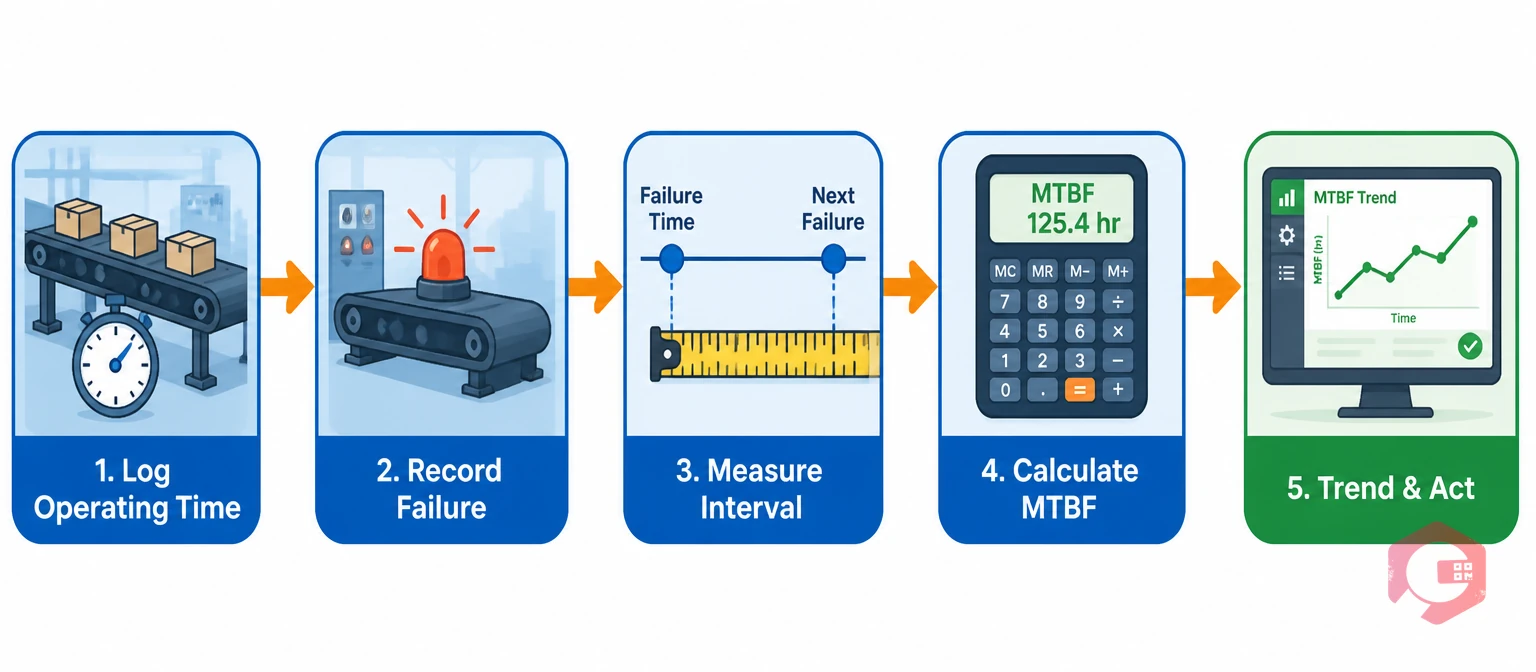
MTBF is the average time a system operates between unplanned failures. The formula is: MTBF = Total Operating Time ÷ Number of Failures. For a conveyor system, total operating time is the system's actual run time — not calendar time, and not scheduled downtime for PMs or planned maintenance windows.
Getting the denominator right is where most warehouse operations go wrong. A conveyor that runs 20 hours per day, 6 days per week accumulates 120 operating hours per week. If you calculate MTBF against calendar hours (168 hours per week), you systematically understate the MTBF and make the system look less reliable than it is. If you calculate against scheduled shift hours without subtracting planned maintenance windows, you inflate the MTBF and miss the true failure frequency. The correct base is actual operating hours — which the CMMS captures either from system uptime logs (if the conveyor is connected via IoT telemetry) or from shift log entries that record start time, planned stops, and unplanned downtime events.
For conveyor and sortation systems, calculate MTBF at three levels. First, the system level: total sortation line or conveyor loop MTBF, which tells you how often the overall system experiences a failure requiring intervention. Second, the subsystem level: MTBF by major component category — induction units, divert mechanisms, drive units, belt/chain systems, control systems. Subsystem MTBF identifies which component category is dragging the system MTBF down. Third, the asset level: MTBF for individual high-criticality assets — the primary induction belt, the lead crossbelt carriage string, the main conveyor drive unit. Asset-level MTBF identifies specific pieces of equipment that need attention before they pull down the subsystem and system-level metrics.
Track MTBF over rolling 90-day and 12-month windows. A single failure data point is not statistically meaningful — it takes 10 or more failure events to produce a stable MTBF estimate on any individual asset. Rolling windows smooth out seasonal variation and show the trend: is MTBF stable, improving, or declining? A declining trend always precedes a reliability crisis — catching it early gives you the lead time to intervene before the crisis arrives. Cryotos's BI Dashboard surfaces MTBF trends by asset and system across configurable date ranges, with the underlying work order data available for drill-down when a trend warrants investigation.
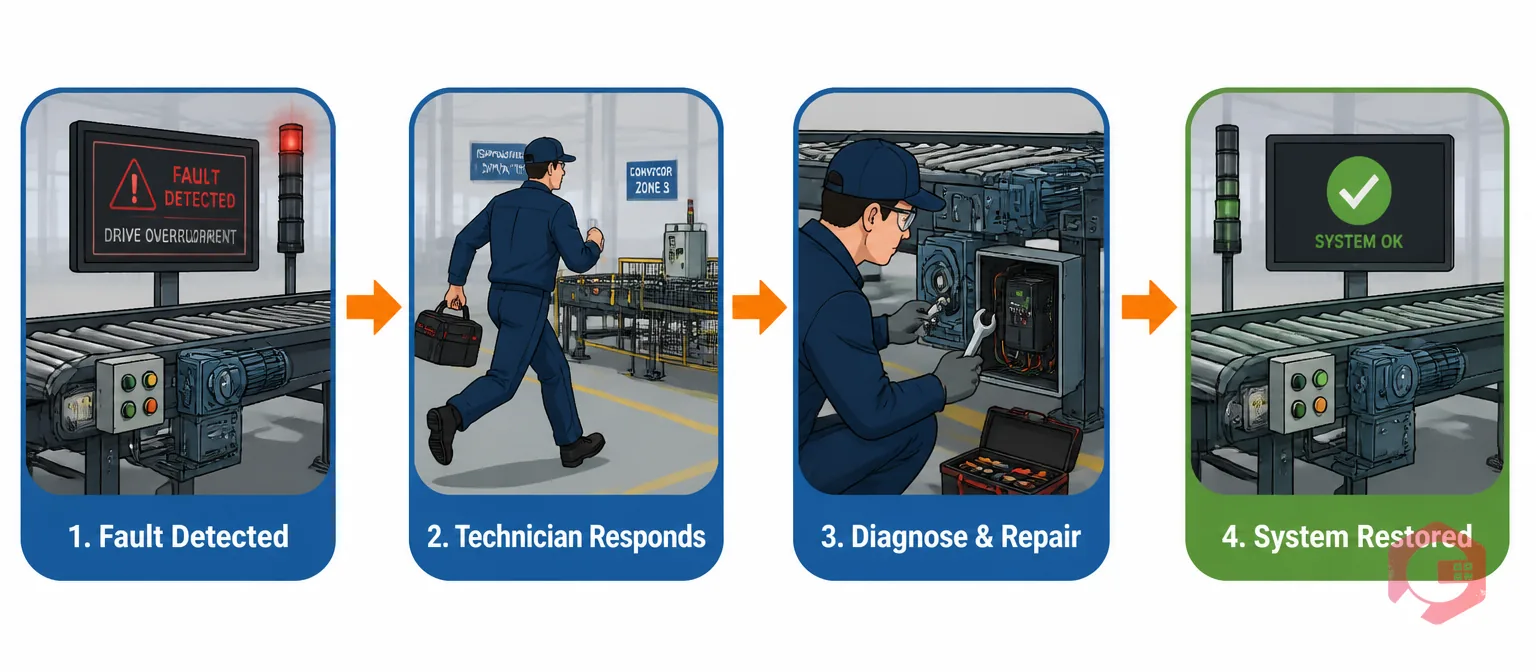
MTTR is the average time from failure detection to system restoration. The formula is: MTTR = Total Repair Time ÷ Number of Repairs. For conveyor systems, total repair time for each event runs from the moment the failure is detected (the system stops, or an alert fires) to the moment the system is back in service and throughput has resumed.
Three time segments make up MTTR for a conveyor failure: response time (from detection to a technician reaching the fault location), diagnostic time (from arrival to identifying the root cause), and active repair time (from diagnosis to system restoration). Understanding which segment dominates your MTTR is the starting point for reducing it. If your MTTR is dominated by response time — technicians are hard to locate, or the failed zone is at the far end of a large warehouse — the intervention is better on-call coverage or zone-based technician assignment. If diagnostic time dominates — technicians are spending 40 minutes identifying a fault code that an experienced technician resolves in 5 — the intervention is knowledge base development and fault code-to-procedure guides in the CMMS. If active repair time dominates — the right parts aren't on site and have to be sourced or the repair procedure requires two technicians — the intervention is parts pre-staging and procedure standardisation.
What does not go into MTTR for calculation purposes: planned maintenance time (scheduled PMs are not repair events), time the system was already idle before the failure was detected (if a fault develops during a non-operating window), or time spent on administrative tasks outside the repair window (completing paperwork, submitting purchase orders). The clock runs from detection to restoration. Consistency in how this boundary is defined matters more than the precise definition — as long as the same boundary applies to every repair event recorded in the CMMS, the MTTR trend data is comparable and actionable.
Cryotos's work order management module captures the timestamps needed to calculate MTTR automatically: work order creation time (detection), technician check-in time (response complete), and work order closure time (restoration confirmed). The MTTR calculation runs from these timestamps without manual calculation — and the result is available in the BI Dashboard alongside MTBF data for the same system, giving maintenance managers both metrics in context rather than as separate calculations.
Benchmark MTBF and MTTR values for conveyor and sortation systems vary significantly by system type, age, utilisation intensity, and PM program maturity. The figures below represent achievable targets for well-maintained systems in distribution centres with structured PM programs — not theoretical maximums. Use these as directional reference points rather than absolute targets, and adjust based on your specific equipment age, manufacturer, and operating environment.
| System Type | Typical MTBF Target (operating hours) | Typical MTTR Target | Primary Failure Modes |
|---|---|---|---|
| Belt conveyor (flat, standard speed) | 600–1,000 hrs | 20–45 min | Belt tracking drift, drive bearing wear, belt splice failure |
| Crossbelt sorter (carriage string) | 400–700 hrs | 30–60 min | Carriage belt failure, drive wheel wear, communication fault |
| Shoe sorter / sliding shoe | 500–900 hrs | 20–45 min | Shoe breakage, slat wear, divert controller fault |
| Pop-up wheel / transfer | 300–600 hrs | 15–30 min | Wheel wear, pneumatic actuator failure, sensor fault |
| Spiral conveyor / vertical | 800–1,500 hrs | 45–90 min | Chain stretch, drive unit bearing, guide rail wear |
| Scan tunnel / induction unit | 500–1,000 hrs | 20–40 min | Belt jam, scanner misread accumulation, photoeye fault |
The manual alternative to CMMS-generated MTBF and MTTR is a maintenance log spreadsheet where technicians record failure times, restoration times, and failure descriptions — then a maintenance engineer manually calculates MTBF and MTTR from the log. This approach fails in two consistent ways: the data is incomplete (technicians don't always update the log, especially under operational pressure), and the calculation lag means the metrics are always historical snapshots rather than live operational data.
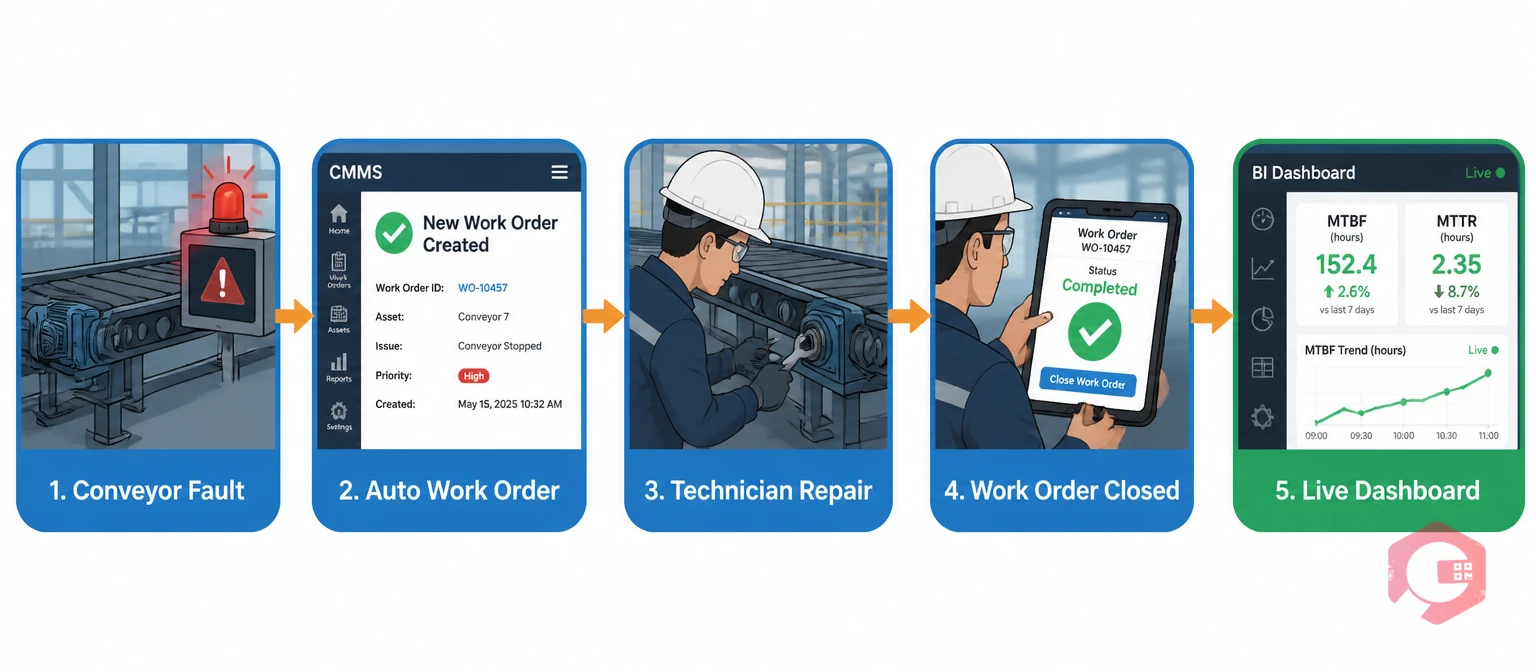
A CMMS generates MTBF and MTTR from work order data automatically because every failure event that requires maintenance intervention creates a work order — and every work order carries the timestamps that define the metric calculation boundaries. In Cryotos, the work order for a conveyor failure captures: the asset ID (specific conveyor zone or system), the failure time (work order creation timestamp), the technician assignment time, the on-site arrival time, the restoration time (work order closure), and the failure description and root cause. These data points are sufficient to calculate both MTBF (operating hours between work order creation events on the same asset) and MTTR (elapsed time between work order creation and closure) without any additional data entry by the maintenance team.
The BI Dashboard presents these calculations as live KPIs — updated with every work order closure — and allows the maintenance manager to segment by asset, system zone, failure mode, technician, and time period. A maintenance manager reviewing MTBF and MTTR for the sortation line can see in one screen: which zones have the lowest MTBF (highest failure frequency), which failure modes have the highest MTTR (longest repair times), which technicians resolve faults fastest and which may need additional training or knowledge support, and how all three metrics have trended over the last 90 days versus the equivalent period last year.
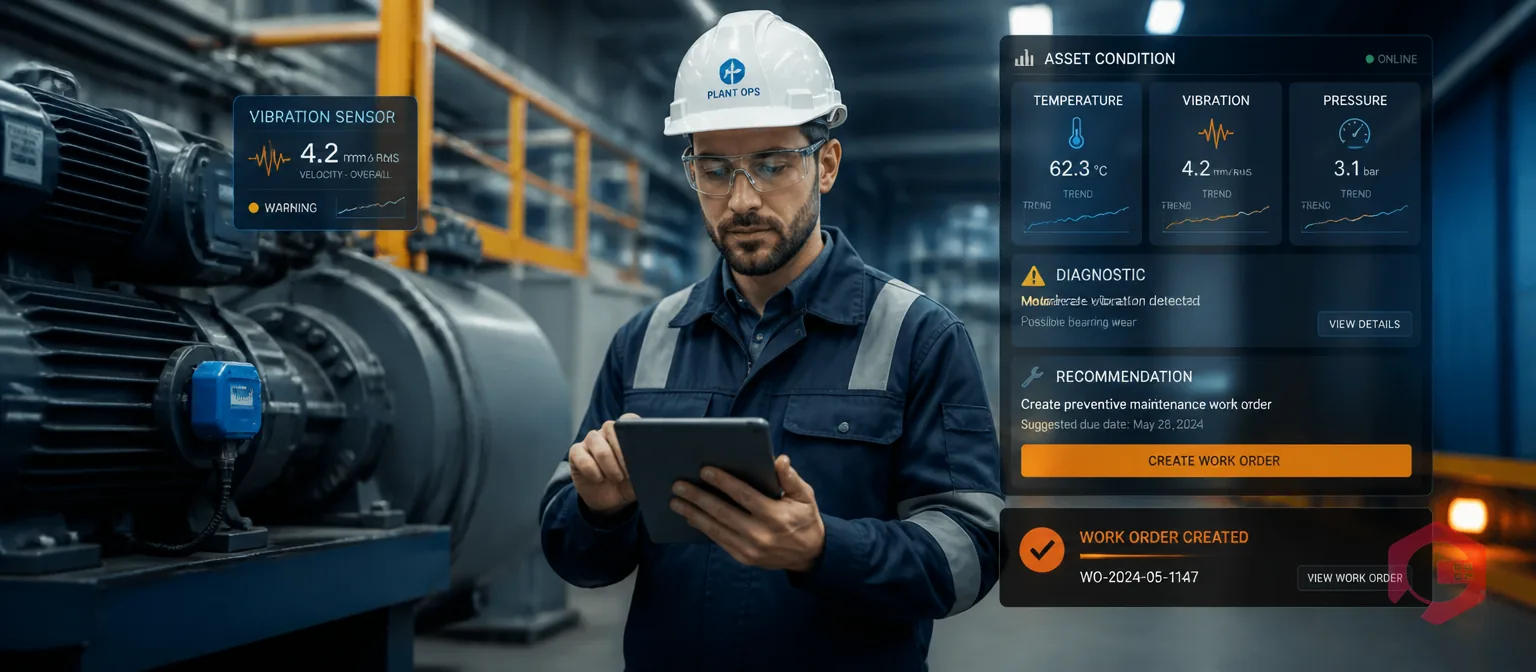
For conveyor systems with IoT telemetry connected via Cryotos's IoT meter reading module, the MTBF calculation incorporates actual system uptime data rather than relying solely on manual work order timestamps. When the system reports a fault condition to the CMMS directly — rather than waiting for an operator to notice and raise a work order — the detection-to-response gap in MTTR is measured accurately, including any delay between fault occurrence and human detection. This is particularly valuable on high-speed sorter lines where a fault can accumulate for several minutes before an operator notices and calls maintenance.
Asset-level MTBF and MTTR data also feeds spare parts decisions. If the CMMS shows that pop-up wheel transfers on Zone 3 have an MTBF of 280 operating hours and an MTTR of 35 minutes, the maintenance planner knows that the primary MTTR driver is wheel replacement — and can pre-stage replacement wheel sets in the trackside spares cabinet rather than sourcing them from central stores each time. The spare parts inventory module connects parts consumption from each corrective work order to the asset record, building the parts-per-failure data that informs pre-staging decisions without manual analysis.

MTBF and MTTR only generate value when they drive decisions. Tracking the metrics without acting on what they reveal produces a CMMS full of interesting data and a conveyor system that fails at the same rate it always did. Here's how maintenance teams translate MTBF and MTTR data into specific maintenance program changes on conveyor and sortation systems.
Declining MTBF on a specific asset → adjust PM interval. If a crossbelt carriage string has an MTBF that was 600 hours 12 months ago and is now 350 hours, something has changed: the system is running harder, it's aging beyond the point where current PM intervals are adequate, or a recent modification has introduced new wear patterns. Pull the work order history to identify the failure mode driving the declining MTBF. If bearing wear on the drive wheels is the dominant failure, reduce the bearing inspection interval in the preventive maintenance schedule. If belt wear is driving failures, add a belt condition check to the quarterly service checklist. The PM interval is not set in stone — it responds to what the MTBF data shows about actual wear rates.
High MTTR on a specific failure mode → build knowledge base content. If photoeye fault resolution on the scan tunnel consistently takes 50 minutes while other scan tunnel faults resolve in 15 minutes, the MTTR difference reflects either parts availability or technician knowledge. Review the work orders for photoeye faults: are technicians spending time on diagnosis that an experienced technician resolves immediately? If so, build a fault code-to-procedure article in the Cryotos knowledge base specifically for that fault mode — the diagnostic steps, the replacement procedure, and the parts required. The next technician who encounters the fault opens the knowledge article rather than working through diagnostics from first principles.
System MTBF below throughput-safe threshold → prioritise for capital review. If a sortation system's MTBF falls below the point where unplanned failures are occurring more than once per week during peak season, the reactive maintenance cost and SLA exposure is accumulating faster than a capital upgrade would cost. MTBF data from the CMMS provides the evidence base for that capital case: "this system has experienced 28 unplanned failures in the last 12 months with an average MTTR of 55 minutes, representing 25.7 hours of sorter downtime at a throughput cost of approximately £180,000. A refurbishment program estimated at £120,000 would address the primary failure modes and is projected to restore MTBF to 600+ hours based on the failure mode distribution in our work order history." That argument, backed by real CMMS data, is materially more persuasive to leadership than "the sorter breaks down a lot."
Maintenance teams using Cryotos report a 30% reduction in downtime and 25% faster repair times — on conveyor and sortation systems, both outcomes are direct consequences of tracking MTBF and MTTR at asset level and acting on what the data shows. The IoT sensor deployment validation checklist gives teams a structured framework for connecting conveyor system telemetry to the CMMS, ensuring the uptime data that underpins accurate MTBF calculation is captured reliably from go-live.
If your conveyor and sortation maintenance program is running on failure memory and intuition rather than tracked MTBF and MTTR data, Cryotos CMMS gives you the work order engine, asset-level reporting, and BI Dashboard to calculate and trend both metrics automatically — without spreadsheets, without manual calculation, and without waiting for a failure crisis to make the data case for maintenance investment. Book a demo at cryotos.com to see how MTBF and MTTR reporting works for conveyor and sortation systems in the Cryotos BI Dashboard.
MTBF (Mean Time Between Failures) measures how frequently a conveyor or sortation system experiences an unplanned failure — calculated as total operating time divided by the number of failures over a given period. A higher MTBF means fewer failures per operating hour, indicating a more reliable system. MTTR (Mean Time to Repair) measures how quickly the maintenance team restores the system after a failure — calculated as total repair time divided by the number of repair events. A lower MTTR means faster recovery. For conveyor systems, both metrics matter: MTBF determines how often you lose throughput capacity, and MTTR determines how long you lose it each time. Managing both together gives the complete picture of conveyor reliability impact on operations.
A CMMS calculates MTBF and MTTR from work order timestamps captured automatically when maintenance events occur. When a conveyor failure is reported, a work order is created with a timestamp (failure detection time). When a technician arrives and restores the system, the work order closes with a restoration timestamp. The CMMS calculates MTTR as the elapsed time between creation and closure. MTBF is calculated from the operating time between consecutive failure work orders on the same asset, adjusted for planned downtime. In Cryotos, both metrics appear in the BI Dashboard as live KPIs updated with every work order closure — no manual calculation required and no lag between the repair event and the updated metric.
A well-maintained crossbelt or shoe sorter in a distribution centre with a structured PM program should achieve an MTBF of 400 to 900 operating hours depending on system type, age, and utilisation intensity. Pop-up wheel transfers and divert mechanisms typically achieve 300 to 600 hours MTBF due to their higher cycle rates. Standard belt conveyors at moderate utilisation typically achieve 600 to 1,000 hours. Systems below these ranges have either a maintenance program gap (PM intervals too long, PM tasks incomplete, wrong parts pre-staged) or a capital condition issue where component wear has reached the point where PM alone can't sustain reliability. Use 12-month rolling MTBF trends to distinguish between a temporary dip and a sustained decline that signals a systemic problem.
MTTR for conveyor failures breaks down into three components: response time (detection to technician on site), diagnostic time (arrival to fault identification), and active repair time (diagnosis to system restoration). To reduce each: improve response time by assigning zone-based technicians during high-throughput shifts rather than relying on a central maintenance team to travel across a large facility. Reduce diagnostic time by building fault code-to-procedure guides in the CMMS knowledge base so technicians retrieve the correct procedure immediately rather than diagnosing from first principles. Reduce active repair time by pre-staging the parts most commonly consumed in high-frequency failure modes in trackside spares cabinets — eliminating the time spent retrieving parts from central stores during a live failure event.
Both — and they answer different questions. System-level MTBF tells you how often the overall conveyor or sortation line experiences any failure requiring maintenance intervention, which is the metric most directly relevant to throughput planning and SLA risk assessment. Zone-level or asset-level MTBF tells you which specific areas of the system are generating the most failures and dragging the system MTBF down. A system-level MTBF of 350 hours with a Zone 3 pop-up transfer MTBF of 120 hours tells you exactly where the reliability investment should be focused — you don't need to improve the whole system, you need to fix Zone 3. Both levels of analysis are available in the Cryotos BI Dashboard through asset-level MTBF reporting across the conveyor system asset register.

Cryotos AI predicts failures, automates work orders, and simplifies maintenance—before problems slow you down.


