
Asset criticality analysis is a structured method for ranking equipment based on the consequences of failure — so maintenance resources, budgets, and inspection intervals are allocated where they produce the most value, not spread equally across assets that are nowhere near equal in importance. According to Plant Engineering benchmarking research, organisations that rank assets by criticality and align maintenance strategies to those rankings consistently outperform peers on equipment uptime, maintenance cost per asset, and regulatory compliance. Without a criticality framework, every pump, conveyor, and HVAC unit on your asset register competes for the same attention — and the assets that matter most rarely win.
This guide explains how asset criticality analysis works, how to build a practical scoring framework, and how your CMMS can operationalise criticality rankings so they drive real maintenance decisions — not just spreadsheets.
Key Takeaways
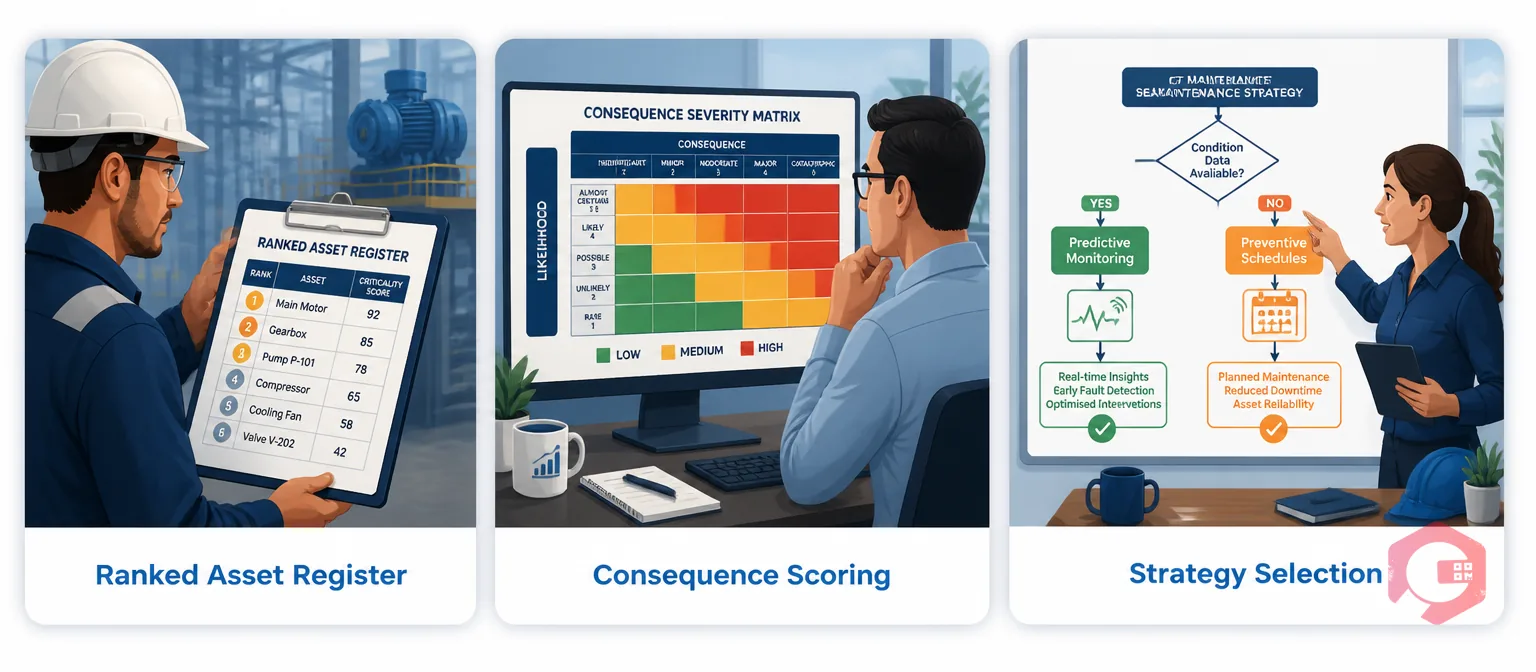
Asset criticality analysis is the process of evaluating every maintainable asset in your facility against a defined set of consequence criteria, assigning each asset a numerical criticality score, and grouping assets into tiers that determine which maintenance strategy — predictive, preventive, or run-to-failure — they receive.
The output is not a list of your most expensive assets, your oldest assets, or your most frequently repaired assets. It is a ranked register that answers a single question: if this asset fails right now, how bad is it? A packaging line motor that fails on a Saturday might cost $200 in parts and four hours of downtime. A cooling system failure in a pharmaceutical cold room on the same Saturday could cause product loss worth $2 million and a regulatory investigation. Asset criticality analysis makes that difference explicit and systematic.
These two terms are often used interchangeably in maintenance conversations, but they measure different things. Criticality is a property of the asset — determined by the potential consequences of its failure, regardless of when that failure might occur. Priority is a property of a work order — determined by urgency, available resources, and business context at a specific moment in time.
A high-criticality asset that is working perfectly today has no urgent work order. A low-criticality asset with a leaking bearing might generate a high-priority work order because it is creating a safety hazard right now. Understanding the distinction prevents two common errors: under-resourcing a critical asset that is currently running fine, and overreacting to failures on non-critical assets that could safely run to failure. Good asset lifecycle management depends on getting this right from the start.
Most facilities that run without a formal criticality framework default to one of two equally expensive patterns. The first is reactive maintenance everywhere — waiting for failures and paying the premium in emergency parts, overtime labour, and production losses. The second is uniform preventive maintenance everywhere — applying the same PM intervals to assets regardless of their consequence profile, which means over-maintaining low-consequence equipment while still being caught off guard by failures on the assets that matter most.
Both patterns waste resources. The Society for Maintenance and Reliability Professionals (SMRP) consistently reports that organisations without structured asset prioritisation spend 15–25% more on maintenance per equivalent asset base than those using a criticality-driven approach — because without rankings, effort is distributed by noise (whoever complains loudest) rather than value.
The fix is not more maintenance. It is smarter allocation: concentrate your predictive monitoring, your shortest PM intervals, and your most skilled technicians on the 10–20% of assets that genuinely warrant that investment. Criticality analysis gives you the ranked list that makes that concentration defensible and data-driven.
Use the failure rate calculator to establish baseline failure rates per asset before you begin scoring — it gives you the probability input your criticality framework needs to be accurate rather than assumed.
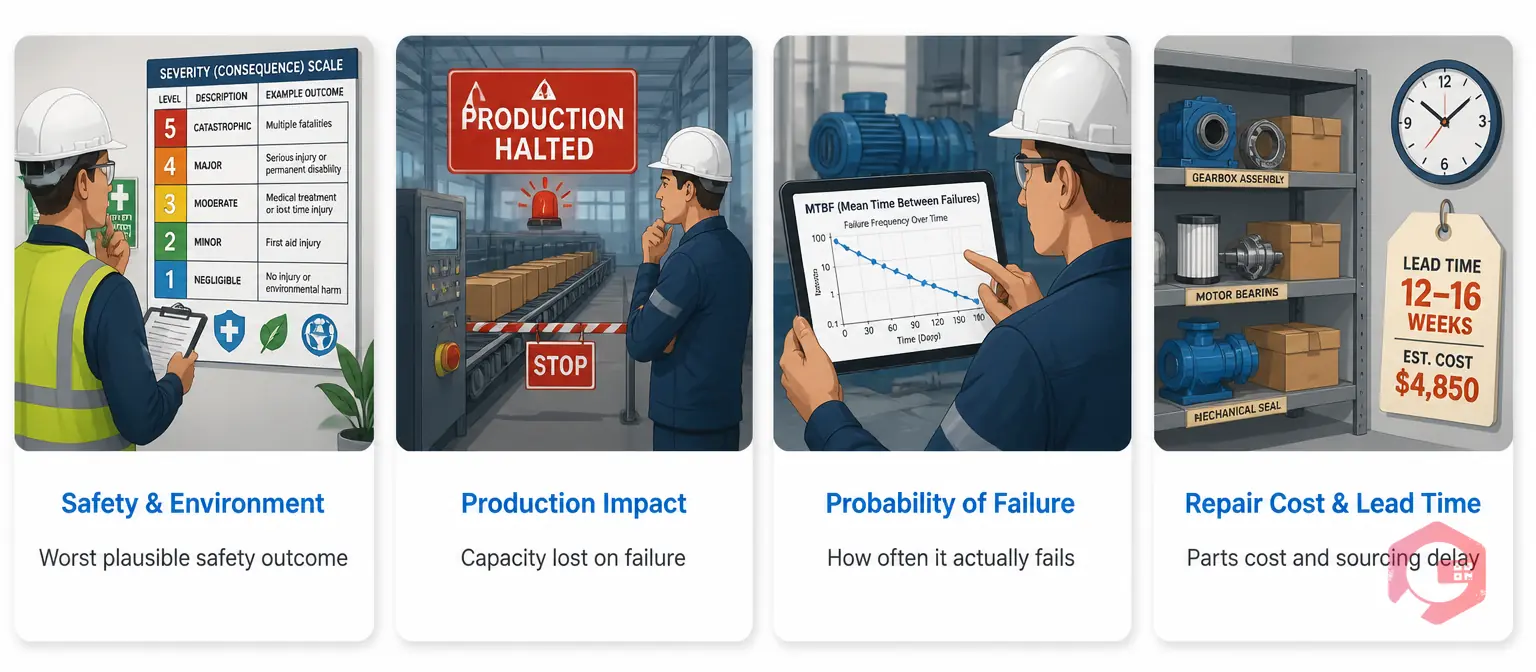
A robust criticality score combines multiple consequence dimensions into a single number. The specific weighting varies by industry and organisation, but four factors appear in virtually every mature criticality framework.
This factor asks: if this asset fails completely, what is the worst plausible safety or environmental outcome? Score this on a 1–5 scale: 1 = no safety impact, 2 = minor injury risk, 3 = recordable injury potential, 4 = major injury or environmental release, 5 = fatality or catastrophic regulatory event. This factor typically carries the highest weighting in the composite score, because safety and regulatory consequences are non-negotiable.
This factor measures how much of your operational capacity fails when the asset fails. Score it: 1 = no production impact (redundant asset), 2 = minor disruption in one area, 3 = significant production reduction, 4 = line or facility shutdown, 5 = plant-wide or multi-site impact. Assets with backup units or bypass routes score lower here, which is why redundancy information is essential input to any criticality assessment.
Unlike the other three factors, which measure consequence, this factor measures likelihood. It is informed by historical failure data, age, operating environment, and manufacturer mean time between failures (MTBF) data. Score it: 1 = very rarely fails (MTBF > 5 years), 2 = occasionally fails, 3 = fails every 1–2 years, 4 = fails multiple times per year, 5 = chronically unreliable. This factor allows two assets with identical consequence profiles to be ranked differently if one fails once a decade and the other fails monthly.
This factor captures both the direct cost of repair and the lead time for parts or specialist labour. An asset with a five-day parts lead time in a just-in-time manufacturing environment scores higher than one where a spare is held in stock on-site. Score it: 1 = cheap parts, on-site spares, short repair time; 5 = expensive specialist parts, long lead time, extended downtime while waiting.
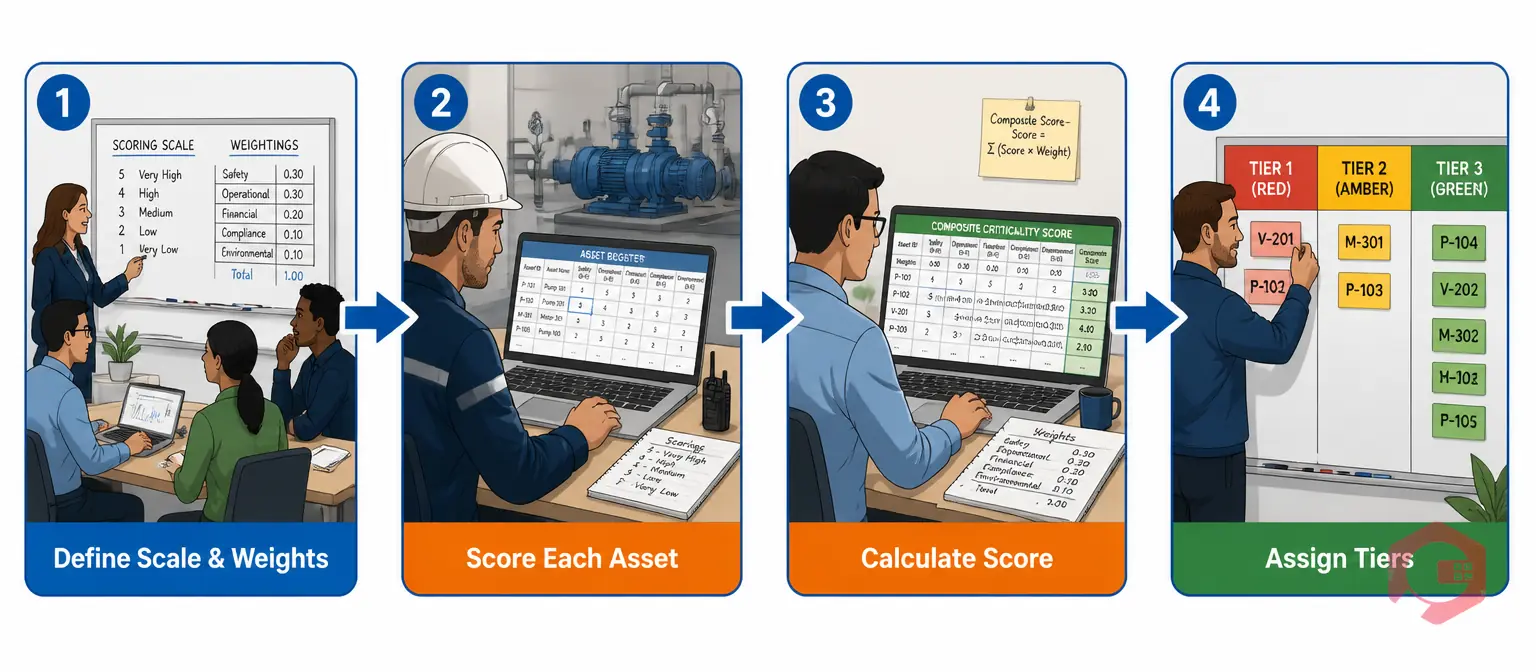
The process of running a criticality assessment for the first time is a structured workshop exercise. Here is the four-step approach that reliability engineers and maintenance managers use in practice.
Before scoring a single asset, your team needs to agree on what each score level means for each factor, and how much each factor weighs in the final composite. A common starting weighting is: safety (35%), production impact (30%), probability of failure (20%), repair cost/lead time (15%). Adjust these to reflect your organisation's risk priorities — a pharmaceutical manufacturer puts more weight on safety and regulatory consequence than a non-regulated warehouse operator.
Work through your asset register systematically, scoring each asset on all four factors. Include operators, maintenance technicians, and process engineers in this exercise — the production team knows which assets the floor cannot live without, and the maintenance team knows which assets are chronically unreliable. Scoring without cross-functional input leads to a criticality register that looks right on paper but misses operational reality.
For each asset, multiply each factor score by its weighting and sum the results. For example: an asset scoring Safety=4, Production=4, Probability=3, Cost=2 with weightings of 35/30/20/15 produces: (4×0.35) + (4×0.30) + (3×0.20) + (2×0.15) = 1.40 + 1.20 + 0.60 + 0.30 = 3.50. A score range of 1.00–5.00 lets you rank every asset in the register against every other asset with a consistent, auditable formula.
Once every asset has a composite score, group them into tiers. A three-tier model is the most practical for most facilities: Tier 1 Critical (score ≥ 3.5), Tier 2 Important (score 2.0–3.49), Tier 3 Non-Critical (score below 2.0). In most facilities, 15–25% of assets fall in Tier 1, 40–50% in Tier 2, and the remainder in Tier 3. If more than 35% of your assets score as Tier 1, your scoring criteria are too broad — revisit your scale definitions before proceeding.
Asset criticality and asset risk are related but distinct concepts, and confusing them leads to maintenance strategies that either over-invest in likely-but-low-consequence failures or ignore rare-but-catastrophic ones. The table below maps the key differences across the dimensions that matter most for maintenance planning.
| Dimension | Asset Criticality | Asset Risk |
|---|---|---|
| Core question | How bad is failure if it happens? | How likely is failure, and how bad? |
| Primary inputs | Safety consequence, production impact, repair cost | Consequence × probability of failure |
| Output metric | Criticality score or tier (e.g. Tier 1–3) | Risk Priority Number (RPN) or risk matrix position |
| Best used for | Initial asset triage and maintenance strategy selection | Ongoing maintenance optimisation and budget allocation |
| Limitation | Treats all assets as equally likely to fail — ignores reliability differences | Requires failure rate data that new assets may not yet have |
| When to use | First pass, new facility, or limited historical data | Mature maintenance program with 2+ years of failure history |
In practice, the best maintenance programs use both: criticality analysis to establish the initial strategy tier for each asset, and risk analysis to refine PM intervals and monitoring intensity as failure history accumulates. The ISO 55001 asset management standard recommends using both consequence and likelihood in any structured approach to asset risk.
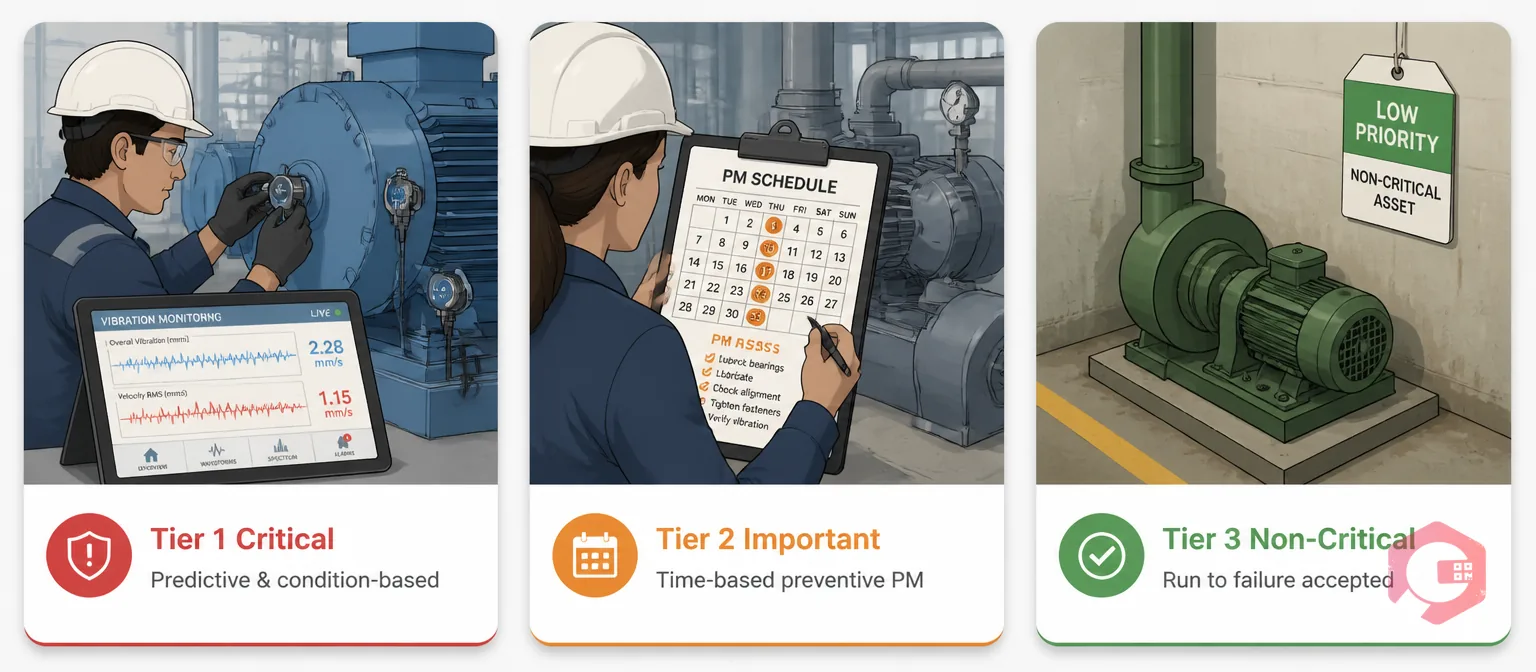
The whole point of a criticality ranking is to justify different maintenance strategies for different assets — not to create paperwork. Each tier maps to a distinct approach that balances investment against consequence.
Tier 1 (Critical): Predictive and Condition-Based Maintenance. These assets cannot afford unplanned failure. The appropriate strategy is continuous or periodic condition monitoring — vibration analysis, thermography, oil analysis, or IoT sensor feeds — combined with short PM intervals. Condition-based maintenance on Tier 1 assets means you act on data signals before failure occurs, not on calendar dates that may or may not align with actual degradation. When sensors detect a developing fault, Cryotos generates a corrective work order automatically — so the window between detection and action is measured in hours, not weeks.
Tier 2 (Important): Time-Based Preventive Maintenance. These assets have meaningful consequence if they fail, but the consequences are manageable and often recoverable. Time-based PM on a defined schedule — driven by operating hours, calendar intervals, or production volume — is the right fit. The PM intervals should be informed by MTBF data and reviewed annually as failure history accumulates.
Tier 3 (Non-Critical): Run-to-Failure or Extended PM Intervals. These assets have redundancy, low consequence of failure, or both. Allowing them to run until they fail is a legitimate and cost-effective strategy — provided the failure consequences are genuinely low and spare parts are stocked for fast replacement. Spending preventive maintenance effort on Tier 3 assets is the most common form of maintenance budget waste in facilities without a criticality framework.
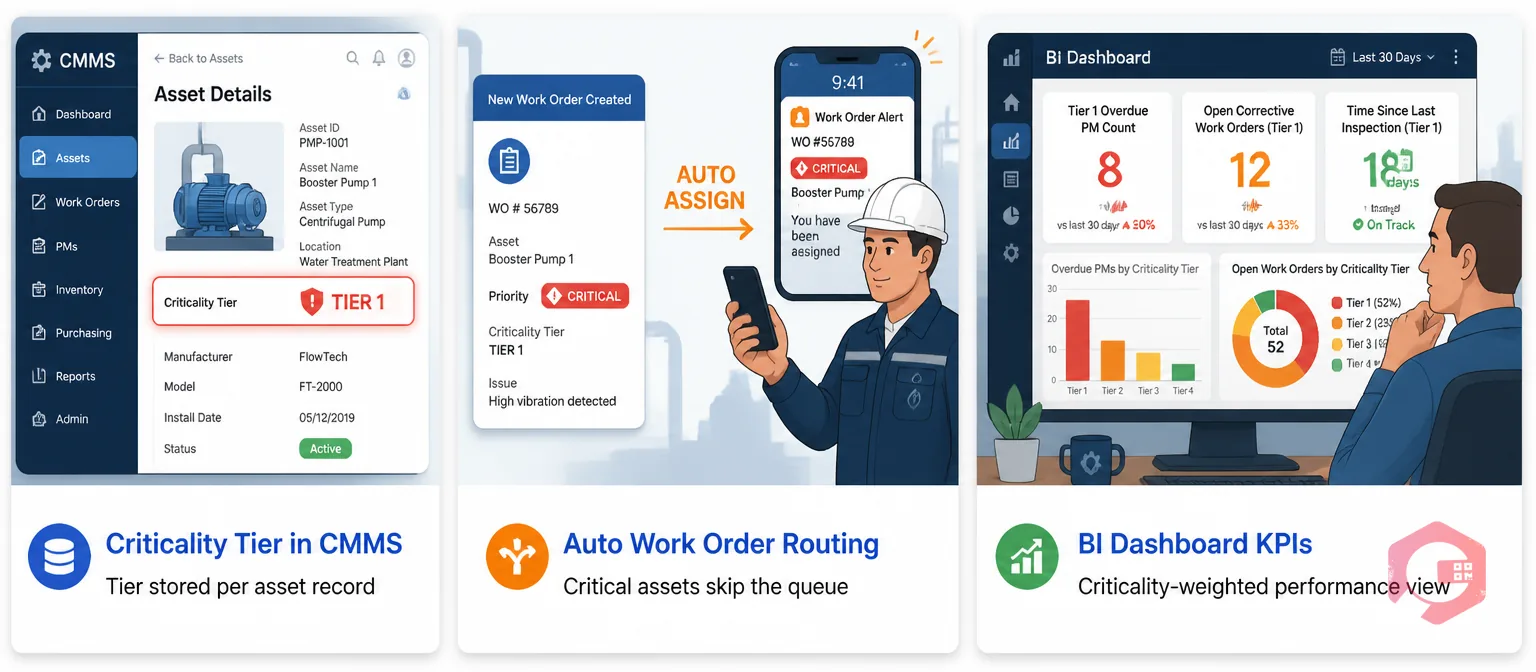
A criticality score sitting in a spreadsheet changes nothing. The value of a criticality assessment is realised when those rankings are embedded in a system that acts on them — generating the right work orders, routing them to the right technicians, and surfacing the right data when an asset fails.
Cryotos asset maintenance management software allows you to store a criticality tier against every asset record, so the CMMS uses that tier to set default work order priorities, PM intervals, and escalation rules. When a Tier 1 asset raises a fault, the work order automatically receives a critical priority tag and routes to the on-call engineer — no manual triage required. When a Tier 3 asset raises the same fault, it joins the standard queue.
The asset tracking module gives every asset a unique record containing its criticality tier, maintenance history, open work orders, and sensor data feeds — so a maintenance manager can pull up any asset and immediately understand its consequence profile, recent failure history, and current inspection status in a single screen. The BI Dashboard surfaces criticality-weighted KPIs: which Tier 1 assets are approaching their PM due date, which have open corrective work orders, and which have the longest time since their last inspection.
For organisations looking to move beyond basic PM scheduling into a full asset strategy framework, Cryotos also supports integration with EAM software workflows — connecting criticality rankings, lifecycle costing, and capital replacement decisions in a single data environment. Maintenance teams using Cryotos report a 30% reduction in unplanned downtime, with criticality-driven PM scheduling cited as a primary contributing factor.
Asset criticality analysis establishes which equipment has the most severe consequences if it fails, so maintenance resources — budget, technician time, monitoring technology — can be concentrated on the assets that genuinely warrant them. The goal is not to rank every asset the same, but to create a defensible, data-driven basis for treating different assets differently. Without a criticality framework, maintenance budgets are allocated by habit, noise, or whoever pushes hardest — none of which aligns effort with business risk.
Three tiers (Critical, Important, Non-Critical) is the most practical model for most industrial and facility environments. It is specific enough to drive meaningfully different maintenance strategies for each tier, and simple enough to sustain as your asset base changes. Some reliability-focused industries use four or five tiers, but the additional granularity only helps if you have the data quality and maintenance maturity to implement distinct strategies for each level — most organisations do not. Start with three, validate it over 12 months of PM data, and add a tier only if you find the boundaries between existing tiers are causing systematic misjudgements.
A full reassessment of your criticality register should happen annually as a minimum, and whenever a major change occurs — a process modification that changes consequence profiles, the addition of redundant equipment that lowers production impact scores, or significant new failure history that changes probability ratings. Individual asset scores should be reviewed whenever a work order closes with a significant finding (a near-miss, an unexpected failure mode, or a repair cost that was much higher than the baseline score assumed). Treating criticality as a one-time exercise is one of the most common reasons criticality programs fail to deliver sustained value.
You can build a criticality register in a spreadsheet and it will give you a ranked asset list — but the ranked list itself is not where the value lies. The value is in using the criticality tiers to drive different maintenance decisions for different assets: different PM intervals, different monitoring intensity, different spare parts stocking levels, different escalation rules. All of that requires a system that can act on the criticality classification automatically, and that is what a CMMS provides. A spreadsheet-based criticality register tends to be reviewed once and then ignored; a CMMS-embedded criticality tier is active in every work order, every PM schedule, and every failure alert the system generates.
Asset criticality analysis is the foundational step that separates organisations managing maintenance by intuition from those managing it by data. It doesn't require expensive technology to start — it requires a cross-functional scoring session, a clear consequence framework, and the discipline to use the rankings to drive different decisions for different assets. Schedule a free demo to see how Cryotos helps maintenance teams embed criticality tiers into their daily work order management and PM scheduling workflow.


Cryotos AI predicts failures, automates work orders, and simplifies maintenance—before problems slow you down.


