

An asset health index is a single score, usually from 0 to 100, that shows how healthy a piece of equipment is. Maintenance teams build it from inspection findings, failure history, age, and performance data, then use it to rank which assets need attention first.
This guide explains how to score equipment condition and rank assets, with a worked scorecard you can copy. It also shows how a Computerized Maintenance Management System keeps the inputs consistent.
Key Takeaways

An asset health index is a numerical score that summarizes how healthy a piece of equipment is. It combines several condition indicators into one number, so planners can compare a pump, a motor, and a chiller on the same scale.
Utilities have scored transformers this way for years, often using tests such as dissolved gas analysis. Plants now apply the same idea to rotating equipment. The ISO 55000 family of asset management standards expects organizations to monitor asset performance, and a health score is one practical way to do it. The index guides where to look first, while RCM and FMEA studies explain why assets fail.
Scoring equipment condition gives every asset the same yardstick, so decisions stop depending on who did the inspection. Most maintenance teams can name their worst machine from memory. Few can rank their worst fifty.
A score also shows direction. A pump that drops from 78 to 61 in six months deserves a closer look, even if nothing has failed yet.

An asset health index draws on five inputs, and each one should come from a record, not a recollection.
Condition data can come from routine inspections or from condition-based maintenance triggers. Condition monitoring software can add live readings from SCADA, PLC, or edge devices. Five inputs are enough to start, because a basic score that gets used beats a complex one that does not.
Want one record for every machine? See how Cryotos handles asset tracking with QR code scanning and full service history.
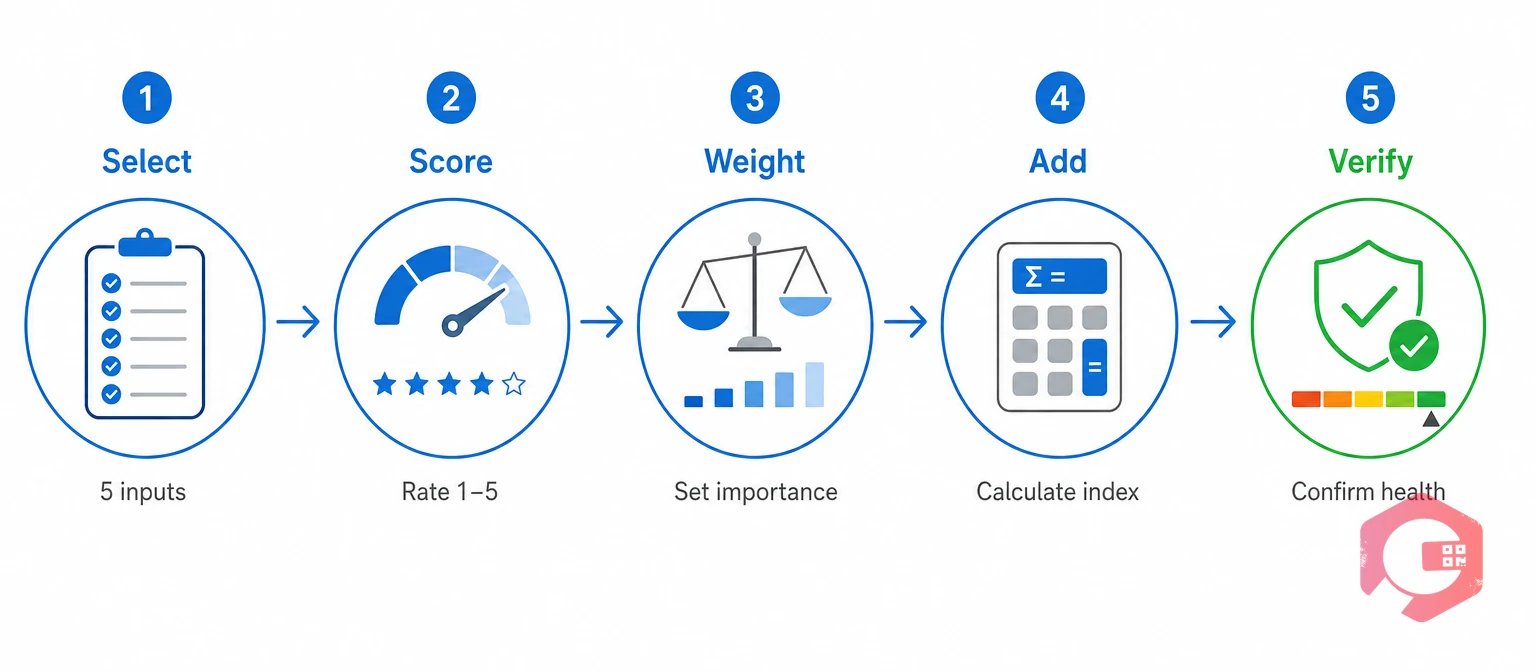
To calculate an asset health index, score each input from 0 to 100, multiply by its weight, and add the results. The weights must total 100%.
The Five-Input Health Scoring Method:
Written criteria matter more than the formula. For example, score a bearing 100 when vibration is below the alert limit, 60 between alert and alarm, and 20 above alarm. Two inspectors then reach the same number.
Start with expert weights, then test them against 12 to 24 months of failures. If assets with low PM compliance keep failing, raise that weight. A common mistake is using eight or more inputs, which adds data entry work and rarely improves the ranking.
This scorecard applies the Five-Input Method to one cooling-water pump. The numbers are illustrative, not from a named customer.
| Input | Weight | Score (0-100) | Weighted Points | Evidence |
|---|---|---|---|---|
| Physical condition | 30% | 60 | 18.0 | Vibration reading and inspection checklist |
| Failure history | 25% | 50 | 12.5 | Two seal failures in 12 months |
| Age against life | 15% | 40 | 6.0 | 12 years in service, 15-year design life |
| Performance | 15% | 70 | 10.5 | 9 downtime hours this year |
| PM compliance | 15% | 90 | 13.5 | 9 of 10 PMs finished on time |
| Asset health index | 100% | n/a | 60.5 | Sum of weighted points |
Pump P-204 scores 60.5. Its PM compliance is strong, but failure history and age pull the total down. A single inspection rating would have hidden that.
An asset health index shows how likely an asset is to fail, while criticality shows how much a failure would cost. Ranking needs both.
Asset criticality is a rating of how much a failure would hurt safety, output, and cost. It rarely changes, while health changes with every inspection.
| Comparison Point | Asset Health Index | Asset Criticality |
|---|---|---|
| Question answered | How likely is this asset to fail? | How bad is a failure? |
| Changes over time | Yes, after every inspection or repair | Rarely, only when the process changes |
| Typical scale | 0 to 100 score | 1 to 5 rating |
| Main use | Deciding when to act | Deciding where to focus |
A simple priority score combines the two: (100 - health index) x criticality rating.
The healthier pump ranks first because its failure would cost far more.

A health band is a score range that maps to a standard maintenance response. Bands turn a number into an action planners can schedule.
| Score | Band | What It Means | Typical Action |
|---|---|---|---|
| 80-100 | Healthy | Normal wear, low failure risk | Keep routine PM |
| 60-79 | Watch | Early signs of degradation | Add inspections and review the PM interval |
| 40-59 | At Risk | Failure likely within the planning period | Plan repair and stock spares |
| 0-39 | Critical | High failure risk or end of life | Repair or replace and prioritize work orders |
Treat these thresholds as a starting point, and move them after comparing each band with real failures.
The biggest challenge in building an asset health index is that the inputs live in different places. The scenario below is an illustrative composite of what maintenance teams describe, not a named customer.
Picture a manufacturer with two plants and a few hundred pumps, motors, and compressors. Inspection ratings sit in notebooks, repairs in a spreadsheet, downtime in a shift log, and asset age in a finance register.
Cryotos solves this by capturing each input on the asset record and reporting them together.
Maintenance teams using Cryotos have reported up to 30% reduction in unplanned downtime and 25% faster repair turnaround. Results depend on how consistently teams record data. Your team still sets the weights, thresholds, and review rhythm.
A 30-day pilot on one asset class proves the method before you scale it. Pick the class with the most unplanned downtime, such as pumps or compressors.
A finished pilot gives you a tested scorecard and a clear list of data gaps to fix before rollout.
Most asset health index programs stall for the same few reasons, and all of them are habits, not software problems.
Fixing these habits costs little and makes the ranking trustworthy from the first month.
There is no universal standard. Many teams treat 80 and above as healthy and below 40 as critical. Set your own thresholds by comparing each band with the failures you see.
Update the score after every inspection, major repair, or meter reading, and review the full ranking each month. Yearly scoring misses assets that decline quickly.
A facility condition index is a ratio of repair cost to replacement value, mostly used for buildings. An asset health index is a multi-input score for equipment. They answer different questions, so many organizations use both.
Yes, for a short list of critical assets. Spreadsheets struggle as inputs multiply and versions drift. Moving inspections, work orders, and downtime into a CMMS keeps the inputs current.
Start with your 10 to 20 most critical assets. A finished pilot proves the method and exposes data gaps before you scale to the whole plant.
A reliable asset health index starts with reliable records. Schedule a free demo to see how Cryotos keeps condition, failure, and downtime data on every asset.


Cryotos AI predicts failures, automates work orders, and simplifies maintenance—before problems slow you down.



