

A reliability program is a plant-wide process for finding why assets fail and stopping the same failures from repeating. The roadmap has five steps: rank your critical assets, capture clean failure data, analyze failures, match each failure mode to a maintenance strategy, and review results every month. Plants that skip the data step usually end up with dashboards nobody trusts. This guide walks through each step in order and shows how maintenance software keeps the data clean enough for the work to pay off.
Key Takeaways
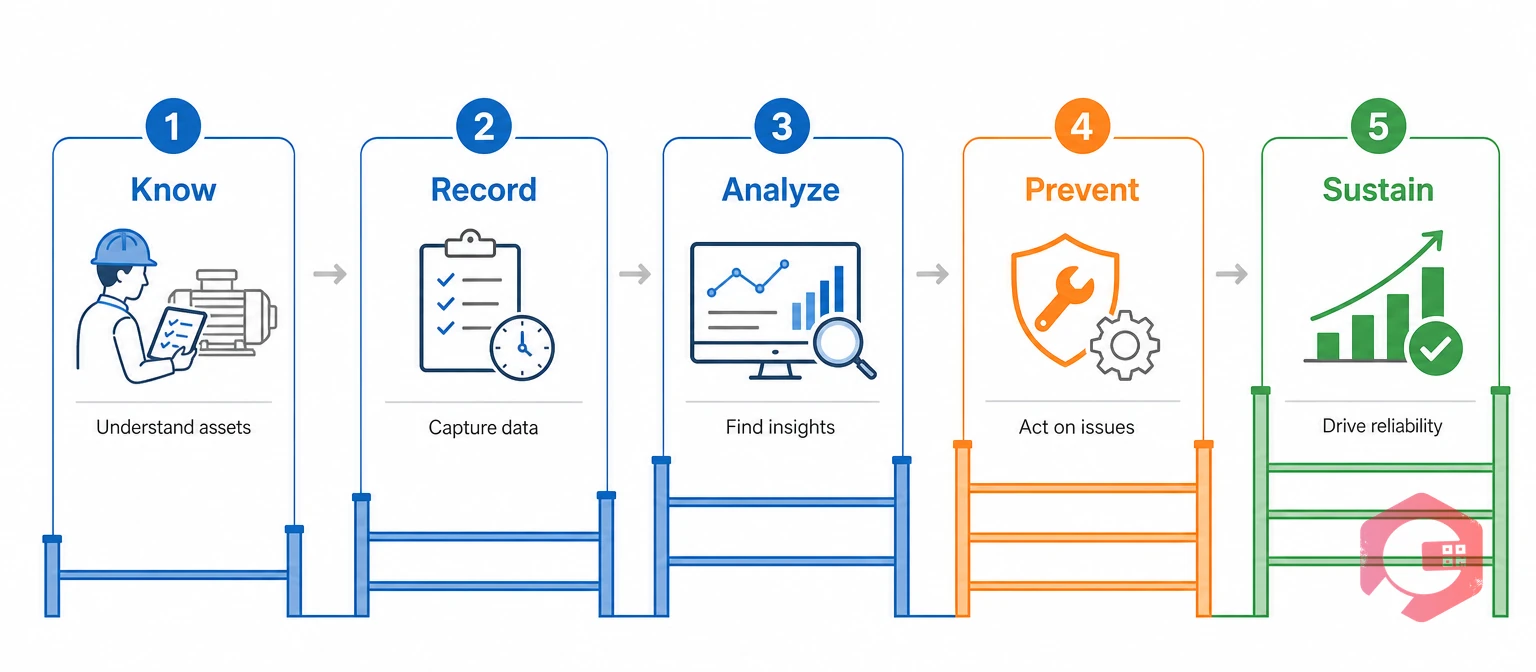
A reliability program is the set of routines, data, and roles a plant uses to make equipment fail less often and recover faster. Maintenance fixes what broke. The program asks why it broke and what will stop it from breaking again.
Its ideas come from reliability-centered maintenance (RCM), the ISO 55000 family of asset management standards, and the maintenance metrics that SMRP publishes. Most maintenance teams borrow pieces of each rather than adopting one wholesale.
The Five-Rung Reliability Ladder:
Each rung depends on the one below it, so skipping ahead rarely works.
The most common reason a reliability program stalls is failure data that nobody trusts, not a lack of effort. The scenario below is an illustrative composite of what maintenance teams describe, not a single named customer.
Picture a three-shift plant with a few hundred assets. Repairs live in a paper logbook, a spreadsheet, and technicians' memory. When the reliability engineer asks how often one gearbox failed last year, answering takes weeks.
Without trusted history, the analysis steps that follow turn into guesswork. Fixing the data comes first.
Want a starting number for your own plant? Enter one critical asset's run time and failure count into the MTBF calculator to baseline it today.
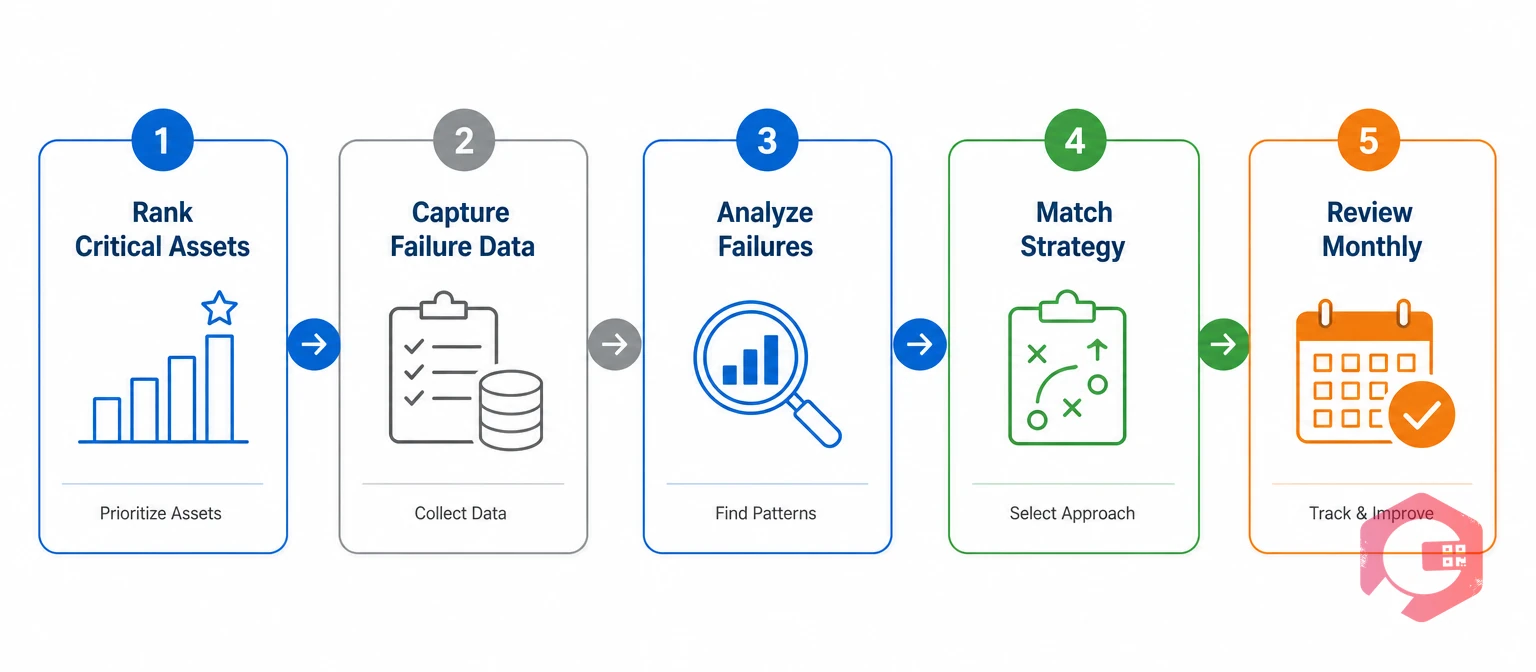
Step one is to set two or three measurable goals and rank your assets by how badly a failure would hurt. A goal might be fewer emergency repairs on the packaging line or higher availability on the boiler. Strong goals name a measure and a deadline, such as cutting repeat failures on the ten most critical assets within twelve months.
Asset criticality is a ranking of how much a failure would hurt safety, output, quality, and cost. Score each asset on these questions:
Start with the top 10 to 20 assets and keep their scores beside each asset's history in Cryotos. A small, finished pilot beats a plant-wide launch that stalls.
Clean failure data means every breakdown is logged the same way, every time. This record feeds every later step, so consistency matters more than detail.
Technicians fill in only what is quick to enter. A work order management tool with QR code requests and offline mobile entry lets them log failures at the asset, even where the signal is weak. Audit a sample of closed work orders each month, because bad entries quietly spoil every report built on them.
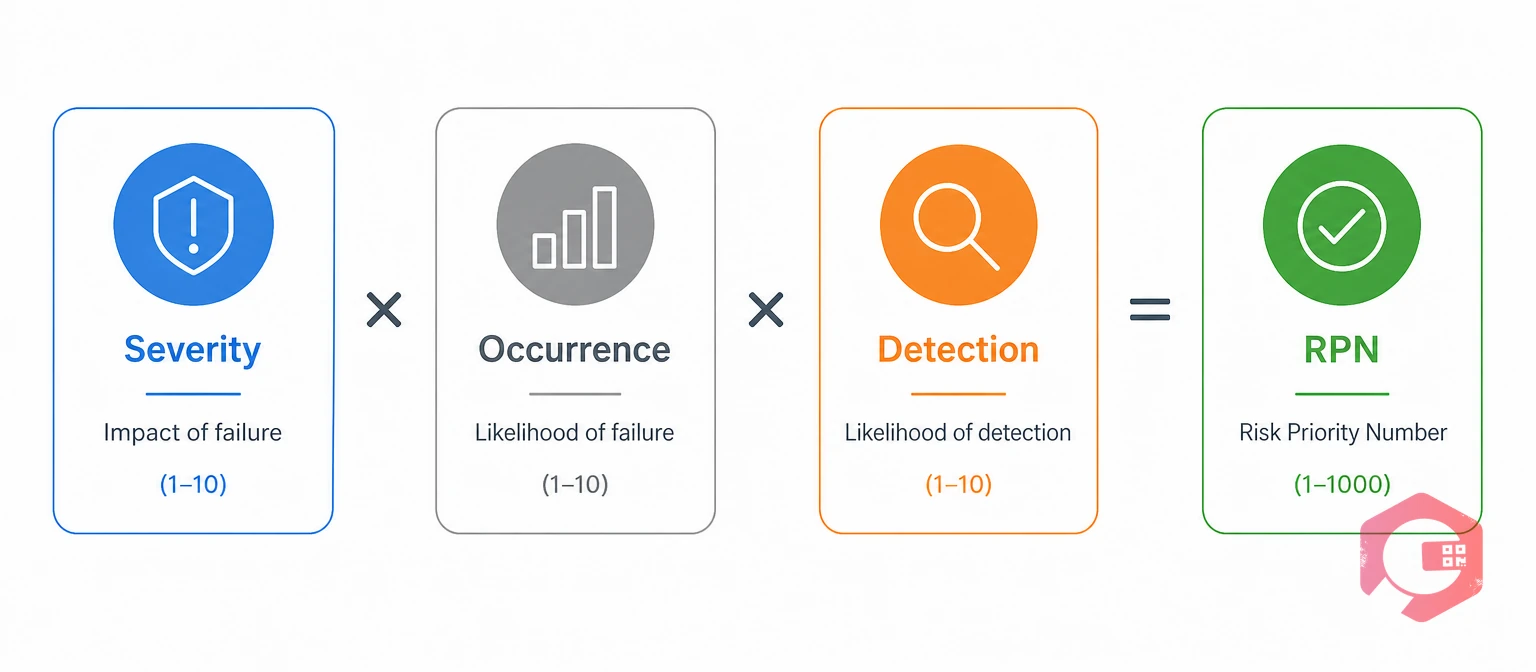
Failure mode and effects analysis (FMEA) is a structured method for listing how an asset can fail and ranking each failure by risk. Teams run FMEA as a workshop with operators, technicians, and engineers for each critical asset. Each failure mode gets three scores:
Multiplying the three scores gives the risk priority number (RPN), which shows where to act first. For example, a gearbox bearing scoring 8, 5, and 6 has an RPN of 240, while a lubrication task scoring 3, 4, and 2 has an RPN of 24. The bearing gets attention first.
For failures that have already repeated, add root cause analysis, and use the 5 Whys for simple cases. Cryotos work orders include a 5 Whys step, so the answer stays on the asset's record.
Step four gives each failure mode the lowest-cost strategy that controls its risk. Time-based preventive maintenance suits wear that grows with age. Inspection and predictive maintenance suit failures that give warning first.
Calendar PMs alone miss a lot. The airline study behind RCM, by Nowlan and Heap, found that only about 11% of components showed any age-related wear-out pattern, such as the classic bathtub curve. Those were aircraft parts, so treat the figure as a caution against calendar-only PMs, not a plant benchmark.
| Strategy | Best for | Trigger for the task |
|---|---|---|
| Time or meter-based PM | Age-related wear: filters, belts, lubrication | Calendar date or run hours |
| Condition-based maintenance | Failures that give warning: bearings, motors | Vibration, temperature, or another reading crosses a limit |
| Design or process fix | Repeat failures with a known root cause | Findings from root cause analysis |
| Run to failure | Low-cost, non-critical, easily replaced assets | Failure occurs, then replace |
Cryotos supports both calendar-based and meter-based PM schedules, and IoT meter readings can trigger condition-based work. Whatever the strategy, the choice should trace back to a failure mode, not habit.
A reliability program lasts only when someone reviews the numbers every month and acts on them. Mean time between failures (MTBF) is the average operating time between one failure and the next. Its partner, mean time to repair (MTTR), is the average time to restore an asset.
Review these in a monthly meeting with maintenance, operations, and engineering. A common mistake is adding KPIs until nobody reads the report, so keep the list short and give each number an owner.
Expect the first review to expose gaps in logging. Fixing those gaps is part of the work, not a sign the effort failed.
The plant in the scenario above needed one trusted record, not more reports. Cryotos replaces the logbook, the spreadsheet, and memory with one system:
Maintenance teams using Cryotos have reported up to 30% reduction in unplanned downtime and 25% faster repair turnaround. Results depend on how consistently teams log failures and act on the data, which is why data capture sits at Rung 2.
Cryotos is the system of record, not the program itself. The goals, FMEA workshops, and monthly reviews still need people who own them.
It is a structured process for cutting repeat failures. Teams rank critical assets, record failures, analyze causes, and choose the right maintenance strategy. It runs alongside daily maintenance and is reviewed on a fixed schedule.
Most plants can stand up a pilot on their top 10 to 20 critical assets within a quarter. Gains from analysis take longer, because failure data has to build up first. Timing depends on plant size and how disciplined data entry is.
A preventive maintenance program schedules tasks at set intervals. A reliability program is broader. It uses failure data to decide which tasks are worth doing, which assets need inspection or redesign instead, and which can run to failure. PM is one tool inside it.
Start with MTBF, MTTR, availability, planned versus reactive work, and repeat failures. Four or five numbers with named owners work better than a long dashboard nobody reads.
Not for a small pilot, since a spreadsheet can hold a few dozen assets. As asset counts and work order volume grow, spreadsheets lose consistency. A CMMS keeps asset history, failure records, and downtime in one place.
Start recording today on the most critical assets. Don't try to rebuild years of history from memory. A few months of clean data beats years of guesses.
A reliability program works best when failure data, PMs, and downtime live in one place. Schedule a free demo to see how Cryotos gives your team one asset history to build on.



Cryotos AI predicts failures, automates work orders, and simplifies maintenance—before problems slow you down.



