

Preventive vs corrective maintenance is the balance between work you plan before a failure and work you do after one. A 43/57 split means 43% of your jobs are preventive and 57% are corrective. It tells you the team now measures its work, but breakdowns still set the agenda. Most reliability benchmarks put mature programs at 70% to 80% or more planned work.
This guide explains what each side of the split signals and scores it on a five-stage maturity scorecard. It then walks through a real Cryotos client whose 43/57 split came from nine months of live data, the challenge they faced, and how Cryotos solved it.
Key Takeaways
Preventive maintenance is scheduled work done before a failure to keep an asset in good condition. It runs on a calendar, runtime hours, or meter readings, and the standard definition covers inspections, lubrication, adjustments, and part swaps.
Corrective maintenance is work done to restore an asset after a fault or failure is found. Corrective maintenance can be planned, such as a defect found on an inspection, or urgent, such as a breakdown in the middle of a shift.
| Factor | Preventive Maintenance | Corrective Maintenance |
|---|---|---|
| Trigger | Calendar, runtime hours or meter reading | Fault, defect or breakdown |
| Timing | Before failure | After failure or defect is found |
| Downtime | Planned and usually short | Often unplanned and longer |
| Cost profile | Predictable labor and parts | Overtime, rush parts and lost output |
| Best fit | Critical assets with known wear patterns | Low-risk assets with spares or a run-to-failure plan |
| Main KPI | PM compliance | MTTR and repeat failures |
Neither type is wrong on its own. The goal is the right mix for each asset, based on how critical it is and how it fails.
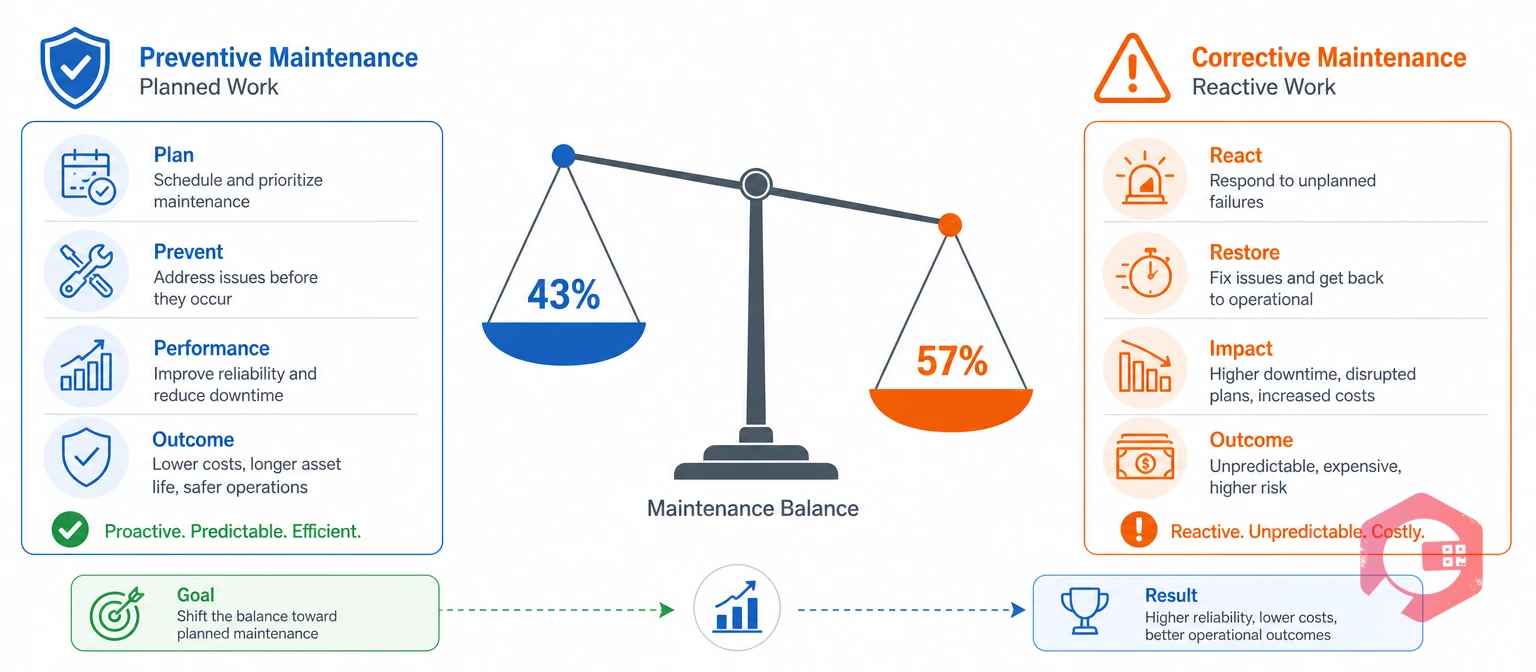
A 43/57 preventive vs corrective maintenance split means your team spends more time fixing failures than stopping them. It sits below the 50% line where planned work takes the lead. It is also far below the 80/20 ratio that many reliability teams call world-class.
The ratio is a signal, not a verdict. A high corrective share can mean real failures, but it can also mean a team finally logs small faults that paper records used to miss. Read the split next to unplanned maintenance hours, repeat failures, and critical breakdowns before you judge it.
Want to check your own ratio? Use the free planned maintenance percentage calculator to see where your team stands today.
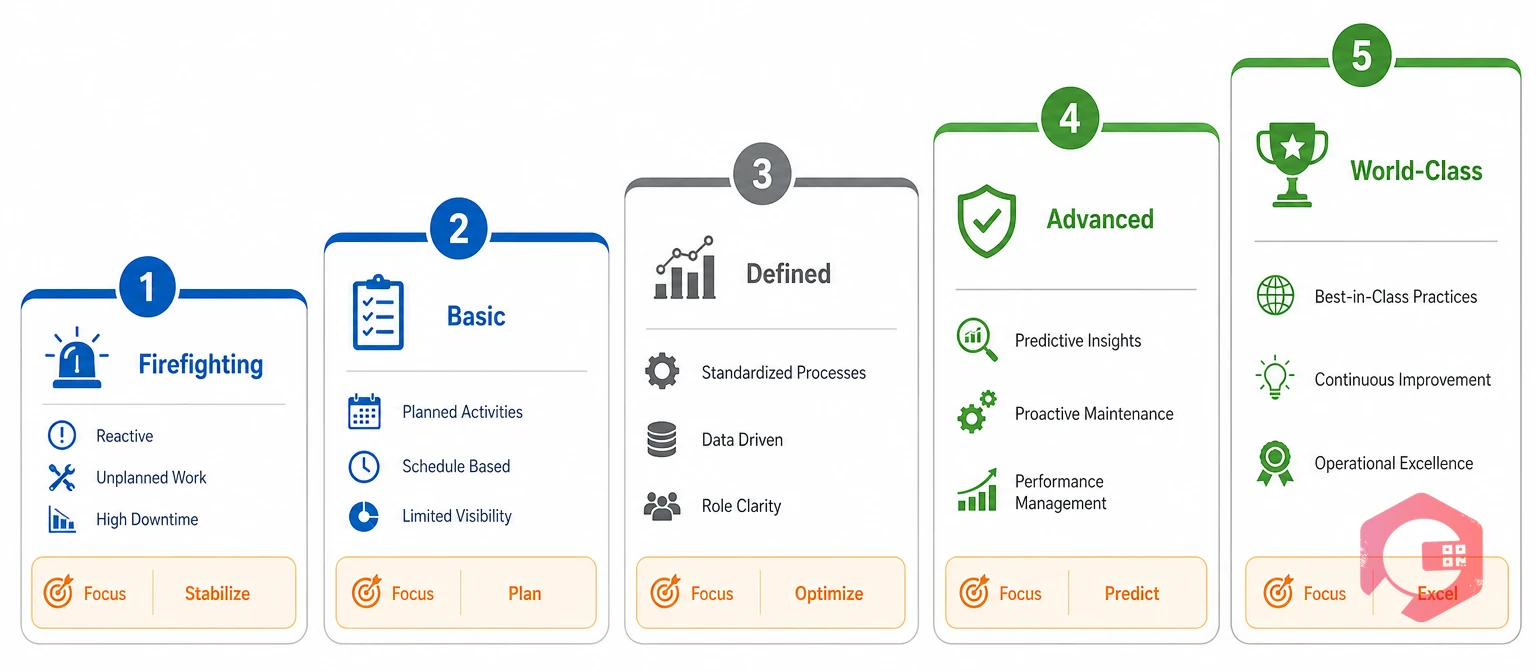
The scorecard below maps your preventive share to a maturity stage. Find your row, then look at the next move, not the end goal.
| Stage | PM Share | CM Share | What It Signals | Next Move |
|---|---|---|---|---|
| 1. Firefighting | Under 30% | Over 70% | Breakdowns set the agenda; few reliable records | Log every job digitally |
| 2. Reactive-Leaning | 30% to 49% | 51% to 70% | Work is measured, but failures still lead | Add PMs to critical assets first |
| 3. Balanced | 50% to 69% | 31% to 50% | PMs run on time and repeat failures fall | Run root cause reviews on repeats |
| 4. Planned | 70% to 84% | 16% to 30% | Most work is scheduled and backlog is steady | Shift time-based PMs to condition-based checks |
| 5. World-Class | 85% and above | 15% or less | Corrective work is mostly planned repairs found on inspections | Tune intervals with failure data |
A 43/57 split lands at Stage 2. Most maintenance teams at this stage already hold the data they need, and the next gain comes from pointing it at the right assets. That is where maintenance management software earns its place.
The 43/57 split in this article comes from a real Cryotos customer: a marine robotics and underwater inspection company that inspects ports, dams, ships, and pipelines with remotely operated vehicles (ROVs). From January to September 2026, the team raised 272 requests, made up of 117 preventive jobs (43%) and 155 corrective work orders (57%).
Getting that number at all was the first win. Before it moved to a Computerized Maintenance Management System in November 2019, the company ran maintenance on paper and Excel and faced four connected problems.
The major challenge was simple to state and hard to fix. The team could not see its own preventive vs corrective maintenance balance, so it could not manage it.
Cryotos solved the challenge by putting every preventive and corrective job into one system with the same level of detail. Each fix below maps to one of the gaps the team faced.
Maintenance teams using Cryotos have reported up to 30% reduction in unplanned downtime and 25% faster repair turnaround. For this client, the lesson is that a 57% corrective share and 96% availability can sit side by side when every failure is logged, explained, and designed out.
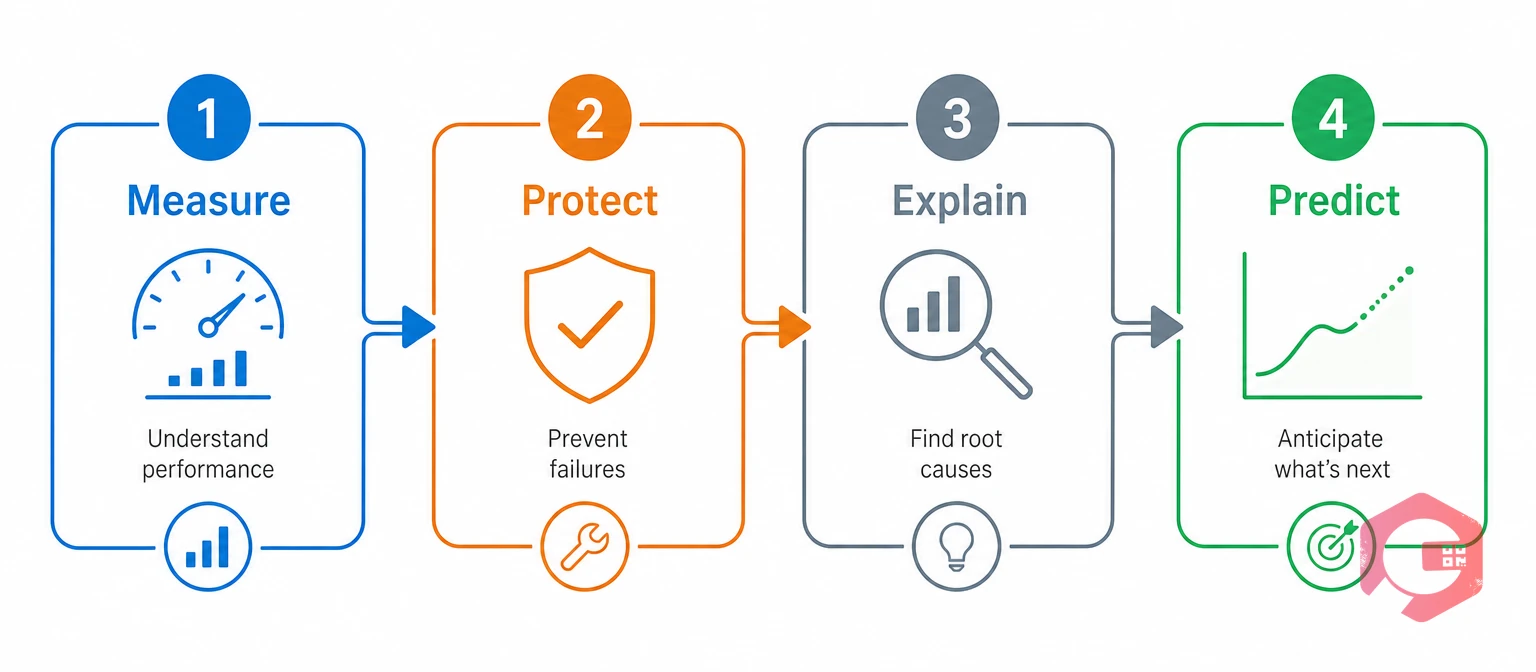
You shift the preventive vs corrective maintenance ratio by protecting critical assets first, not by adding PMs everywhere. Teams that successfully move from Stage 2 to Stage 3 usually climb four rungs in order.
The PM-CM Maturity Ladder:
Steady gains each quarter last longer than a leap to 80/20. Chasing the target too fast usually floods technicians with low-value PMs that nobody finishes.
Many reliability practitioners treat 80% planned and 20% reactive work as world-class, and 70/30 as a solid goal for most plants. The right ratio still depends on asset criticality, since some low-risk assets are cheaper to run to failure.
It shows a reactive-leaning program, but it is not always bad. If the team logs every fault honestly and critical breakdowns are falling, the split is a strong baseline to improve from.
Count the preventive and corrective jobs closed in the same period, then divide each by the total. For example, 117 preventive and 155 corrective jobs out of 272 gives a 43/57 split.
Yes, a defect found on an inspection is corrective work, but it is planned corrective work. Track it apart from breakdowns, because a rise in inspection findings often means your PMs are catching problems early.
A CMMS schedules PMs on time, logs every corrective job with downtime and cause, and reports the split by asset and month. That view shows exactly where a new PM or a root cause review will do the most good.
Your preventive vs corrective maintenance split is only useful if you can see it and act on it. Schedule a free demo to see how Cryotos tracks every PM and breakdown, logs downtime, and turns your ratio into a live maturity KPI.



Cryotos AI predicts failures, automates work orders, and simplifies maintenance—before problems slow you down.



