

Value stream mapping in maintenance operations is a lean technique that traces every step a work order passes through, from the moment a fault is reported to the moment the asset is verified back in service, and separates that time into value-add work and non-value-add waiting. A work order can show 45 minutes of actual repair time and still carry a 14-hour total lead time once triage delay, parts staging, and technician travel are counted. Most maintenance teams that have never mapped their process are shocked at how little of that 14 hours the repair itself actually explains, even when every work order in the sample shows up as "completed on time" in a standard report.
Key Takeaways
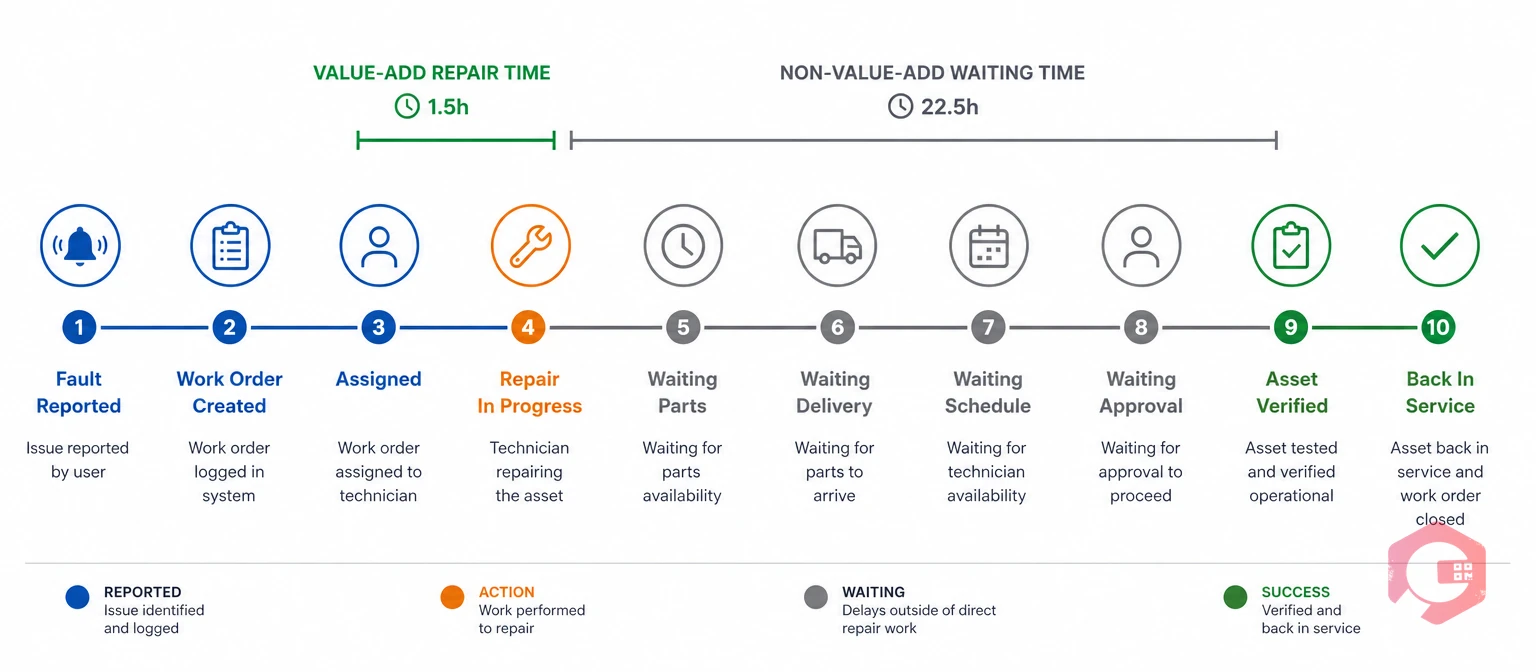
Value stream mapping in maintenance operations lays out the full sequence a work order travels through, then classifies every minute of it. The sequence typically runs: work request, triage, parts staging, technician dispatch, repair, verification, and close-out.
Value-add time is any minute that directly restores the asset — diagnosis, repair, and testing. Everything else, including waiting for approval, waiting for a technician, and waiting for a part, is non-value-add time. VSM doesn't judge whether the repair itself was done well. It shows how much of the surrounding process silently consumes time that never touches the asset.
The technique exists because maintenance teams tend to measure what's easy to measure — work orders closed, PMs completed — without measuring the time in between. A work order can be marked complete and still have taken three days longer than it needed to, with none of that delay visible in a standard completion report.
Process cycle efficiency is repair time divided by total lead time, and it's the single number a value stream map is built to produce. Maintenance operations that have never been mapped often see this ratio sit below 10%, meaning more than 90% of a work order's life is spent waiting rather than being worked on.
Asset management practices aligned with ISO 55000 asset management principles treat this kind of cycle-time visibility as a baseline expectation, not an advanced capability. A maintenance operation that can't see its own process cycle efficiency has no reliable way to prioritize where to invest — in staffing, inventory, dispatch logic, or approval workflow.
For a maintenance manager, a value stream map turns "average time to close a work order" from a vague number into a diagnosis. It points at the specific step consuming the most time, instead of leaving the team to guess.
Without a value stream map, maintenance teams tend to optimize the parts of the process they can already see and leave the parts they can't see to compound indefinitely. A supervisor might push technicians to work faster, when the real constraint sits three steps upstream in a triage queue no one is timing. That mismatch between where effort goes and where the delay actually lives is the most common reason maintenance improvement initiatives stall after an initial burst of activity.
The same mismatch shows up in budget conversations. Leadership sees rising average repair times and assumes the answer is more headcount. A value stream map often shows the opposite: the technicians are available and capable, but the process around them is generating hours of avoidable wait before they ever pick up a wrench.
A mid-size manufacturing plant pulled ten recent work orders for a recurring centrifugal pump seal failure and walked each one from request to close. The repair itself, once a technician had the pump in hand, took an average of 45 minutes: remove the housing, replace the seal, reassemble, and test.
The total lead time across those same work orders averaged just over 14 hours. The gap didn't come from one dramatic delay. It came from four smaller ones stacked together: roughly two hours sitting in the triage queue before anyone reviewed it, nearly six hours waiting for the replacement seal to be pulled from a storeroom two buildings away, another three hours before a technician with the right certification became available, and the remaining time split between transit and paperwork at close-out.
None of that shows up in a standard "work order closed" report. The completion timestamp looked identical whether the job took two hours or two days. Only once the plant timestamped each stage separately did the pattern become visible: parts staging, not repair speed, was consuming the largest single block of time.
The fix wasn't a faster technician. It was moving a small stock of common seals to a cabinet near the affected pumps instead of the central storeroom. That single change cut the average lead time from 14 hours to under five, without touching the 45-minute repair step at all. That's the pattern a value stream map almost always reveals: the biggest lever sits in the wait, not the wrench time.
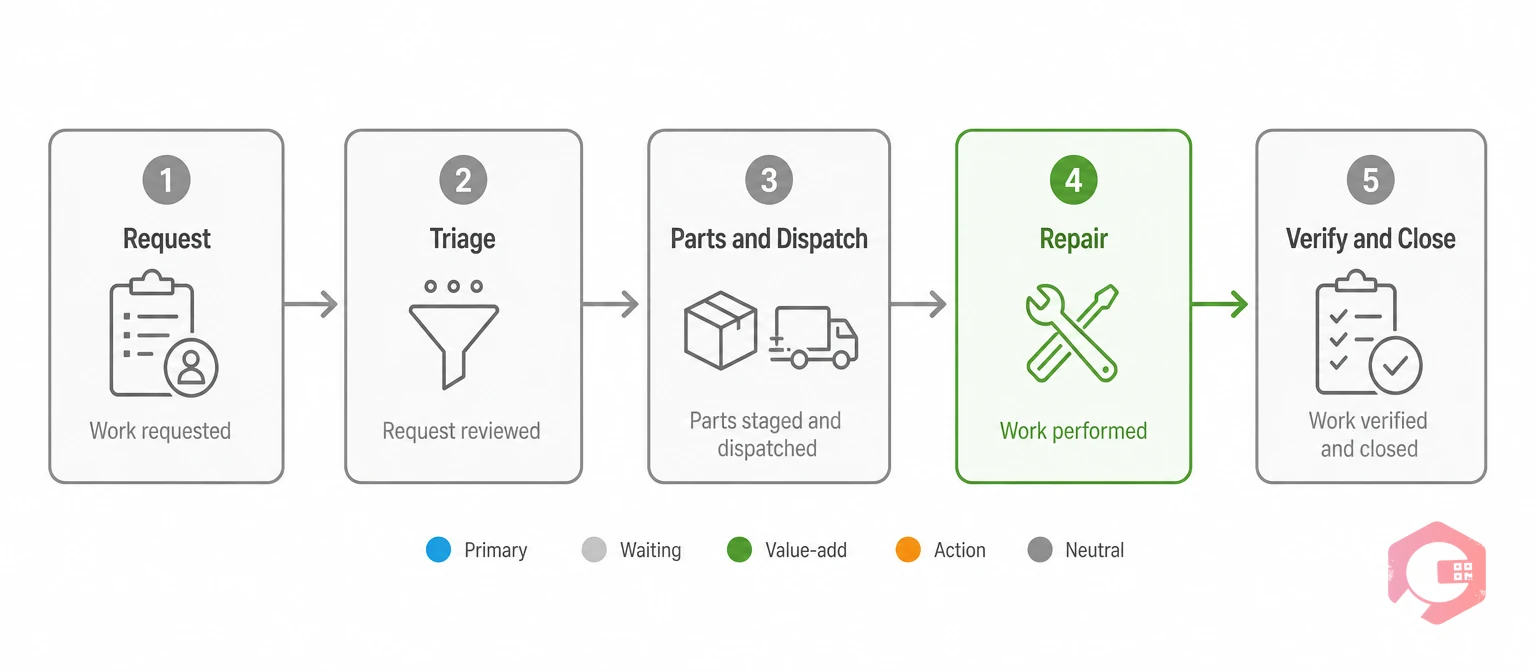
The Five-Stage Maintenance Value Stream is a framework for classifying where work order time actually goes, from the moment a fault surfaces to the moment the work order closes:
Mapping a sample of work orders against these five stages, rather than treating "total time" as one lump figure, is what turns a vague sense of delay into a specific, fixable target.
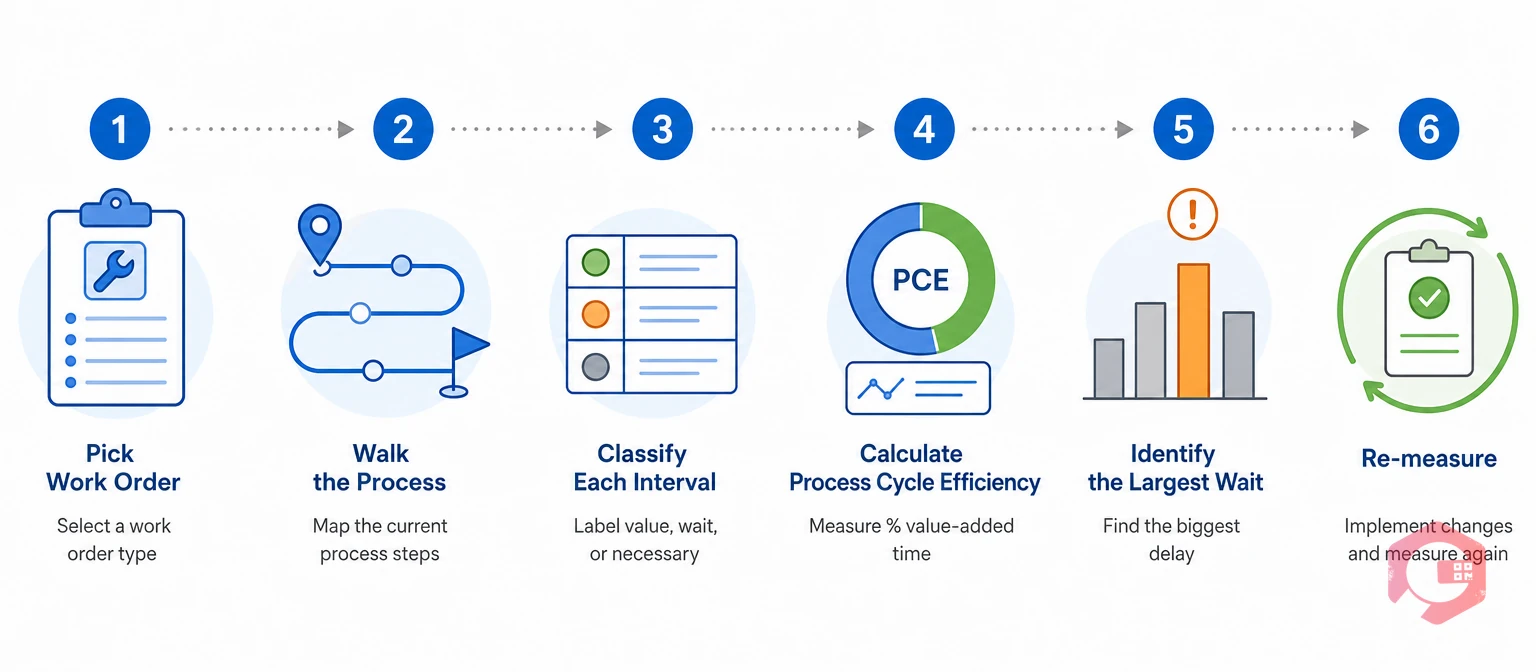
Building a maintenance value stream map means walking a real work order end to end, timestamping every stage, and calculating where the time actually went. Most maintenance teams can complete a first pass in a single afternoon using a sample of 10 to 20 recent work orders.
See how your current average repair-to-lead-time ratio compares using the OEE calculator before and after a process change.
Most first-pass maintenance value stream maps go wrong in the same two places. Teams either map an idealized version of the process instead of what actually happens, or they map a single work order and treat it as representative of every job.
The two categories look similar on paper — both are just minutes on a work order — but they behave completely differently once mapped against real data.
Most process cycle efficiency gains come from the right-hand column, not the left. Wrench time is already fairly efficient in most operations; the wait around it is where the map earns its value.
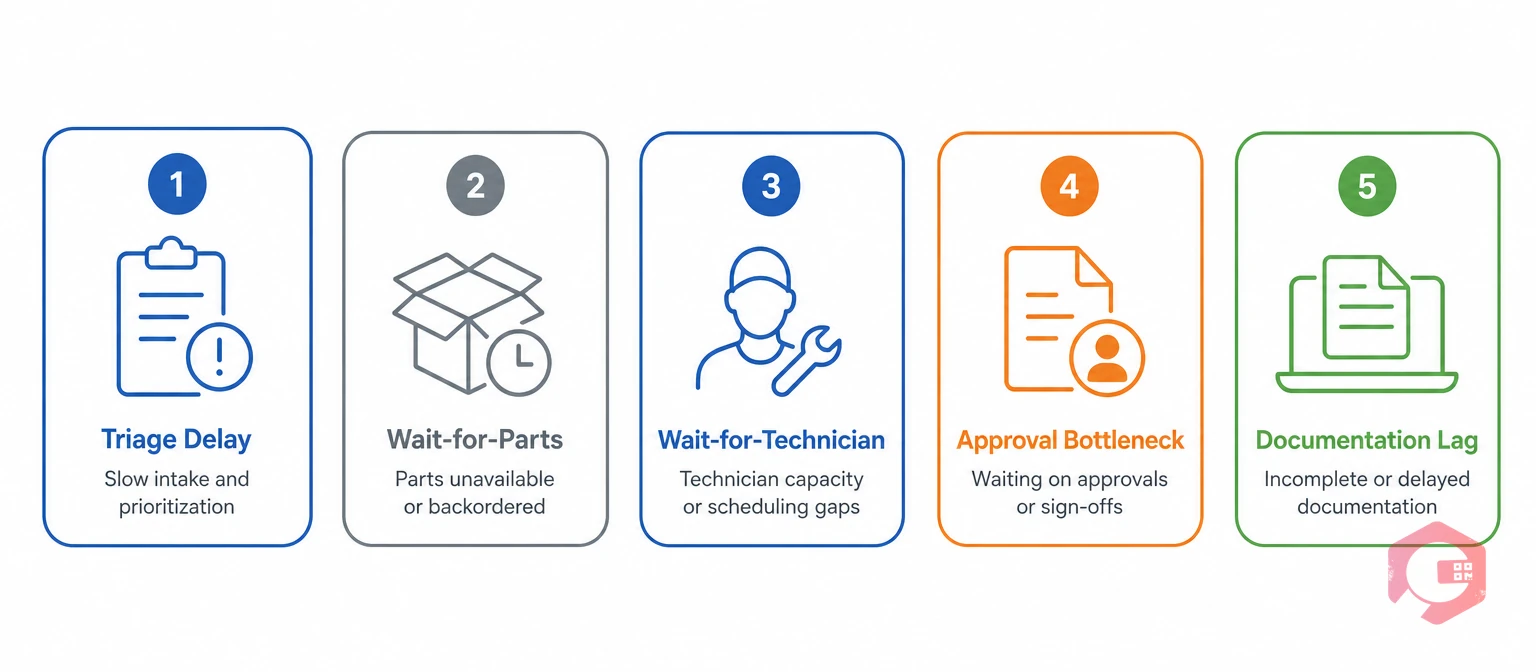
The same categories of delay show up across most maintenance operations, though the size of each varies by site and asset type.
Most operations that successfully address one of these find that fixing the largest bottleneck first has a bigger effect on total lead time than optimizing all five at once. A team that spreads its effort evenly across all five categories usually sees smaller, slower gains than one that identifies the single largest block of non-value-add time and attacks it directly.
The order in which these bottlenecks show up also tends to shift as a maintenance operation matures. A team just starting to map its process usually finds triage delay and wait-for-parts dominate. Once those are addressed, wait-for-technician and approval bottlenecks often become the next visible constraint, since removing the first layer of waste exposes the layer beneath it.
The five-stage structure holds across industries, but which bottleneck dominates tends to shift with the environment.
Mapping the same five stages across sites in any of these environments is what makes cross-site comparison meaningful, since every location is being measured against the same structure rather than a locally invented one.
Cryotos gives maintenance teams the timestamped data a value stream map is built from, captured automatically as a work order moves through its lifecycle rather than reconstructed from memory during a walkthrough.
Cryotos timestamps a work order at every state change: request logged, triaged, parts requested, technician assigned, work started, work completed, verified, and closed. A Computerized Maintenance Management System built this way removes the need to shadow technicians or rebuild timelines after the fact.
Downtime tracking in Cryotos separates time by department, plant, and asset, and distinguishes waiting-for-parts, waiting-for-technician, and active-repair time as separate buckets. A value stream map built on this data shows exactly which category of wait is driving lead time, instead of lumping every delay into one undifferentiated number.
Because every state change carries a timestamp, Cryotos calculates process cycle efficiency automatically for every work order, asset class, or site. Teams see the ratio directly instead of estimating it from a handful of manually walked work orders.
Inventory management tracks stock by QR code and barcode, with warehouse structure mapping and min-threshold alerts. Linked to work order timestamps, this shows whether a bottleneck traces back to a part that was in the building but not staged, or one that genuinely wasn't in stock.
The Cryotos BI dashboard surfaces process cycle efficiency and wait-time breakdowns as a standing report rather than a one-time mapping workshop, so managers see whether the process is improving or drifting after a fix goes in.
For condition-based and meter-triggered work, Cryotos's IoT integration timestamps the moment a threshold is breached, extending the value stream one step earlier — from fault detection through to close-out — rather than starting the clock only when a person logs a request.
Cryotos's offline mobile app lets technicians log start and completion times, photos, and notes directly in the field, syncing automatically once connectivity returns. This keeps the value stream map accurate even in plants, remote sites, or basements where signal is unreliable, instead of leaving gaps that get filled in later with estimated times.
Root cause analysis captured at work order close-out can be cross-referenced against value stream data for a given asset class. This connects a recurring bottleneck, such as a chronic parts-staging delay, to its underlying cause, instead of treating the mapping exercise and the root-cause exercise as two disconnected activities.
Maintenance teams using Cryotos have reported up to 30% reduction in unplanned downtime and 25% faster repair turnaround after putting this kind of timestamped visibility to work on their own process.
Once every stage of the work order lifecycle is timestamped, a maintenance operation stops debating where the delay "probably" is and starts pointing at the specific step consuming the most non-value-add time.
Manufacturing and plant maintenance teams applying this approach through platforms built for manufacturing maintenance often find the biggest early win sits in dispatch logic rather than staffing, since the data usually shows technicians were available but not routed efficiently. This same discipline connects directly to lean maintenance practice and feeds naturally into overall equipment effectiveness tracking, since both rely on the same timestamped foundation.
The value stream mapping technique originated in manufacturing process improvement, and maintenance operations are simply the latest place it's being applied with the same discipline. The value stream mapping resources published by ASQ describe the same waste-elimination logic that applies directly to a work order's path from request to close. Reliability programs referenced by the Society for Maintenance and Reliability Professionals increasingly treat this kind of cycle-time visibility as a benchmarking input, not just an internal improvement exercise.
A first value stream map doesn't need executive sign-off, new software, or a multi-week workshop. It needs a sample of real work orders and someone willing to time the gaps between stages honestly.
Most maintenance teams that complete this first pass find the exercise pays for itself within the same quarter, simply by exposing one bottleneck that had been invisible in every prior report.
A workflow diagram shows the sequence of steps a work order follows. Value stream mapping goes further by timestamping each step and classifying the time spent as value-add or non-value-add, which is what actually reveals where delay is hiding.
Most maintenance teams can complete a first pass in a single afternoon using 10 to 20 recent work orders of the same type. The bigger time investment comes later, in acting on what the map reveals and re-measuring the result.
Process cycle efficiency is value-add time divided by total lead time, expressed as a percentage. A work order with 45 minutes of repair time and a 14-hour total lead time has a process cycle efficiency of roughly 5%, which is typical for maintenance operations that haven't yet been mapped.
A whiteboard exercise can produce a useful first map, but it captures a single moment in time and depends on memory for timestamps. A CMMS that logs every state change automatically keeps the map current and lets a team confirm that a fix actually held weeks or months later.
A map is worth revisiting any time a process change is implemented, and at minimum quarterly for high-volume work order types, since staffing, parts availability, and demand all shift over time and can quietly erode a fix that worked initially.
Fix the single largest block of non-value-add time first, rather than spreading effort evenly across every stage. For most maintenance operations that block is parts staging or triage delay, and addressing it typically moves total lead time more than any other single change.
Value stream mapping applies to reactive work orders as well, though the stages carry different weight. Reactive repairs tend to show larger triage and dispatch delays, since the work wasn't scheduled in advance, which makes mapping them especially useful for spotting emergency-response gaps.
Value stream mapping turns "the work order closed on time" from an assumption into a measurable fact, and every timestamped work order in Cryotos becomes part of that evidence. A map built once on a whiteboard fades the moment staffing or parts availability shifts, but a map built from live, timestamped work order data keeps itself current with no extra effort from the team. Schedule a free demo to see how Cryotos turns your maintenance team's work order data into a value stream map that updates itself.



Cryotos AI predicts failures, automates work orders, and simplifies maintenance—before problems slow you down.



