
The carbon cost of equipment failures is the total CO2-equivalent emissions that a breakdown causes, found by multiplying each activity (kWh, kilograms, liters, tonne-km) by its emission factor and adding the results. Over-maintenance uses the same math for work that did not need to happen.
This guide gives the formulas, two worked examples and a four-step framework. It also shows how a Computerized Maintenance Management System (CMMS) captures the data that every calculation needs.
Key Takeaways
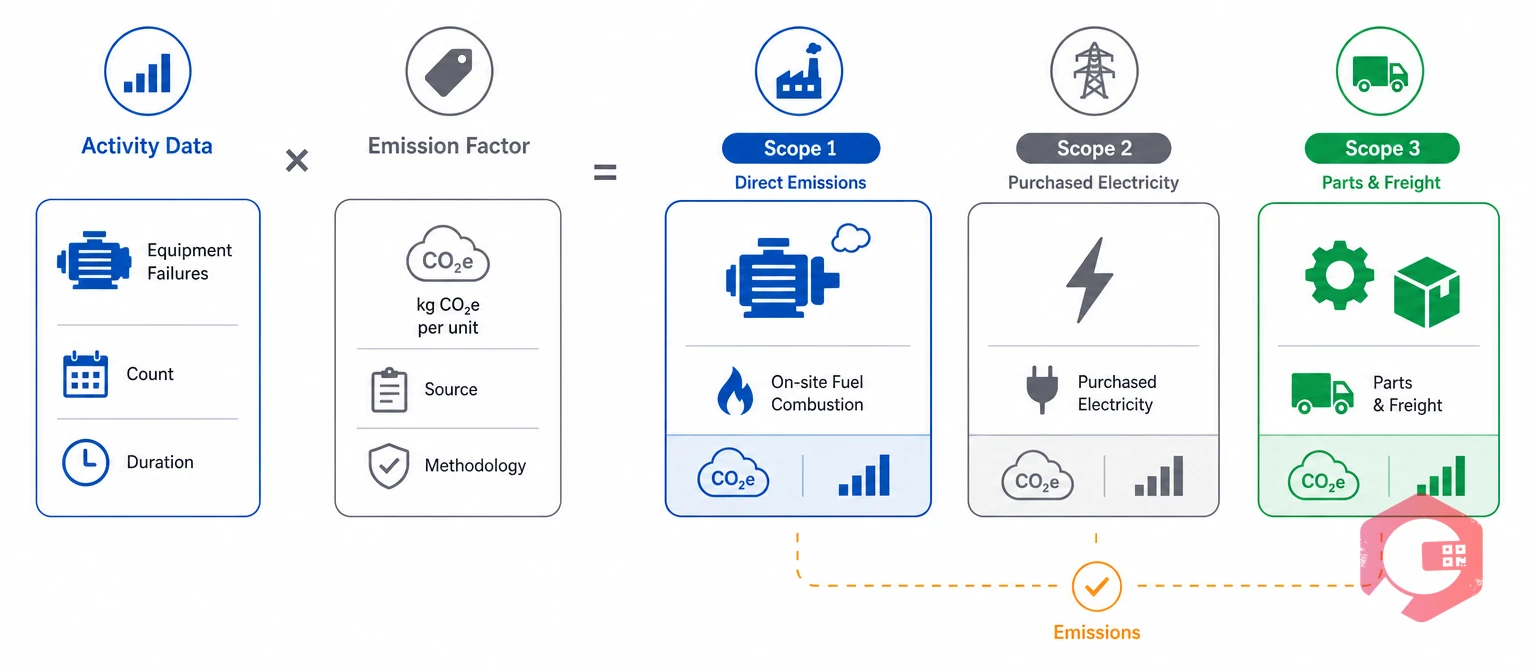
The carbon cost of equipment failures is the total CO2-equivalent emissions that a failure causes, from wasted energy to replacement parts. Over-maintenance is maintenance work that adds emissions without lowering failure risk.
The GHG Protocol Corporate Standard sorts emissions into three scopes, and failures and extra maintenance touch all of them.
An emission factor is the amount of CO2e released per unit of activity, such as per kWh or per kilogram. The EPA GHG Emission Factors Hub publishes default factors for fuels, electricity and more. Record the source and year of every factor you use.
Label each number by data quality, so readers know how far to trust it:
Most facilities have never put a carbon number on one breakdown. Cost and downtime set priorities, and the emissions stay hidden.
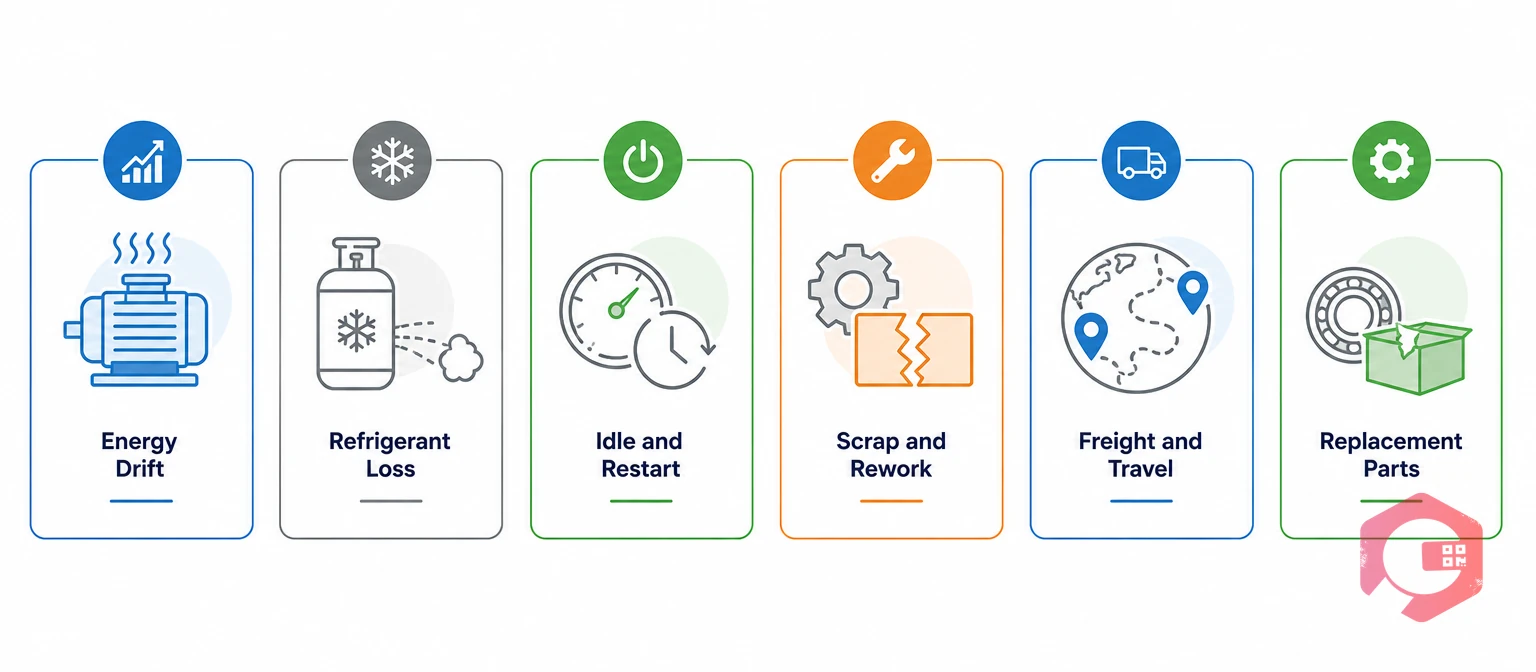
Add up six terms for each unplanned event, using activity data from the work order and plant records. The carbon cost of equipment failures grows with every hour of degraded running and every kilogram of scrap.
Compressed air is a common source of energy drift, and the US Department of Energy publishes a tip sheet on minimizing compressed air leaks. A failure is also an unplanned maintenance event, so it carries every term above.
Capture the downtime hours for this step with downtime tracking by asset, plant and department.
A 55 kW motor loses 7% efficiency for 30 days before a bearing fails, then stops the line for 12 hours. The example assumes 0.40 kg CO2e per kWh, 1.5 tonnes of off-spec product at 2.0 kg CO2e per kg, and 40 kg of parts flown 6,000 km at 0.6 kg CO2e per tonne-km. All factors are illustrative, so use your own.
| Term | Calculation | kg CO2e | Share |
|---|---|---|---|
| Energy drift | 55 kW x 7% x 720 h = 2,772 kWh x 0.40 | 1,109 | 25% |
| Idle and restart | 40 kW x 12 h = 480 kWh x 0.40 | 192 | 4% |
| Scrap | 1,500 kg x 2.0 | 3,000 | 67% |
| Expedited freight | 0.04 t x 6,000 km x 0.6 | 144 | 3% |
| Replacement parts | 12 kg x 3.0 | 36 | 1% |
| Total | Sum of all terms | 4,481 | 100% |
The carbon cost of equipment failures here is about 4.5 tonnes CO2e, and scrap is two-thirds of it. Catching the bearing early would have saved the drift and most of the scrap. One refrigerant leak can beat this total: 5 kg of R-410A is 10,440 kg CO2e, or about 10.4 tonnes.
Add five terms for work that did not reduce risk: parts replaced early (footprint x share of life unused), extra fluids and consumables, avoidable stops, extra travel, and failures that maintenance induces.
Take 40 gearboxes changed every quarter when oil analysis supports yearly changes. Each change uses 20 liters of oil at 2.0 kg CO2e per liter, a 1.5 kg filter at 4.0 kg CO2e per kg, and 10 kWh of restart energy. That is 50 kg CO2e per change. The 120 extra changes a year add 6,000 kg CO2e and 2,400 liters of waste oil.
Each avoidable stop also adds planned downtime and restart energy. Most maintenance teams cut this waste by moving calendar tasks onto running-hour triggers in preventive maintenance software.
Neither always wins, so compare them asset by asset. The carbon cost of equipment failures arrives in bursts of several tonnes, while a calendar habit repeats every year.
| Factor | Failure carbon | Over-maintenance carbon | How to cut it |
|---|---|---|---|
| Trigger | A breakdown or hidden fault | A calendar task the asset did not need | Find the cause, or move to condition triggers |
| Biggest terms | Scrap, refrigerant loss, energy drift | Parts, fluids, restarts, travel | Rank terms by kg CO2e before acting |
| Best data source | Work order closure fields and downtime | PM outcome codes and parts history | Capture both at the point of work |
| Right response | Catch faults earlier | Do less of the wrong work | Match each interval to failure risk |
Reliability-centered maintenance (RCM) research found that most failures are not tied to equipment age, so fixed calendar replacement often adds carbon without cutting risk. Assets with real wear-out or high failure carbon still earn shorter intervals.
The best interval balances task carbon against failure carbon: carbon per month equals task carbon divided by the interval, plus failure rate times failure carbon. For random failures, shorter intervals only add task carbon. For wear-out failures, the best interval sits where the two curves meet.
Operations that review their no-finding PM tasks each quarter usually start by stretching the intervals on a few lubrication and filter changes, confirm that failures do not rise, and then widen the review.
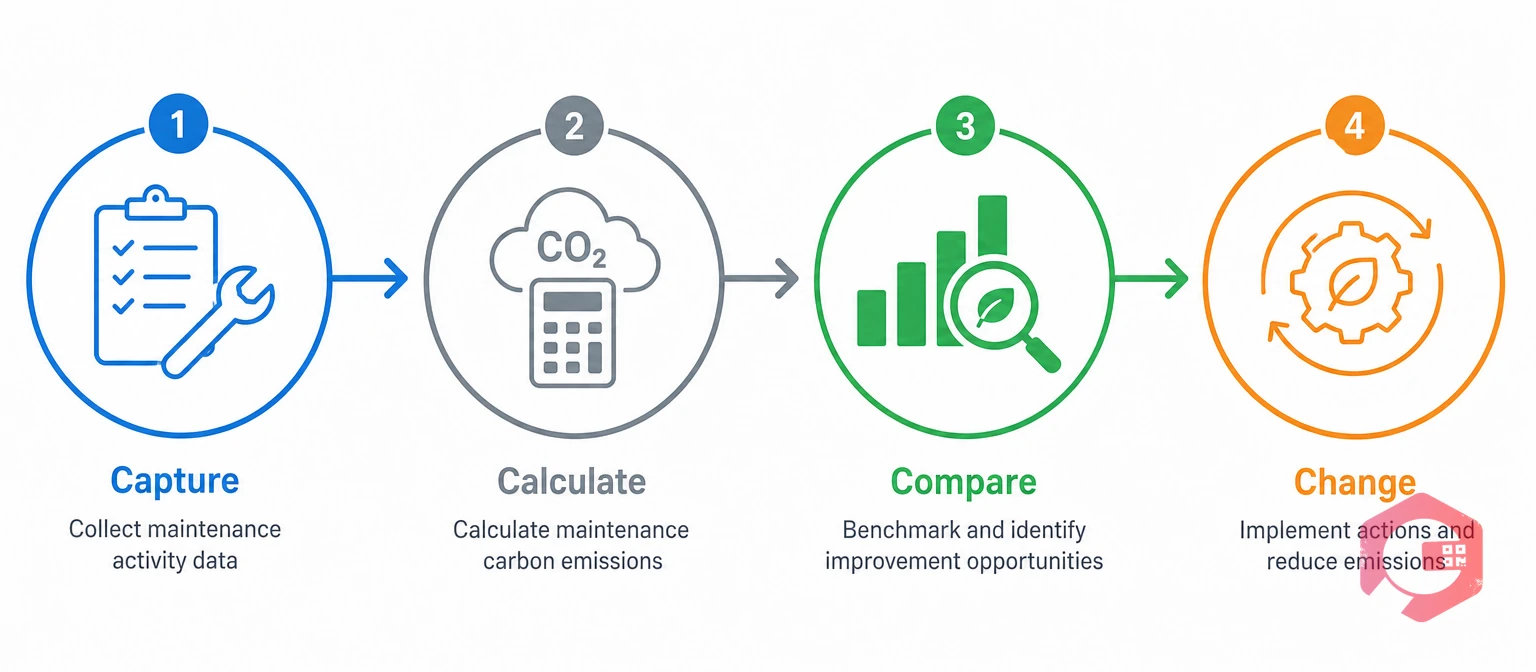
The Capture-Calculate-Compare-Change Framework:
Used every quarter, the framework steadily lowers the carbon cost of equipment failures and the waste behind it.
Cryotos doesn't hold emission factors or produce a carbon inventory. It captures the activity data, so your sustainability tool or workbook can apply the factors.
Maintenance teams using Cryotos have reported up to 30% reduction in unplanned downtime and 25% faster repair turnaround. Confirm field-level setup with the Cryotos team for your plan.
Multiply each activity by its emission factor and add the results. Include energy drift, refrigerant loss, idle and restart energy, scrap, freight and replacement parts.
It varies, but scrap and refrigerant leaks are often the largest terms. Energy drift before the failure comes next. Rank the terms for your own assets before choosing a fix.
Catch faults early with condition checks, fix energy drift and leaks fast, and stock critical spares to avoid air freight. Review root causes so repeat failures stop.
Yes. Early part changes, calendar oil changes and avoidable stops all add embodied carbon, waste and restart energy. They add no value if condition data shows the asset is healthy.
Use factors from your reporting framework or national government sets, such as the EPA hub in the United States. Record the source, year and data quality tier for each one.
Start with engineered estimates for routine events and measured data for the largest sources. A labeled estimate that you improve each quarter beats waiting for perfect data.
A CMMS doesn't calculate emissions by itself. It captures the downtime, parts, readings and causes that the calculation needs, and keeps them auditable.
Every maintenance decision has a carbon side, and the data to see it is already in your work orders. Schedule a free demo to see how Cryotos captures the downtime, parts and cause data behind your carbon calculations.


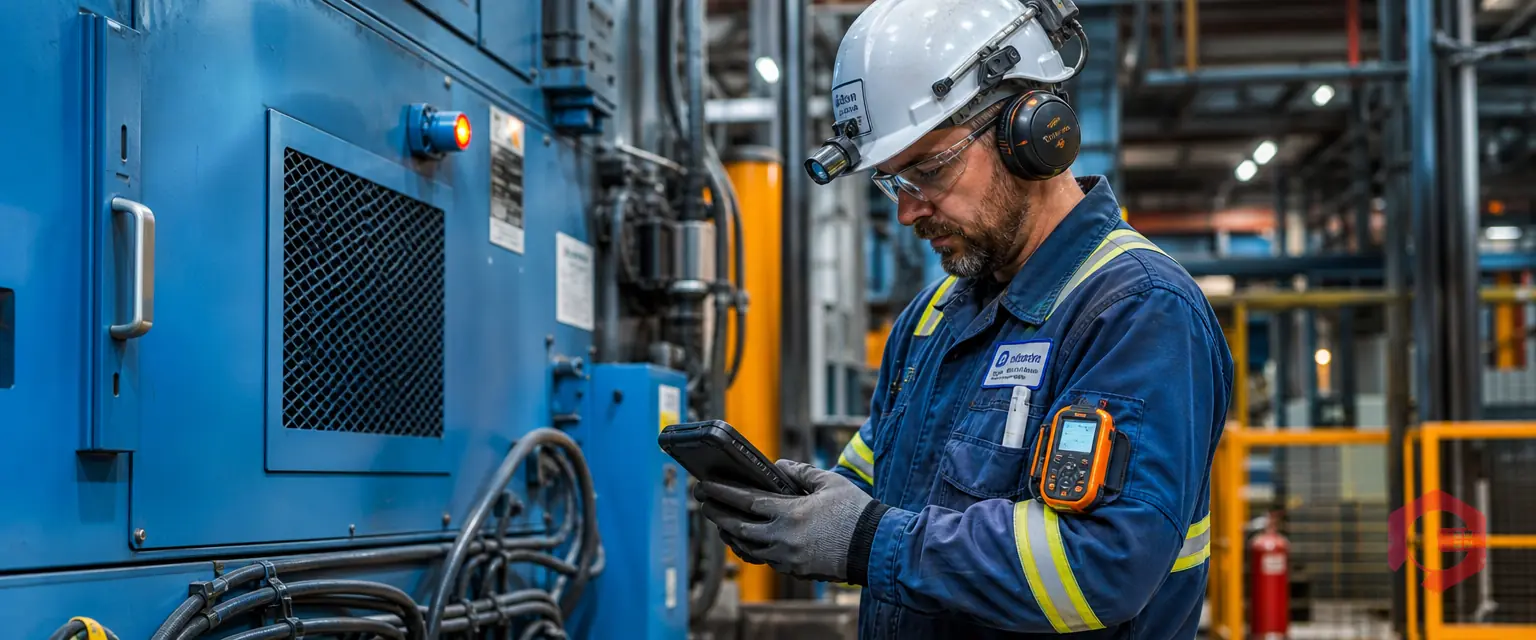
Cryotos AI predicts failures, automates work orders, and simplifies maintenance—before problems slow you down.