How Do You Compare Maintenance KPIs Fairly Across Multiple Plants?

Calendar
Duration:
9 min
calendar today
Published on
November 5, 2026
Featured Image

To compare maintenance KPIs fairly across multiple plants, define each KPI once, clean the data behind it, convert raw numbers into rates, compare plants only within peer groups, and read trends before ranks. Raw figures such as downtime hours or MTTR hide differences in run hours, asset age and data discipline.

This guide explains why plant comparisons mislead, a five-step framework that fixes them, and how a Computerized Maintenance Management System (CMMS) gives every plant the same data foundation.

Key Takeaways

  • Raw totals mislead: Plants differ in size, run hours and asset mix, so raw downtime or cost cannot be ranked.
  • Define and clean first: One KPI dictionary and trusted data matter more than the dashboard that shows your maintenance KPIs.
  • Normalize and segment: Use rates and ratios, and compare plants only against true peers.
  • Trends beat ranks: Compare each plant with its own baseline before you compare plants with each other.

Why Comparing Maintenance KPIs Across Plants Is Hard

Five reasons plant maintenance KPI comparisons are hard | Cryotos

A fair KPI comparison is one that measures every plant with the same definitions, data and operating context. In practice, plants differ on all three, so the same number often means different things.

  • Definitions: One plant counts any stoppage as a failure, while another counts only stoppages over 10 minutes.
  • Clocks: Downtime is measured over 24 hours at one plant and over a 12-hour day at another.
  • Data discipline: Late closure, test records and missing failure codes distort overdue and backlog counts.
  • Asset mix: Older, more complex assets fail more often than newer, simpler ones.
  • Scale: A large plant always shows higher total cost than a small one.

Why honest reporting gets punished in rankings

Plants with strong data habits record every short stop, every near-miss and every late job. Their numbers look worse than those of plants that record little, even when the first plant runs better.

Group leaders who rank on raw numbers teach plants to under-report, which damages every later decision.
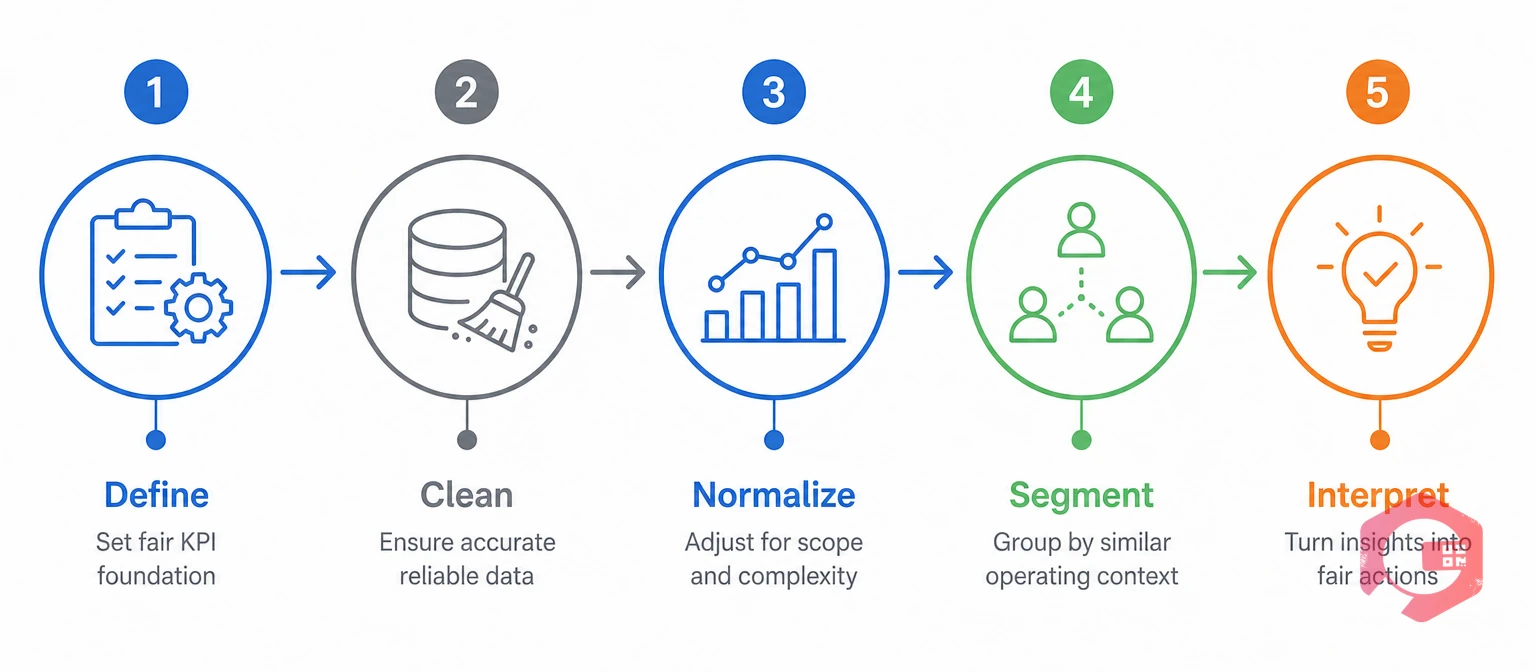
The Five-Step Framework for Fair Plant KPIs

Five-step framework for fair plant KPI comparison | Cryotos

The Fair Comparison Framework is a five-step method that makes plant KPIs comparable. Each step removes one source of unfairness in maintenance KPIs.

The Fair Comparison Framework:

  • Define: Write one KPI dictionary with the formula, scope and clock rules for every plant.
  • Clean: Fix data capture so closure dates, codes and asset IDs can be trusted.
  • Normalize: Turn raw counts into rates, such as availability on planned operating time.
  • Segment: Group plants into peer groups by process, asset profile and operating pattern.
  • Interpret: Read trends and context with each plant lead instead of publishing a league table.

Skipping a step usually shows up later as an argument about whose numbers are right.

Steps 1 and 2: Define Each KPI and Clean the Data

Most problems with maintenance KPIs start with an unwritten definition or a dirty record, so fix both before you build a dashboard.

What a KPI dictionary must fix for every plant

  • Scope: Which assets, work types and plants are included.
  • Clock: When a failure starts and stops, and whether calendar hours or planned operating hours count.
  • Threshold: The smallest stoppage that counts as a failure.
  • PM window: The time rule for calling a preventive task compliant.
  • Work type: How work is labeled as planned, reactive or inspection.

Data checks to run before every review

  • Unique asset IDs: Each failure must attach to the right machine.
  • Failure and downtime codes: Shared lists make causes comparable.
  • Honest timestamps: Late closure inflates repair time and overdue counts.
  • No test records: Trial work orders left open inflate backlog and overdue totals.

In multi-plant rollouts, the largest gap usually appears in the first review, when one plant has hundreds of overdue test records and another has none. Clean the data first, then compare.

See how the report builder lets every plant run the same KPI report from the same fields.
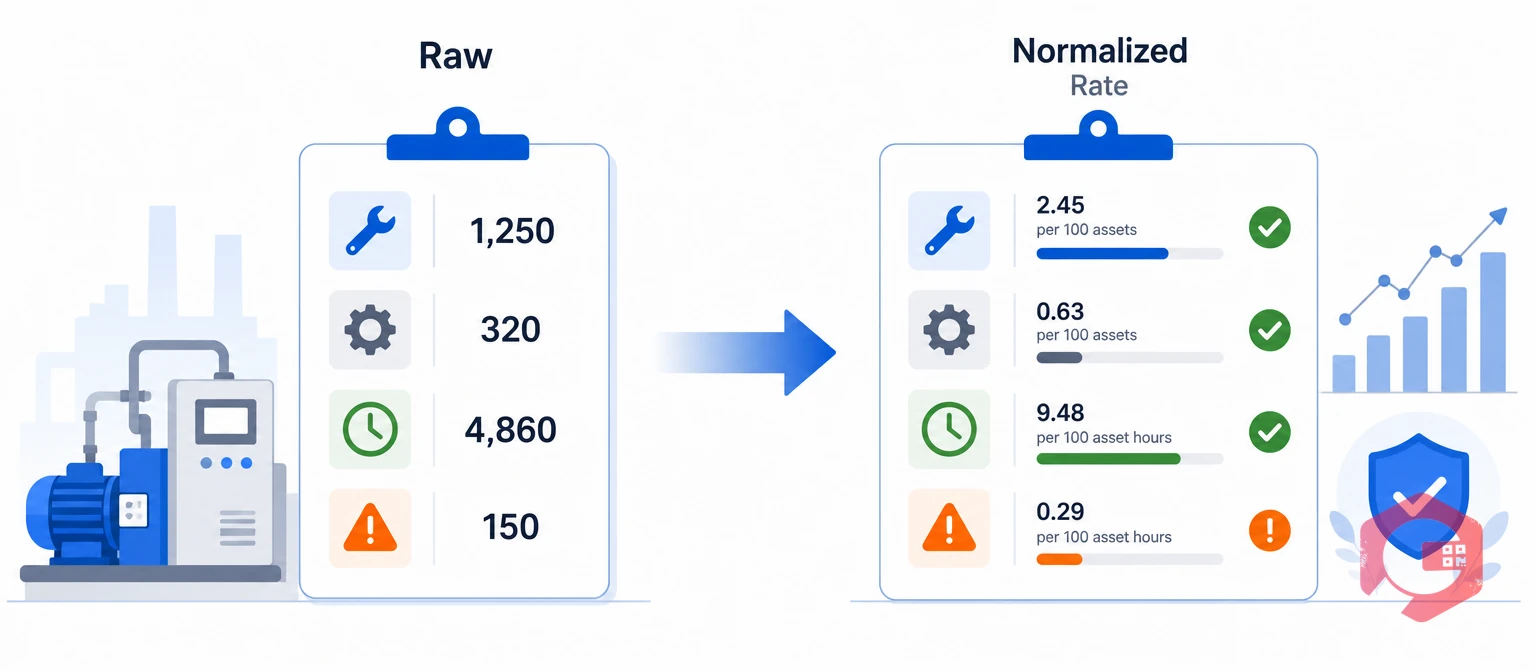
Raw KPIs vs Normalized KPIs: What Changes

Raw maintenance KPIs converted into normalized rates | Cryotos

Normalization is the process of converting a raw number into a rate so plants of different sizes can be compared. The table shows how common maintenance KPIs change once they are normalized.

KPIRaw measureNormalized form
DowntimeTotal hours, which grow with plant sizeAvailability on planned operating time
FailuresA count that depends on asset number and run timeFailures per 1,000 operating hours, or MTBF
Repair speedPlant-wide MTTR, which hides the failure mixMTTR by asset class
Maintenance costTotal spendCost per unit of output, or percent of asset replacement value
PM complianceCount of PMs completedShare completed within the agreed window
BacklogNumber of open work ordersWeeks of backlog against weekly crew capacity
Work mixMaintenance hoursPlanned work as a share of total hours
ClosureCount of work orders closedShare closed on time against due time

Handle composite KPIs such as overall equipment effectiveness (OEE) with care, because each plant may define the quality and performance terms differently.

Step 4: Segment Plants Into Peer Groups

Even a normalized KPI misleads when the plants are very different, so compare each plant with peers that share the main drivers of performance.

  • Process type: Continuous, batch, discrete or assembly.
  • Operating pattern: Hours per day, shifts and planned shutdowns.
  • Asset profile: Average age, complexity and criticality.
  • Maintenance maturity: Share of planned work and quality of data capture.

Inside a peer group, quartiles or variance bands are more useful than a single rank. Report the context next to every number.

The best comparison starts with each plant’s own baseline, because a plant that improved sharply may still sit below a peer.

  • Use variance bands: Flag plants outside the peer range instead of ranking every plant from 1 to N.
  • Pair leading with lagging maintenance KPIs: Downtime and MTTR show past results, while PM compliance and backlog show what is coming.
  • Show context: Put operating hours, asset count and work mix beside each KPI.
  • Assign owners: Name one KPI owner at group level and one data steward per plant.

Treat the dashboard as the start of a conversation with the plant lead, not the final verdict.

A Three-Plant Example: Why Operating Hours Change the Answer

Operating hours change the answer because availability depends on the time a plant planned to run. This hypothetical example compares three plants.

  • Plant A: Runs 24 hours and logs 40 downtime hours in a 720-hour month, so availability is 94.4%.
  • Plant B: Runs a 12-hour day and logs 20 downtime hours in 360 planned hours, so availability is also 94.4%.
  • Plant C: Runs two shifts and logs 24 downtime hours in 480 planned hours, so availability is 95.0%.
  • Raw view: Plant B shows the fewest downtime hours, so it looks like the best performer.
  • Calendar-hour view: If Plants B and C are measured against 720 hours, they show 97.2% and 96.7%, which flatters both.

Plants A and B perform the same, and Plant C is slightly ahead. Only a measure based on planned operating time shows that.

How to Roll Out Fair KPI Reviews Across Plants

A fair comparison program works best when it starts small and grows once the data is trusted.

  • Start with three maintenance KPIs: Availability on planned operating time, PM compliance and on-time closure are the easiest to compare.
  • Agree the dictionary first: Walk through each definition with plant leads before collecting data.
  • Pilot with two peer plants: Fix data gaps in the pilot, then add plants one at a time.
  • Add cost and reliability later: Bring in cost per unit and MTBF once the first set is stable.

Plant leads accept comparisons faster when they helped write the definitions and saw their own data cleaned first.

Common Mistakes That Break Plant KPI Reviews

Most failed comparisons repeat the same few mistakes, and each one is easy to avoid once you can name it.

  • Ranking on raw totals: Normalize first, then compare within peer groups.
  • Letting each plant define its own KPIs: Publish one dictionary and review it yearly.
  • Rewarding low failure counts: Reward complete data and improving trends instead.
  • Using calendar time for plants with different run hours: Use planned operating time as the base.
  • Reading one KPI alone: Read availability together with MTTR and PM compliance.

A short review of this list before each quarterly meeting catches most problems early.

How Cryotos Supports Fair KPI Reviews Across Plants

Cryotos gives multi-plant organizations one platform where every plant records assets, work orders, downtime and PM in the same structure. That common data foundation keeps maintenance KPIs comparable, because every number comes from the same fields and the same workflows.

  • Common asset structure: One register with a hierarchy by location, building, floor and machine line.
  • Standard workflows: Reuse a workflow template across plants by exporting and importing its sections.
  • Downtime and reliability: Downtime tracking by department, plant and asset, with MTTR, MTBF and availability percentage.
  • Dashboards and reports: A BI dashboard and 50+ standard reports, with custom options and scheduled email delivery.
  • Overdue rules: Overdue time that can be set per workflow, such as 24, 48 or 168 hours.
  • Failure coding and access: Issue types with codes, and users mapped to parent and sub-locations.

Maintenance teams using Cryotos have reported up to 30% reduction in unplanned downtime and 25% faster repair turnaround.

Each organization still sets its own KPI dictionary and peer groups. Confirm with Cryotos how to calculate availability against each plant’s planned operating hours before you rely on it for comparison.

Frequently Asked Questions

How do you compare maintenance KPIs across plants?

Define each KPI once, clean the source data and convert raw numbers into rates such as availability on planned operating time. Then compare plants within peer groups and read trends before ranks.

Why can't you rank plants on raw downtime hours?

Raw hours grow with plant size, run time and asset count. A small plant on a 12-hour day will always show fewer hours than a large 24-hour plant, even if both perform equally.

Which maintenance KPIs are easiest to compare across plants?

PM compliance within a shared window, availability on planned operating time and planned work share compare well. Total cost and plant-wide MTTR are harder, because size and failure mix distort them.

What is a peer group in maintenance benchmarking?

A peer group is a set of plants with similar processes, asset profiles and operating patterns. Comparing within a peer group removes the biggest sources of unfairness.

How often should a group review plant KPIs?

Review data quality every month and peer comparisons every quarter. Frequent data checks keep the quarterly comparison trustworthy.

Can a CMMS standardize KPIs across plants?

A CMMS gives every plant the same data structure, workflows and reports. The group must still agree on KPI definitions and peer groups, because software cannot decide those.

Fair comparison starts with common data across every plant. Schedule a free demo to see how Cryotos gives your plants one structure for assets, work orders, downtime and reports.


Want to Try Cryotos CMMS Today?

Get Free Demo

Let AI Take Control of Your Maintenance

Cryotos AI predicts failures, automates work orders, and simplifies maintenance—before problems slow you down.

Try AI-Powered CMMS
🡢