
CMMS dashboards give dealership service managers real-time visibility into SLA performance at the bay level — showing exactly which bays are breaching repair time commitments, by how much, and how often. An SLA breach in a dealership context occurs when a vehicle in a specific service bay exceeds the agreed repair cycle time for its job category, whether that's a 90-minute express service, a 4-hour mechanical repair, or an OEM warranty job with fixed time-to-completion requirements. According to J.D. Power's Customer Service Index, service wait time is the single biggest driver of dealership customer satisfaction scores — and every undetected SLA breach directly erodes those scores.
This guide breaks down exactly how service managers configure CMMS dashboards for per-bay SLA tracking, what widgets to use, how to set breach thresholds, and how breach data feeds back into smarter capacity planning.
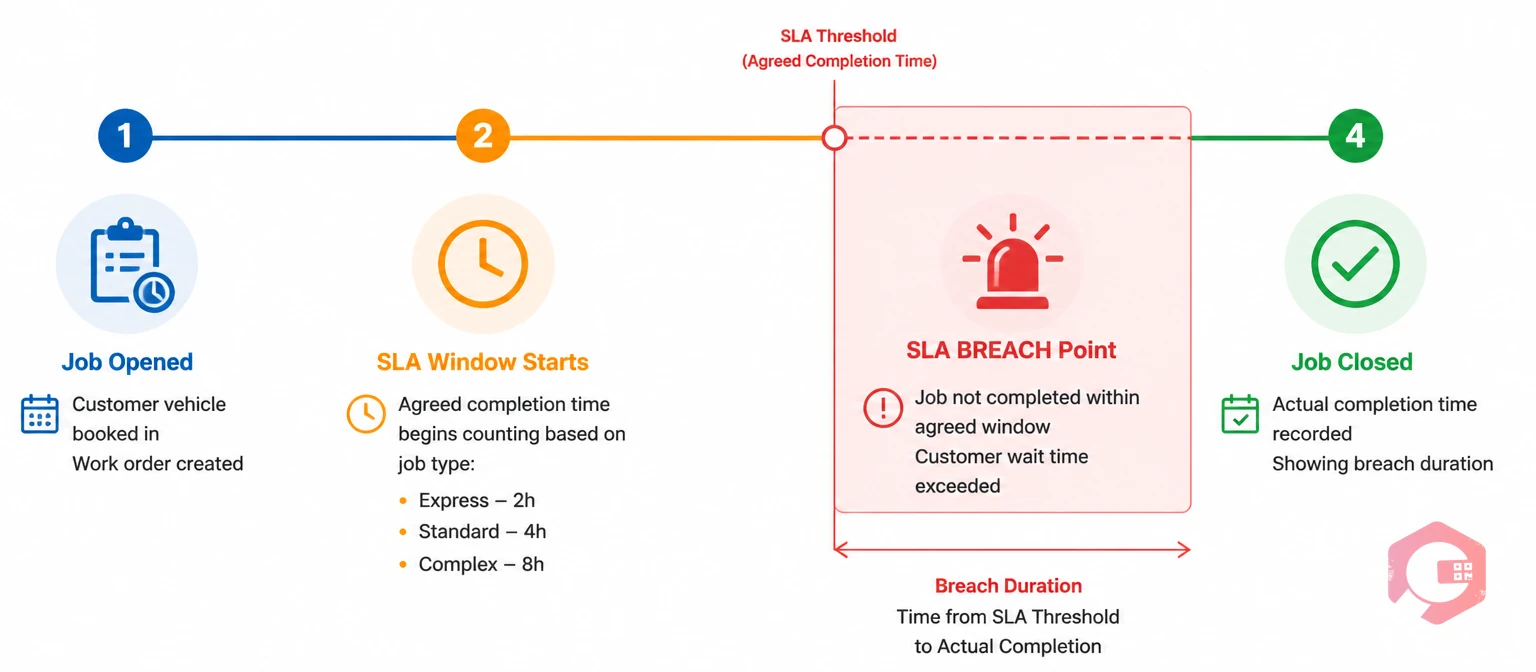
In dealership operations, a Service Level Agreement (SLA) defines the maximum time a vehicle should spend in a specific bay for a given job type before the service commitment is considered broken. An SLA breach fires when that threshold is crossed without the job reaching completion — or without an approved extension logged in the system.
These two terms often get used as synonyms, but they measure different things. A repair order delay is any job that ran longer than planned. An SLA breach is specifically a job that crossed a pre-defined commitment threshold — a threshold that was communicated to the customer or required by the OEM. The distinction matters because not every delay is a breach. A job that was estimated at 3 hours and ran 3.5 hours may not breach any SLA. A 90-minute express oil change that reaches 2 hours and 15 minutes almost certainly does.
CMMS dashboards track SLA breaches — not delays — because breaches carry consequences: customer dissatisfaction, OEM audit flags, warranty processing penalties, and service advisor accountability triggers. Delays are a performance issue; breaches are a commitment issue.
SLA targets vary by bay function. Most franchised dealerships operate with thresholds like these:
Most DMS reporting surfaces SLA compliance as a dealership-wide average — and that number almost always looks acceptable, even when individual bays are consistently failing. A single high-performing express bay can mask three mechanical bays with chronic breach problems. The average hides the pattern.
Per-bay tracking exposes what the average conceals. When a service manager can see that Bay 4 breaches its 4-hour mechanical SLA 60% of the time on Monday mornings, that's actionable intelligence. It might indicate a parts availability problem, a technician scheduling gap, or a job-type mismatch — where Bay 4 is being assigned work that doesn't match the technician's skill certification. None of that surfaces in a dealership-wide average.
Granular bay-level data also enables fair accountability. A technician in Bay 7 shouldn't carry the SLA breach rate of a parts delay that's outside their control. A properly configured BI dashboard separates breach causes — technician-caused, parts-caused, diagnostic-caused — so managers respond to the right problem, not just the symptom.

A well-configured CMMS service dashboard doesn't show everything — it shows the right things, updated in real time, in a layout a service manager can scan in under 60 seconds during a busy morning. Here's what that means in practice.
These are the six widgets that directly surface SLA breach risk before and after it occurs:
Not all breaches are equal. A 15-minute overrun on a mechanical repair is operationally different from a 3-hour overrun on an express service with a customer waiting on-site. Tiering breach severity lets managers respond proportionately:
| Severity Tier | Breach Duration | Escalation Action |
|---|---|---|
| Amber — Warning | Within 15 minutes of SLA threshold | Auto-alert to service advisor; advisor updates customer ETA |
| Red — Active Breach | 0–30 minutes past SLA threshold | Alert to service manager; technician prompted to log status update |
| Critical — Escalated | 30–60 minutes past SLA threshold | Service manager notified via mobile; customer contact required; cause logged |
| Major — Executive Breach | 60+ minutes past SLA threshold | Service director notified; root cause analysis initiated; goodwill offer triggered |
The tiering logic is configured once in the CMMS and applies automatically to every active job across every bay — no manual monitoring required after setup.
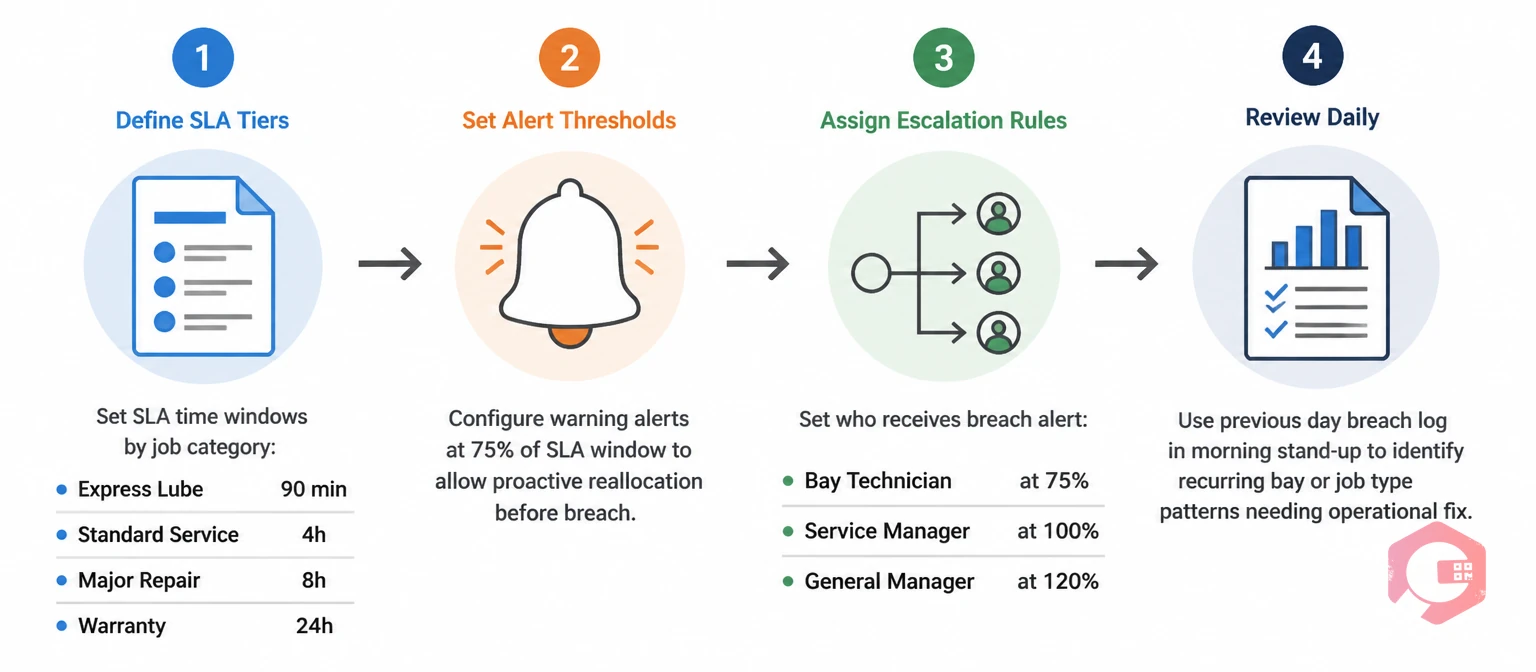
Configuration takes three steps. Done correctly once, the system runs itself — alerts fire, escalations trigger, and breach data accumulates for trend analysis without anyone having to remember to check a spreadsheet.
Start by mapping every bay to its primary job type and setting a time target for each combination. Bay 1 (express) gets a 90-minute SLA for oil changes and a 45-minute SLA for tyre rotations. Bay 5 (mechanical) gets a 4-hour SLA for standard services and a 6-hour SLA for diagnostic-plus-repair jobs. Warranty bays get their SLA populated from the OEM's flat-rate time allowance for each operation code.
This mapping is the foundation of the whole system. Vague SLAs — "we try to finish in a few hours" — can't be tracked, breached, or improved. Specific, bay-level targets can. The work order management software module stores these targets against job types, so every new repair order automatically inherits the right SLA threshold at creation.
Once targets are set, configure the warning and breach thresholds for each tier. Most CMMS platforms let you set both a percentage-of-SLA warning (e.g., alert at 80% of SLA elapsed) and an absolute-time breach trigger. Set notification recipients at each tier — service advisor at warning, service manager at active breach, service director at escalated and major.
Alerts should reach the right person through the right channel. A service advisor standing on the floor needs a mobile push notification, not an email. A service director reviewing the week's performance needs an email summary with breach counts and root causes. The Email and WhatsApp notification builder in Cryotos lets you configure exactly this — different formats, different channels, different recipients — for each breach tier, without writing a line of code.
An alert without a required response is just noise. The escalation workflow defines what must happen when each breach tier fires: who must acknowledge the alert, what information must be logged (cause category, customer contact made yes/no, estimated new completion time), and what triggers the next escalation level if the first response doesn't close the breach.
This workflow is configured using workflow automation software — a no-code sequence that chains alert → response requirement → escalation → resolution logging into a single automated process. The result is that every breach, no matter how minor, has a documented cause and a logged resolution. That data feeds directly into the weekly service review and into the trend analysis that drives scheduling decisions.
Breach data is more than a performance report — it's a demand signal. When Bay 3 breaches its 4-hour SLA every Tuesday and Wednesday afternoon, that's telling you Tuesday and Wednesday afternoons are over-scheduled for Bay 3's job type. The fix might be adding a second technician to that bay on those afternoons, capping the number of same-day bookings for that slot, or rerouting certain job types to a different bay.
A well-implemented CMMS surfaces these patterns through the Breach Rate Trend Chart over rolling 30 and 90-day windows. Service managers who review this data monthly consistently find 2–3 scheduling optimisations that reduce breach rates by 15–25% without adding headcount or infrastructure. According to McKinsey's automotive service research, dealerships that use real-time operations data to drive scheduling decisions achieve 18% higher service throughput than those relying on historical averages alone.
Breach data also directly informs the conversation with OEM field representatives during periodic dealer performance reviews. Having bay-level SLA compliance data — with root causes documented — shifts the conversation from "why are your scores low" to "here's exactly where the constraint is and what we're doing about it." That credibility matters for warranty reimbursement rates and program bonuses.
Most dealerships already have DMS reporting. Many service managers assume that covers their SLA tracking needs. It doesn't — and understanding the gap explains why a separate CMMS dashboard layer is necessary:
| Capability | DMS Reporting | CMMS Dashboard |
|---|---|---|
| Data Refresh Rate | End-of-day or manual pull | Real-time, continuous |
| SLA Breach Alerts | Not available — post-hoc reporting only | Live alerts at configurable thresholds |
| Per-Bay Granularity | Dealership-wide or per-technician only | Per bay, per job type, per technician |
| Escalation Workflow | Manual — manager must check and act | Automated — triggers defined actions at each breach tier |
| Breach Cause Logging | Not captured — only completion times | Mandatory cause category logged with every breach |
| Trend Analysis | Month-end reports; no pattern detection | Rolling 7/30/90-day trend charts per bay |
| Mobile Access | Limited or desktop-only | Full mobile app with real-time notifications |
DMS and CMMS serve different purposes. The DMS manages transactions — repair orders, parts invoicing, customer records. The CMMS manages operations — job progress, bay utilization, SLA compliance, maintenance workflows. Both are necessary; they answer different questions.
Cryotos CMMS is built around the premise that operational visibility should be real-time and specific — not end-of-day and aggregate. The BI Dashboard lets service managers configure bay-level views that show live SLA status, time-to-breach countdowns, and open breach logs alongside technician utilization and job completion rates — all on a single screen that updates continuously without manual refresh.
SLA thresholds are configured at the job type and bay level, and the alert engine handles the rest. When a job crosses the amber threshold, the assigned service advisor receives a mobile push notification. When it breaches, the service manager gets an alert via mobile, email, or WhatsApp — their choice. When it hits critical, the escalation workflow fires automatically: cause logging is required before the breach can be acknowledged, ensuring every breach has a documented root cause that feeds into the trend analysis.
The Report Builder generates breach summary reports on any schedule — daily bay scorecards, weekly trend analyses, monthly OEM compliance summaries — formatted for the right audience and delivered automatically. Service managers stop chasing data and start acting on it. The result: teams using Cryotos report a 30% reduction in unplanned downtime and measurable improvement in service throughput within the first quarter of deployment.
For dealerships managing multiple rooftops, Cryotos gives the fixed operations director a single consolidated dashboard showing SLA compliance across every location — with drill-down to individual bay performance at any site. That multi-location visibility is something no DMS provides out of the box.
Express bays should target 60–90 minutes for routine services. Mechanical bays typically run 3–6 hours depending on job complexity, with a 4-hour target as a sensible default for standard service jobs. Warranty bays should use the OEM's published flat-rate time as their SLA target, since that's the benchmark used for reimbursement. The right target is the one your team can consistently meet at current capacity — set it too tight and you manufacture breaches; too loose and it stops being a useful accountability tool.
A DMS dashboard shows transaction data — repair orders opened and closed, parts invoiced, revenue per service advisor. A CMMS dashboard shows operational data — active jobs, bay status, time elapsed against SLA, breach alerts, and escalation triggers. Both are useful; they answer fundamentally different questions. The DMS tells you what happened yesterday; the CMMS tells you what's happening right now and what's about to go wrong.
Yes — and they should. Warranty work carries OEM-defined time requirements and financial penalties for non-compliance that are distinct from customer-pay SLAs. A properly configured CMMS assigns different SLA thresholds to warranty op codes vs. customer-pay job types, tracks them separately in the dashboard, and generates separate breach reports. This separation is essential for OEM compliance reviews, where warranty SLA performance is tracked independently of overall service metrics.
Daily at minimum — the live dashboard should be visible on the service manager's screen throughout the day. Weekly, the breach trend data should be reviewed as part of the service department performance meeting: which bays are improving, which are static, and what scheduling or staffing changes are indicated. Monthly, the aggregated breach data should feed into capacity planning and OEM reporting. The daily view is for real-time response; the weekly and monthly views are for structural improvement.
Dealership-wide SLA averages tell you almost nothing useful. Per-bay SLA breach data tells you exactly where your service operation is failing, why it's failing, and which interventions will actually fix it. The shift from aggregate reporting to bay-level breach tracking is the single most impactful change most service managers can make to their operational visibility — and a CMMS dashboard makes that shift practical rather than theoretical.
Cryotos CMMS gives dealership service managers the real-time breach alerts, per-bay granularity, and automated escalation workflows needed to catch SLA failures before they damage customer relationships or OEM standing. Cryotos CMMS is purpose-built for operations teams that need more than a DMS can offer. Book a free demo today and see your service bays in real time.


Cryotos AI predicts failures, automates work orders, and simplifies maintenance—before problems slow you down.


