Buildings account for approximately 40% of global energy-related CO2 emissions, according to the International Energy Agency — and the facility management team is the operational layer responsible for how much of that 40% any given building actually produces. Yet when the sustainability report is due, many FM teams face the same problem: the carbon-relevant operational data they need exists inside their CMMS, but it has never been structured for carbon reporting purposes. Meter readings, fuel consumption logs, refrigerant top-up records, equipment runtime data, and maintenance frequency records all contain emissions-relevant information — but it takes a deliberate configuration of the CMMS and a clear understanding of which data maps to which reporting scope to extract it in a form that satisfies frameworks like the GHG Protocol, SECR, or CSRD.
This guide shows facility managers exactly how to use CMMS data for net-zero carbon reporting — which data types map to Scope 1, 2, and 3 emissions, how maintenance quality affects carbon output, and how to build the reporting workflow that turns operational records into auditable sustainability evidence.
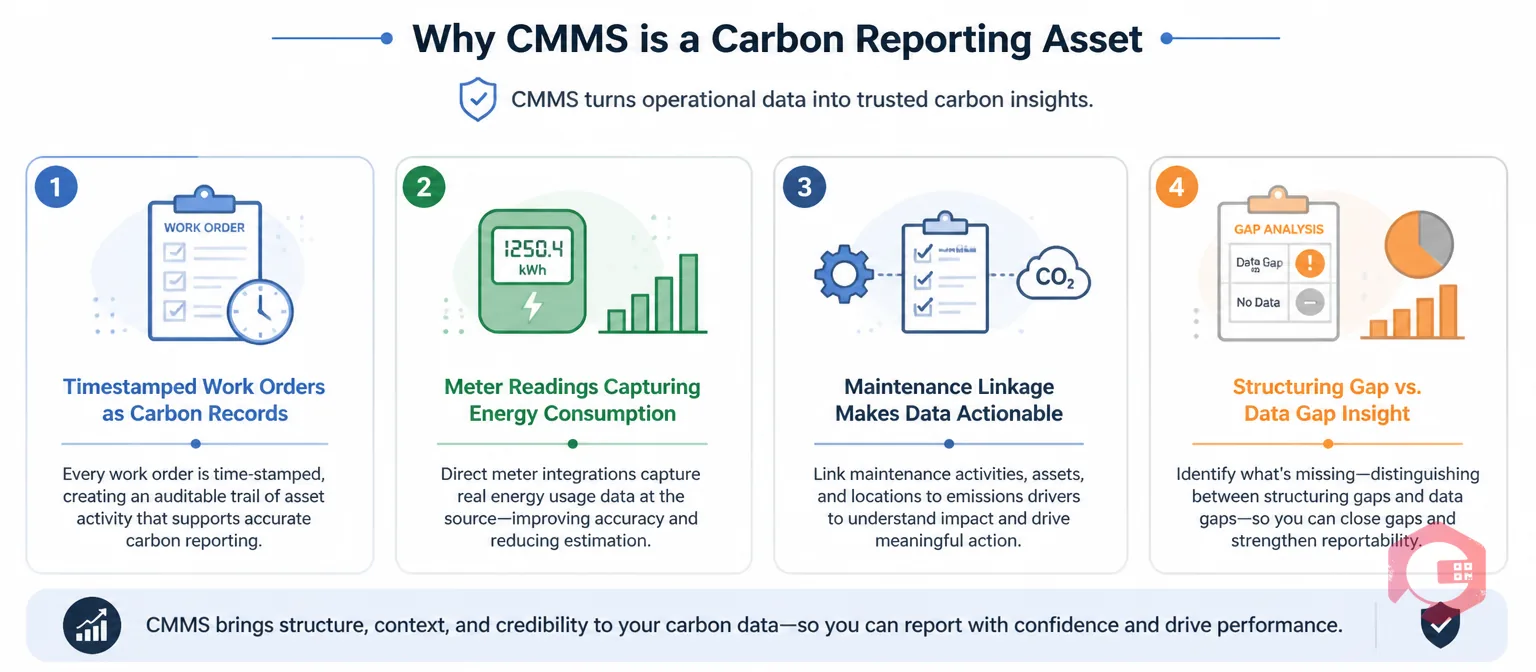
A CMMS records the operational activity of a building's physical systems in granular, timestamped detail. Every work order, every PM completion, every meter reading submission, every parts consumption record, and every equipment downtime event is a data point about how the building's energy and resource systems performed. That operational record is, by a different reading, a carbon record — it captures the activities that generate, consume, and sometimes avoid emissions.
The gap that exists in most FM operations is not a data gap — it is a structuring gap. The CMMS contains the data; it just hasn't been tagged, categorised, and reported in the way that carbon frameworks require. Closing that gap doesn't require a separate sustainability system. It requires configuring the existing CMMS to capture energy and emissions-relevant attributes against the maintenance records it's already creating, and then running the right reports against those attributes at reporting intervals.
The operational advantage of using CMMS data for carbon reporting — rather than manual utility bill aggregation or separate energy management software — is the maintenance linkage. CMMS data doesn't just show how much energy was consumed; it shows which assets consumed it, in what operational state, under what maintenance condition. That linkage is what makes CMMS-sourced carbon data actionable rather than merely reportable.
Carbon reporting under the GHG Protocol Corporate Standard — the framework underpinning SECR, TCFD, and CSRD disclosure — organises emissions into three scopes. Understanding which scope applies to which FM activity determines which CMMS data fields are carbon-relevant and how they should be structured for reporting.
Scope 1 covers greenhouse gas emissions that are directly generated by sources owned or controlled by the reporting organisation. In a facilities context, Scope 1 sources include: combustion of natural gas in on-site boilers, generators, and gas-fired HVAC units; diesel consumption in on-site generators and backup power systems; fugitive refrigerant emissions from cooling and refrigeration plant (F-gases, which are potent greenhouse gases with global warming potentials hundreds to thousands of times higher than CO2); and combustion from any on-site vehicles or plant in the FM team's direct operational control.
CMMS data relevant to Scope 1 includes: gas meter readings (captured as recurring meter reading tasks), diesel consumption logs attached to generator PM work orders, refrigerant top-up quantities recorded in HVAC maintenance work orders (converted to CO2-equivalent using the relevant F-gas GWP factor), and fuel consumption records for any site vehicles maintained through the CMMS asset register.
Scope 2 covers indirect emissions from the generation of purchased electricity, steam, heating, or cooling consumed by the organisation. In most commercial FM operations, purchased electricity is the dominant Scope 2 source — the emissions factor applied to each kWh consumed varies by grid region and year, and is published annually by national environmental regulators.
CMMS data relevant to Scope 2 includes: electricity meter readings submitted through the CMMS meter reading module, equipment runtime data for high-consumption assets (chillers, AHUs, pumping systems) where sub-metering is available, and energy consumption benchmarks recorded before and after energy-reduction maintenance interventions.
Scope 3 covers all other indirect emissions in the value chain. For FM operations, the most commonly reportable Scope 3 categories include: emissions from the manufacture, transport, and disposal of spare parts and materials consumed in maintenance (Scope 3, Category 1 — Purchased Goods and Services); emissions from contractor travel to site for maintenance visits (Scope 3, Category 4 — Upstream Transportation, and Category 6 — Business Travel); and emissions from the disposal of waste generated by maintenance activities, including refrigerant disposal, lamp disposal, and general maintenance waste (Scope 3, Category 5 — Waste Generated in Operations).
Scope 3 is the most complex category to report, and CMMS data provides a structured starting point — parts consumption records, contractor visit logs, and waste disposal records attached to work orders all contain the activity data from which Scope 3 estimates can be derived using published emission factors.
The following mapping provides FM teams with a practical reference for configuring CMMS data capture to support carbon reporting. Not every CMMS will capture all of these data types by default — some require configuration of custom fields or recurring task templates:
| CMMS Data Type | Emission Scope | Carbon Reporting Use |
|---|---|---|
| Gas meter readings (boilers, AHUs, generators) | Scope 1 | kWh consumed × gas emission factor = CO2e per period |
| Diesel consumption logs (generators, site vehicles) | Scope 1 | Litres consumed × diesel emission factor = CO2e per period |
| Refrigerant top-up quantities (HVAC PM records) | Scope 1 | kg refrigerant × GWP factor = CO2e fugitive emission |
| Electricity meter readings (whole building, sub-metered) | Scope 2 | kWh consumed × grid emission factor = CO2e per period |
| High-consumption asset runtime data (chillers, AHUs) | Scope 2 | Asset-level energy attribution for carbon hotspot identification |
| Spare parts and materials consumed per work order | Scope 3, Cat. 1 | Materials quantity × embodied carbon factor = CO2e estimate |
| Contractor visit records (travel distance or mode) | Scope 3, Cat. 6 | Visit km × transport emission factor = CO2e estimate |
| Maintenance waste disposal records | Scope 3, Cat. 5 | Waste kg by category × disposal emission factor = CO2e |
Each row in this table represents a data capture requirement in the CMMS. Where the data is already being captured — meter readings, parts consumption, work order records — the additional step is tagging the relevant fields with carbon reporting attributes. Where the data is not yet captured — contractor travel distance, refrigerant quantities — a custom field or task template needs to be configured to collect it.
CMMS data for carbon reporting isn't only about measuring emissions — it's about demonstrating that maintenance decisions are actively reducing them. This is the dimension that separates a CMMS-supported carbon report from a utility bill summary.
Equipment that is poorly maintained consumes significantly more energy than equipment running at design efficiency. Dirty HVAC filters increase fan motor load; fouled heat exchanger coils reduce thermal transfer efficiency and increase compressor run time; scaled boiler heat exchangers require higher firing rates to achieve the same heat output. Research by the US Department of Energy estimates that poorly maintained building equipment consumes 15–30% more energy than well-maintained equivalents — meaning a building with a reactive maintenance culture has a structurally higher carbon output than a building with an active preventive maintenance programme, for the same occupancy and operational profile.
CMMS preventive maintenance completion data captures this difference. An FM team reporting 95% PM completion rate on HVAC and building services assets has documented evidence that their maintenance programme is actively managing equipment efficiency — and therefore actively suppressing emissions relative to a reactive baseline. That evidence is a carbon management narrative, not just an operational one. The preventive maintenance software module generates PM completion reports that can be incorporated directly into the sustainability reporting pack as evidence of carbon-reducing maintenance activity.
Fugitive refrigerant emissions are among the most significant Scope 1 sources in commercial FM operations and one of the most under-reported. Common HFC refrigerants — R410A, R134a, R32 — have Global Warming Potentials between 675 and 2,088 times that of CO2. A single kilogram of R410A released to atmosphere is equivalent to approximately 2,088 kg of CO2. In a large commercial building with multiple VRF systems, chillers, and precision cooling units, annual refrigerant top-up volumes can represent a material share of total Scope 1 emissions.
CMMS work order records for HVAC PM and reactive refrigerant charging capture the quantity and type of refrigerant added to each system on each visit — the foundational data for fugitive emission calculations. Configuring the HVAC PM task template to capture refrigerant type and quantity as mandatory fields at task completion creates a complete, auditable refrigerant consumption record across the asset portfolio, automatically, without a separate tracking system.
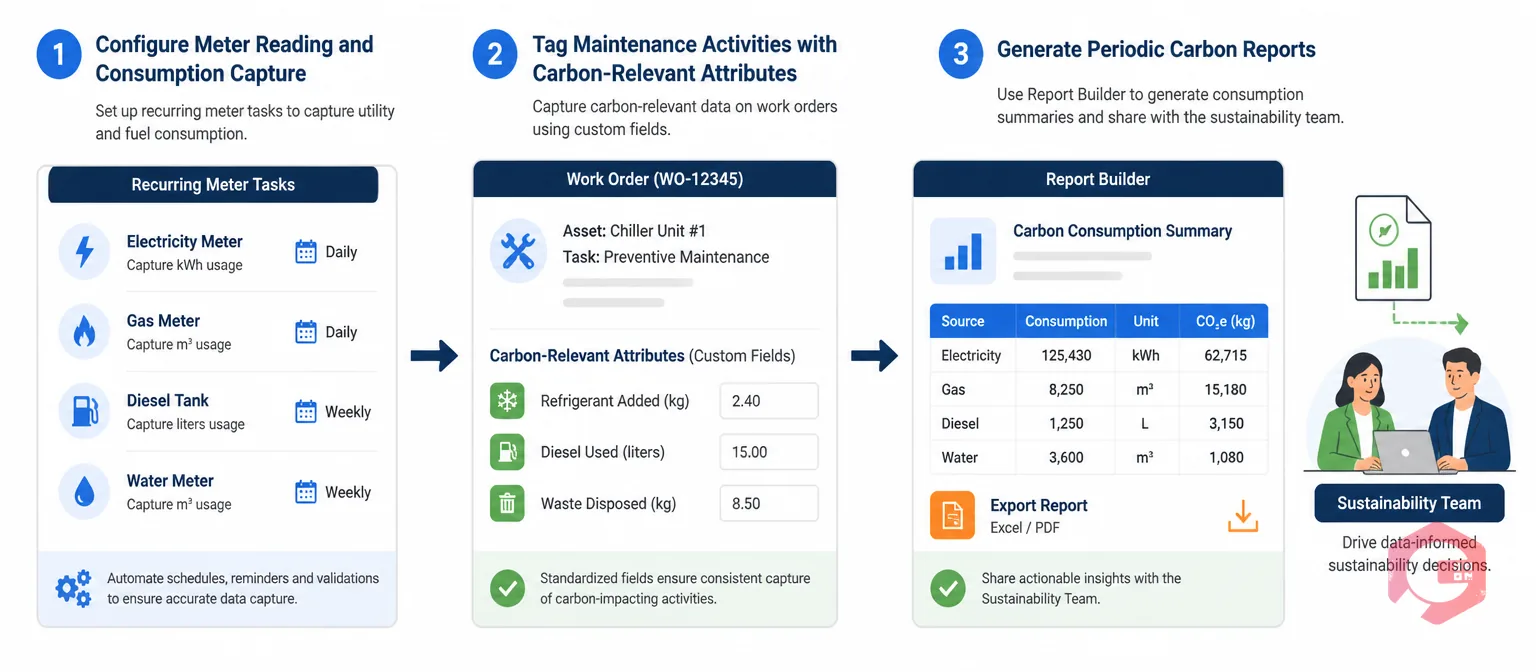
Turning CMMS operational records into carbon report inputs is a three-step configuration and reporting workflow. Done once, it produces structured carbon-relevant data at every subsequent reporting period without additional data gathering effort.
Set up recurring meter reading tasks in the CMMS for every energy and fuel meter in the building — electricity (whole building and key sub-meters), gas, diesel, and water. The reading frequency should match your reporting interval: monthly reads for quarterly reporting, weekly reads for monthly reporting. Each meter reading task captures the meter reference, reading value, units, and date. Over a reporting period, the cumulative readings produce the consumption data from which Scope 1 and 2 emissions are calculated by applying the relevant emission factors.
For buildings with BMS-integrated metering, the CMMS can receive meter readings automatically via API, eliminating manual read tasks while retaining the structured, auditable consumption record in the CMMS database. The meter reading module stores every reading with its timestamp, submitting user, and asset reference — creating the chain of custody that verified carbon reporting requires.
For carbon-relevant maintenance activities — HVAC service, generator PM, refrigerant work, waste disposal — add custom fields to the relevant work order or PM task templates that capture the carbon-reportable quantities: refrigerant type and kg added, diesel litres consumed, materials disposed and disposal route, contractor visit mode of transport. These fields are completed by the technician or contractor at task closure, using the same mobile interface as the rest of the work order — no separate data entry required.
The key discipline is making these fields mandatory for the relevant task types rather than optional. Optional fields produce incomplete records; mandatory fields produce complete ones. The work order management software module enforces mandatory field completion at task closure, ensuring every HVAC service record contains the refrigerant data and every generator PM record contains the diesel consumption data needed for Scope 1 reporting.
At each reporting interval, the Report Builder generates the consumption and activity summaries needed to populate the carbon report: total gas and electricity consumption by meter and period, total refrigerant additions by system and refrigerant type, total diesel consumption by asset, PM completion rates by asset category, and any other configured carbon-attribute summaries. These reports are exported in a format compatible with the carbon calculation tools used by the sustainability or finance team — the FM function provides the activity data; the carbon conversion (applying emission factors from published sources like the UK Government GHG Conversion Factors) is applied at the reporting stage.
Three regulatory frameworks are currently the most relevant for UK and EU-operating organisations with FM functions that need to report operational carbon data. CMMS data is directly applicable to all three.
The Streamlined Energy and Carbon Reporting (SECR) framework, mandatory for large UK companies since 2019, requires disclosure of Scope 1 and Scope 2 emissions alongside energy consumption data, with a narrative description of energy efficiency actions taken. CMMS meter reading data (for energy consumption) and PM completion data (for the efficiency actions narrative) directly satisfy the two core evidence requirements of SECR.
The Task Force on Climate-related Financial Disclosures (TCFD) framework, now mandatory for large UK-listed companies and financial institutions, requires physical and transition climate risk disclosure alongside metrics and targets. FM teams contribute to the metrics and targets pillar through operational energy and emissions data — which CMMS records provide in the structured, period-comparable format TCFD requires.
The EU Corporate Sustainability Reporting Directive (CSRD), phasing in from 2024, requires disclosure under the European Sustainability Reporting Standards (ESRS), including energy consumption, GHG emissions by scope, and energy intensity metrics. The granularity of data required under CSRD is higher than SECR — sub-metered asset-level data, refrigerant records, and Scope 3 supply chain estimates are all within scope. A well-configured CMMS is the operational data infrastructure that makes CSRD-level FM data collation manageable rather than overwhelming.

Cryotos CMMS gives FM teams the data infrastructure to turn routine maintenance operations into a structured carbon evidence base. The meter reading module supports recurring consumption capture across electricity, gas, diesel, and water meters — with readings stored against asset references and accessible for period-comparison reporting without manual data aggregation. Configurable custom fields on work order and PM templates enable refrigerant quantity capture, fuel consumption logging, and waste disposal recording at the point of task completion, creating mandatory, timestamped, technician-attributed records that satisfy the audit trail requirements of verified carbon reporting.
The BI Dashboard gives FM managers a live view of energy consumption trends, PM completion rates by asset category, and open work orders against carbon-critical assets — so the carbon performance story is visible throughout the year, not reconstructed at reporting time. Consumption trend charts surface emerging deviations — an HVAC system consuming 20% above its baseline in March is an efficiency problem that shows up in the dashboard in March, not in the annual carbon report in January of the following year.
The Report Builder generates period-specific carbon data exports on any schedule — quarterly for SECR, annual for TCFD and CSRD, or monthly for internal net-zero progress tracking. Reports are formatted for the sustainability team's calculation tools rather than requiring manual rekeying from the CMMS interface. For FM teams managing multiple sites, Cryotos provides consolidated carbon-relevant data across the portfolio in a single report — site-by-site consumption, PM completion, and refrigerant usage — without requiring site-level data requests. Teams using Cryotos report a 30% reduction in unplanned downtime, with measurable energy efficiency improvement in maintained assets cited as a contributing factor to reduced Scope 1 and 2 emissions intensity.
For Scope 1: gas and diesel consumption logs, refrigerant top-up quantities by refrigerant type (converted to CO2-equivalent using GWP factors), and any on-site combustion records. For Scope 2: electricity meter readings, and sub-metered consumption data for high-energy assets where available. For Scope 3: spare parts and materials quantities consumed in maintenance (for embodied carbon estimates), contractor travel records where captured, and maintenance waste disposal records by waste category. Not all CMMS systems capture Scope 3 data by default — the FM team needs to configure custom fields on work order templates to collect contractor travel and materials data at task closure.
CMMS data provides the activity data — consumption quantities, fuel volumes, refrigerant quantities — that is the input to SECR and CSRD carbon calculations. The activity data from the CMMS is converted to CO2-equivalent by applying published emission factors (UK Government GHG Conversion Factors for SECR; ESRS-aligned factors for CSRD). The CMMS data itself does not produce the final emissions figure — that calculation is performed by the sustainability or finance team using the CMMS export as the activity data source. For verified or third-party assured reporting, the CMMS provides the audit trail — timestamped meter readings, work order records, and task completion evidence — that assurance providers examine to confirm the data is complete and attributable.
Preventive maintenance reduces carbon output through two mechanisms. First, it maintains equipment at designed efficiency — clean filters, calibrated controls, unscaled heat exchangers — which reduces energy consumption relative to degraded-condition operation. Second, it reduces the frequency of reactive failures that require additional maintenance interventions, parts, contractor visits, and sometimes equipment replacement — each of which carries its own carbon cost. The cumulative effect of a high-compliance PM programme on HVAC, boilers, and pumping systems is measurably lower energy consumption per unit of building output — and lower energy consumption means lower Scope 1 and Scope 2 emissions, all else equal.
CMMS-sourced carbon data is as accurate as the meter readings and work order records it captures. Manual meter reads submitted through the mobile app introduce the same human error risks as any manual read process; BMS-integrated automated reads are more accurate. Refrigerant quantities captured at task closure are accurate to the technician's record of what was added — which is also the record they submit for F-gas compliance purposes, providing a cross-check. For third-party assured reporting, assurance providers typically sample-check meter readings against billing data and work order records against site logs. A well-configured CMMS with mandatory fields and timestamped records provides a defensible audit trail — which is what assurance providers require, not analytical perfection.
CMMS data is not a byproduct of maintenance operations — it is an operational record of the activities that produce, consume, and sometimes avoid carbon emissions. The FM team that configures their CMMS to capture carbon-relevant data at the point of maintenance activity, and reports against it at regular intervals, is building the evidentiary foundation that net-zero commitments require. They are also discovering, month by month, where the biggest emission reduction opportunities sit — in underperforming equipment, in refrigerant-heavy systems, in reactive maintenance that could be prevented.
For FM teams ready to turn their maintenance records into a carbon reporting infrastructure, Cryotos CMMS provides the meter reading capture, configurable work order fields, and reporting tools to make that transition practical. Book a free demo today and see how your CMMS data can serve your net-zero commitments.


Cryotos AI predicts failures, automates work orders, and simplifies maintenance—before problems slow you down.


