
A CMMS delivers measurable ROI in under 12 months when you correctly account for four cost categories: downtime reduction, labor efficiency gains, parts and inventory savings, and compliance cost avoidance. The standard ROI formula is straightforward — (Total Annual Savings − Annual CMMS Cost) ÷ Annual CMMS Cost × 100 — but most business cases fail because they undercount savings, not because the numbers don't work.
According to research from Reliable Plant, reactive maintenance costs 3–5 times more per repair event than the equivalent preventive task. On a mid-size manufacturing facility spending $500,000 annually on maintenance, shifting even 20% of reactive spend to planned maintenance produces $100,000+ in annual savings.
The typical CMMS proposal goes to finance with one number: the software cost. Without a structured ROI model, the answer to what changes is vague — "fewer breakdowns," "better visibility," "less paper." These aren't numbers. They don't get budget approval. The solution is a structured four-pillar framework that converts each benefit category into a specific dollar figure.

Unplanned downtime is the single largest CMMS ROI driver. A structured preventive maintenance program reduces unplanned failures by 30–50% within 12 months. Cryotos's dedicated downtime tracking module gives you the baseline data needed: BDH, MTTR, and MTBF by department, plant, and asset.
In most facilities without a CMMS, maintenance technicians spend only 25–35% of available hours on actual repair work. A well-implemented CMMS typically raises wrench time to 50–55% within 6–12 months. On a team of 10 technicians earning $50,000/year each, raising wrench time from 30% to 50% is equivalent to gaining the productive output of two full-time technicians — roughly $100,000 in labor value — without adding headcount.
Industry estimates put carrying costs at 20–30% of inventory value annually. A CMMS with integrated inventory management tracks real-time stock levels, consumption rates, and reorder points. Facilities typically achieve 15–25% inventory reduction within the first year. Eliminating even a handful of emergency parts orders per quarter produces significant savings — these orders typically cost 3–5x the normal part price.
A single OSHA serious citation carries penalties up to $16,131 per violation. Willful violations can reach $161,323. Workplace accidents cost an average of $42,000 in direct costs per incident. A CMMS addresses compliance risk by automating inspection schedules, embedding PTW and LOTO procedures directly into work orders, and maintaining a tamper-evident audit trail. Conservative estimate: one avoided citation + one avoided incident = $58,000+ in a single year.
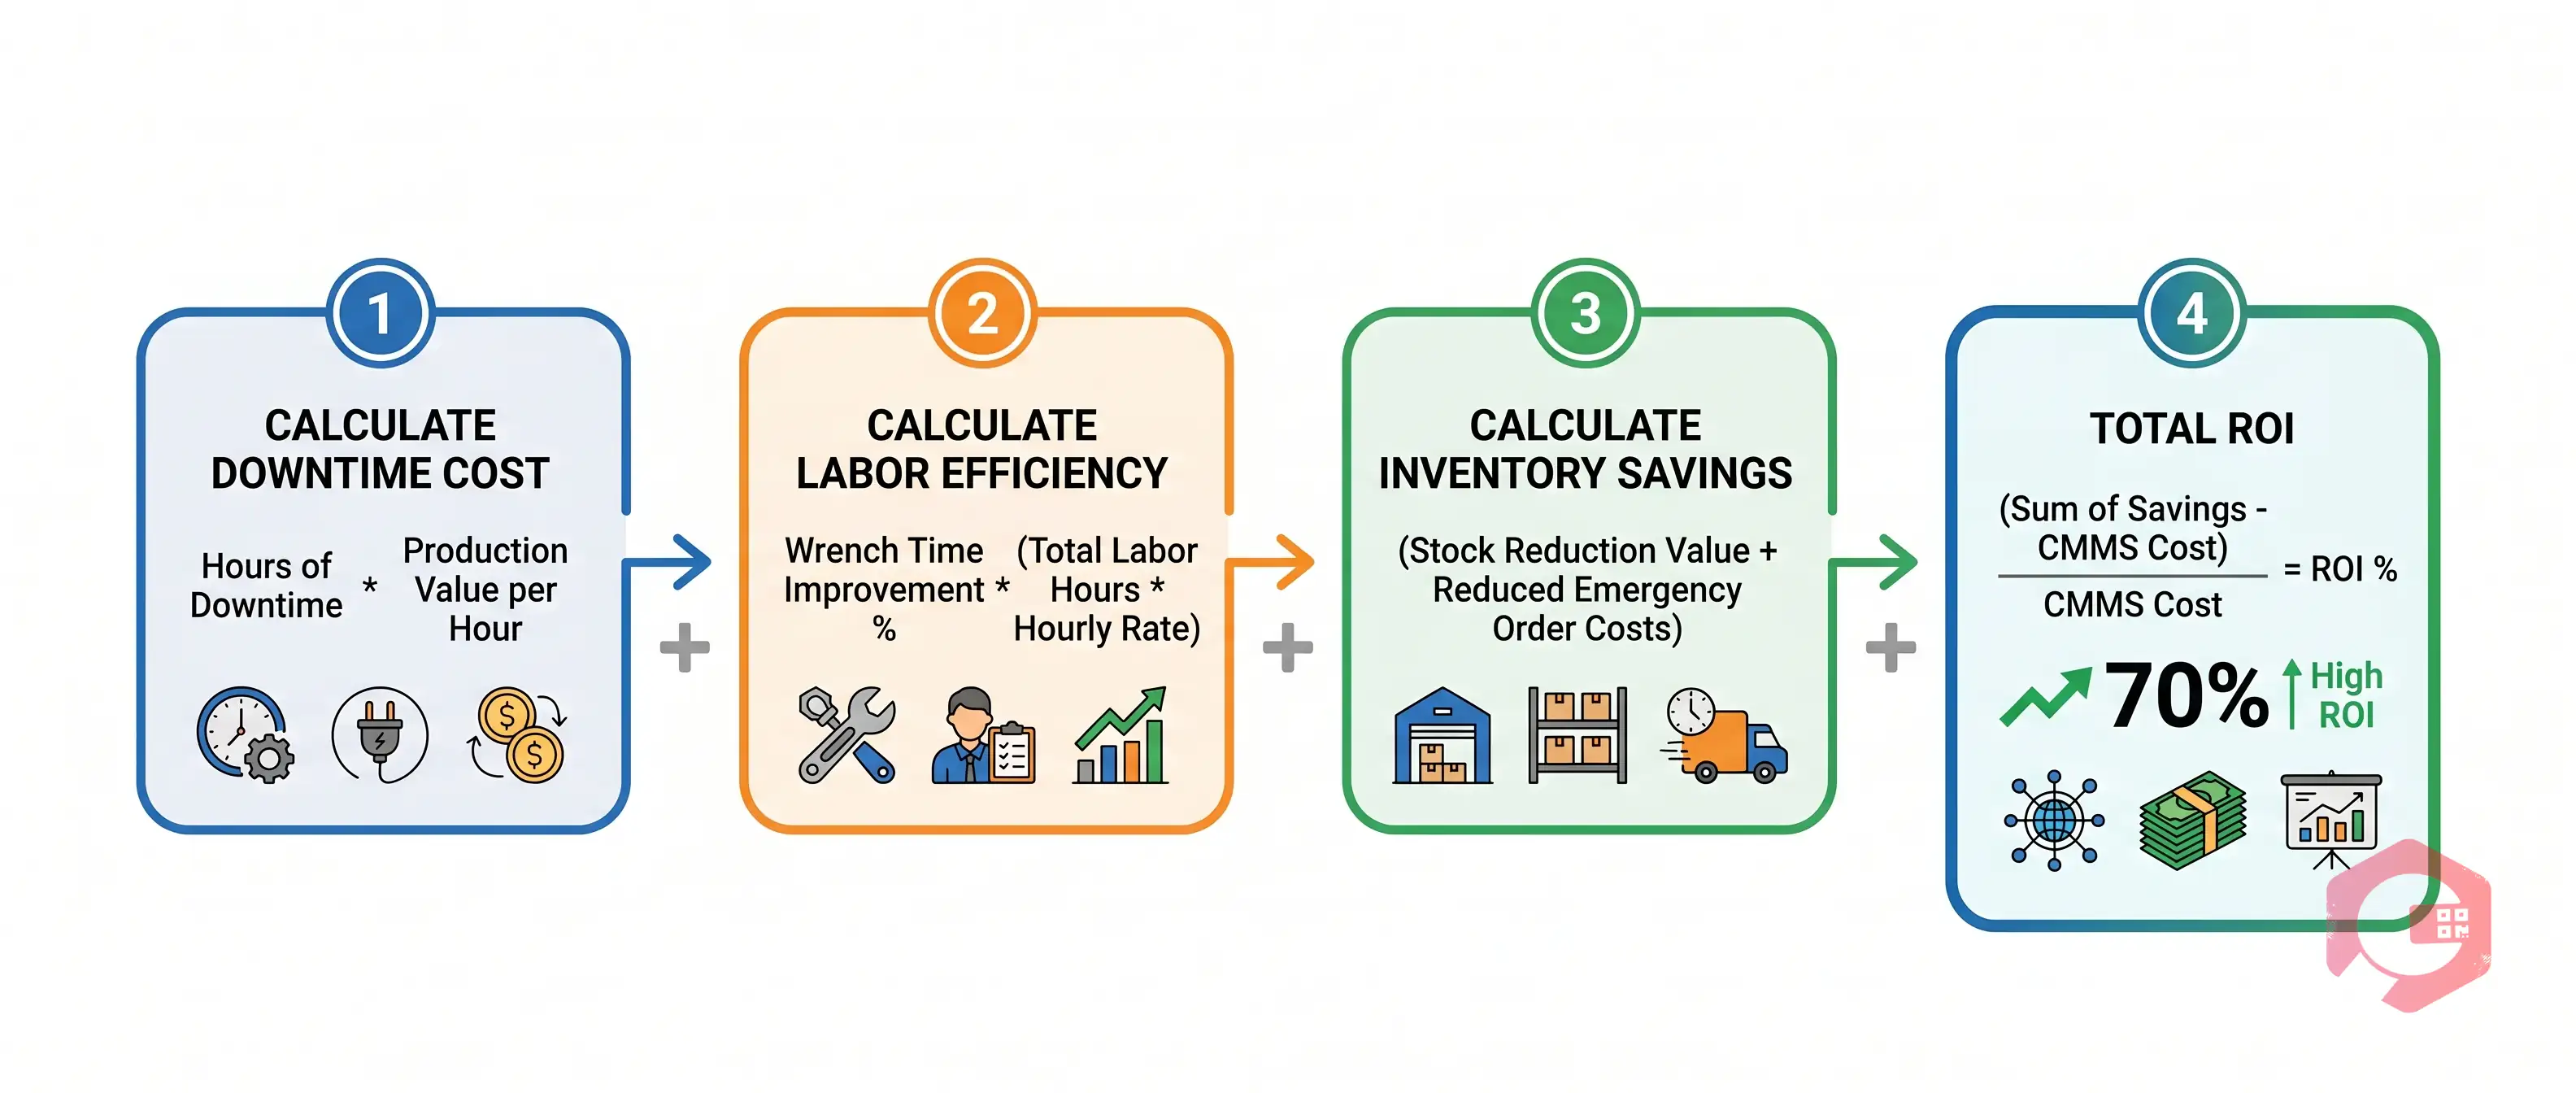
Annual Downtime Cost = Monthly Unplanned Downtime Hours × Production Value Per Hour × 12
Example: 40 hours/month × $5,000/hour × 12 = $2,400,000 annual downtime cost. A 25% reduction saves $600,000.
Labor Efficiency Gain = (Target Wrench Time % − Current Wrench Time %) × Total Annual Labor Cost
Example: (50% − 30%) × $500,000 = $100,000 in recoverable labor value.
Inventory Savings = (Current Inventory Value × Target Reduction %) + Annual Emergency Order Premium Eliminated
Example: ($200,000 × 20%) + $30,000 emergency orders = $70,000 in savings.
ROI % = (Total Annual Savings − Annual CMMS Cost) ÷ Annual CMMS Cost × 100
Payback Period (months) = Annual CMMS Cost ÷ (Total Annual Savings ÷ 12)
Conservative example (mid-size facility): Downtime savings $150,000 + Labor $50,000 + Inventory $35,000 + Compliance $40,000 = $275,000 Total Savings against $25,000 CMMS cost = 1,000% ROI, 1.1-month payback.

Cryotos accelerates ROI through fast implementation (existing PM schedules imported from Excel, most teams live within two weeks), high adoption through mobile-first design (technicians scan QR codes, update work order status, and complete checklists from their phone in under 60 seconds), and immediate BI visibility (usable data within 30 days).
Teams using Cryotos consistently report a 30% reduction in unplanned downtime and 25% faster repair times within six months of go-live. Run your own numbers using the calculator framework in this guide, then compare the result to your current maintenance budget. Request a demo with Cryotos and we'll help you build the model using your actual facility data.
For most mid-size industrial facilities, a well-implemented CMMS delivers 300–1,000%+ ROI in year one, with payback periods of 1–6 months depending on current maintenance maturity. Even conservative models typically show positive ROI within 3–4 months.
Multiply your monthly unplanned downtime hours on critical assets by your production value per hour. Include not just lost production but also idle labor during the downtime window, emergency repair premiums, and any material waste from the interruption.
Include the annual software license fee, one-time implementation and data migration costs (usually 0.5–1x the annual license fee), and internal time invested in training and onboarding (typically 40–80 hours for a team of 10).
Most Cryotos customers see measurable improvements within 30–60 days of go-live. The fastest gains come from PM compliance. Labor efficiency gains typically materialize within 60–90 days. Inventory savings become visible after the first full stock cycle, usually around month three or four.


Cryotos AI predicts failures, automates work orders, and simplifies maintenance—before problems slow you down.


