
The 16 major losses in TPM are a Japan Institute of Plant Maintenance (JIPM) framework that groups every source of wasted equipment time, labor, and material into three categories: eight equipment losses, five human losses, and three resource losses. Together they explain almost every point of hidden efficiency loss on a plant floor. Most of these losses never show up as a single line item on a report — they hide inside "normal" shift variance until a maintenance team starts tracking them individually. A plant running at what looks like 85% efficiency on paper can still be leaking output through six or seven of these categories at once, and nobody notices until the numbers get broken apart loss by loss.
Key Takeaways

Total Productive Maintenance identifies sixteen loss categories that erode equipment effectiveness, workforce productivity, and material or energy efficiency across a plant. JIPM originally developed the framework to give maintenance and operations teams a shared vocabulary for losses that used to get lumped together as "downtime" or "inefficiency." Before the framework existed, a plant manager comparing two lines with the same OEE score had no way to know whether one line was losing time to breakdowns and the other to slow changeovers — the sixteen categories exist precisely to separate those causes.


All sixteen losses ultimately register in one of the three OEE components: Availability, Performance, or Quality. Seeing which bucket a loss falls into helps a maintenance team decide whether the fix belongs to reliability engineering, process engineering, or the operator training program.
| Loss Category | Example Loss | OEE Component Affected | Typical CMMS Data Source |
|---|---|---|---|
| Equipment | Failure/Breakdown | Availability | Downtime log by asset |
| Equipment | Setup/Adjustment | Availability | Work order category tag |
| Equipment | Speed Loss | Performance | Actual vs. rated cycle time |
| Equipment | Defect and Rework | Quality | Defect tag on batch/shift |
| Human | Management Loss | Performance (indirectly) | Work assignment timestamps |
| Resource | Energy Loss | Cost, not OEE directly | Asset-level utility metering |
Equipment losses map directly to OEE. Human and resource losses influence OEE indirectly by freeing up the time and materials that go into Availability, Performance, and Quality in the first place.
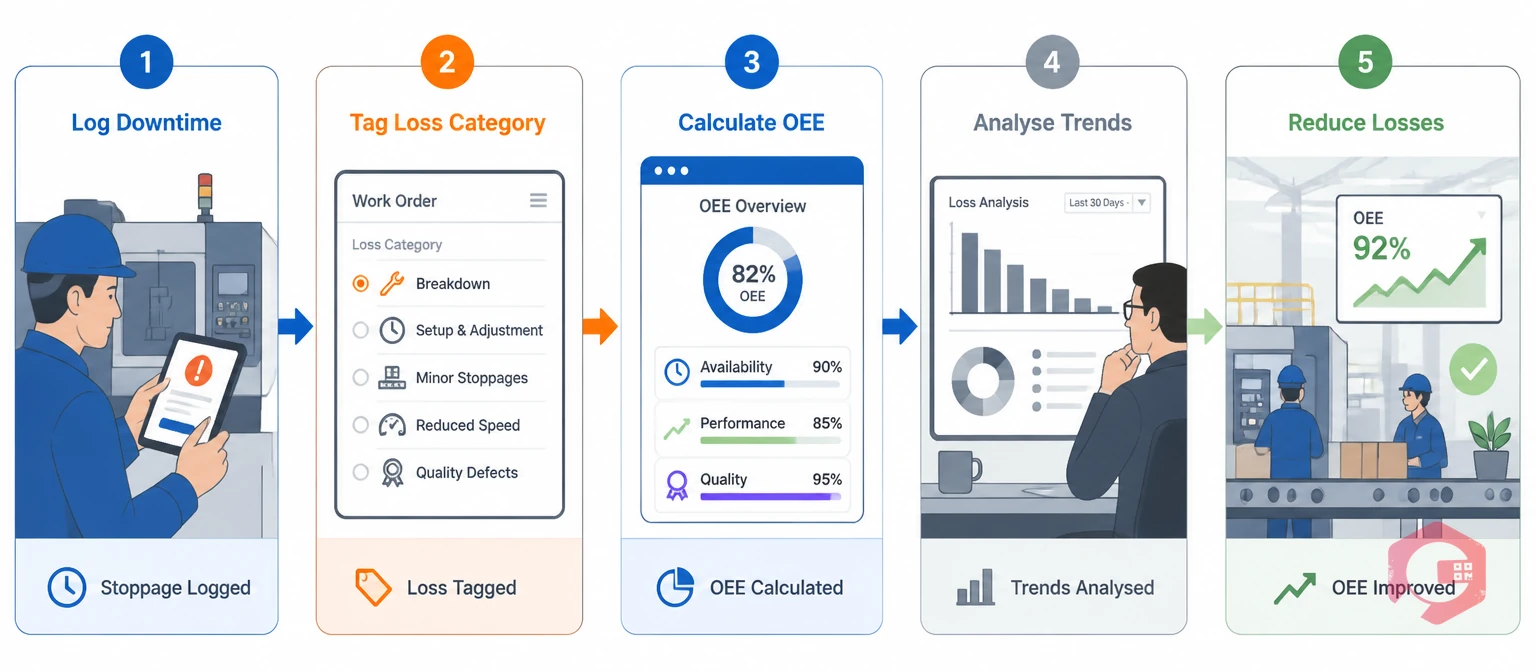
Without a system built for it, most of the sixteen losses stay invisible — absorbed into "normal" operations until they compound into missed production targets and rising maintenance costs. A CMMS downtime tracking module gives maintenance and operations teams the infrastructure to log, categorize, and quantify each loss individually.
Cryotos captures every stoppage the moment it happens — cause, duration, asset, and technician — through mobile work order updates. This turns Failure, Minor Stoppage, and Planned Shutdown Losses into structured, timestamped data instead of shift-report guesses.
Cryotos rolls up downtime, speed, and defect data into the three OEE components automatically. Maintenance managers can see exactly which of the eight equipment losses is dragging a specific asset's OEE down instead of reading one blended efficiency number.
Work orders can be tagged by category — changeover, adjustment, tool change, startup — so each loss shows up as its own line item rather than folded into generic "downtime." Managers watch changeover time trend up or down per asset, line, or shift.
When an operator or inspector flags non-conforming output, Cryotos logs the defect against the asset, batch, and shift that produced it. That gives Defect and Rework Losses a direct link to their root cause instead of a scrap percentage buried in a monthly report.
Cryotos tracks the ratio of planned maintenance to reactive work orders across every asset and line. As Failure and Minor Stoppage Losses decline through better PM scheduling, that ratio shifts measurably — a leading indicator, not just a lagging OEE score.
Teams can ask the Cryotos BI dashboard in plain English: "Which assets had the highest speed losses last month?" The answer comes back as a chart, pulled straight from the report builder — no SQL, no spreadsheet, no waiting for a monthly report.

Once the sixteen losses are visible and tracked individually, the effect on plant performance compounds. The gain isn't one number — it shows up across OEE, labor productivity, and material consumption at the same time. Teams that only chase OEE as a single score tend to plateau, because a rising Quality component can quietly mask a falling Availability component. Breaking the score back down into its sixteen sources is what turns a stalled improvement program into one that keeps finding new ground.
Cryotos's own downtime tracking customers report up to a 30% reduction in unplanned downtime and 25% faster repair times once loss data moves from paper logs into a structured system — evidence that visibility, not more staff, is usually the missing piece.
Most plants don't need a new framework meeting before they start — they need a way to log the losses that are already happening. The rollout usually works better in stages than as a single big-bang launch across every asset at once.
None of this requires new hardware on day one. A work order management system that already captures asset, cause, and duration on every job is usually enough to start seeing the pattern within the first few weeks.
The 16 major losses come from the TPM/JIPM tradition and focus specifically on equipment effectiveness, labor productivity, and resource use on the plant floor. The 7 wastes come from lean manufacturing and describe waste in any process, not just equipment-heavy ones. Many plants track both frameworks side by side.
There's no universal answer — it depends on the plant. Discrete manufacturers with older equipment often see Failure/Breakdown Losses dominate Availability, while high-speed lines more often lose ground to Speed Losses and Minor Stoppages under the Performance component.
A CMMS can capture and quantify all eight equipment losses and most human losses directly through work orders, downtime logs, and defect tagging. Resource losses like energy and yield typically need a metering or ERP integration feeding into the same system for full visibility.
Most teams see the biggest early wins — visibility into minor stoppages and changeover time — within the first one to two months of consistent logging. Failure-pattern insights and PM schedule adjustments usually take a full quarter of data to surface reliably.
Not equally. A continuous-process plant (chemicals, utilities) tends to feel Speed and Energy Losses more sharply, while a discrete manufacturer with frequent product changeovers feels Setup, Adjustment, and Cutting Tool Losses the most. The framework still applies everywhere — the weighting just shifts by industry.
Tracking the 16 major losses in TPM isn't a one-time audit — it's an ongoing discipline. Every shift logged and every defect tagged adds to a dataset that gets more actionable over time, and OEE climbs as a direct result of visibility rather than guesswork. Schedule a free demo to see how Cryotos maps these losses to your own assets.


Cryotos AI predicts failures, automates work orders, and simplifies maintenance—before problems slow you down.


