
OEE vs TEEP vs OOE comes down to one question: against which slice of time are you measuring equipment performance? Overall Equipment Effectiveness (OEE) measures output against planned production time, Overall Operations Effectiveness (OOE) strips out no-demand downtime to isolate true equipment performance, and Total Effective Equipment Performance (TEEP) measures output against every hour on the calendar. Choosing the wrong metric can turn a scheduling problem into a maintenance fire drill, or hide 60% of unused capacity behind a healthy OEE score.
Manufacturing and maintenance teams that track all three side by side get a complete picture: what the equipment is capable of, what it actually produced, and how much of that gap is a scheduling decision rather than an equipment failure. That distinction shapes where budget, headcount, and shift decisions go next.
Key Takeaways

OEE, TEEP, and OOE all measure the same underlying idea — how much value a piece of equipment produces relative to what it could produce — but each anchors that calculation against a different denominator of time. All three multiply Availability, Performance, and Quality together; what changes is how much downtime gets excluded before the math starts.
Get the denominator wrong and the numbers can mislead. A healthy 85% OEE score can mask a machine running at 40% of its true potential, or a scheduling gap can get misdiagnosed as a maintenance failure.
Cryotos calculates all three from the same downtime, performance, and quality data captured through work orders and asset logs, so teams can pick the metric that answers the question they’re actually asking.
Every one of the three metrics is built from the same three components, just applied against a different denominator:
Because Performance and Quality stay constant across all three metrics, the entire OEE-versus-TEEP-versus-OOE conversation really comes down to one variable: what counts as available time in the first place.
The fastest way to see the difference between OEE, TEEP, and OOE is to compare their denominators, what each one excludes, and the question each answers. The table below lines up all three side by side.
| Metric | Denominator | What It Excludes | Question It Answers |
|---|---|---|---|
| OEE | Planned Production Time | Planned stops (breaks, changeovers, scheduled maintenance) | How well did we run during scheduled time? |
| OOE | Planned Production Time, schedule-adjusted | Planned stops plus no-demand and schedule loss | How well did equipment perform when asked to run? |
| TEEP | Calendar Time (24/7/365) | Nothing — all downtime counts against it | How much of total capacity are we using? |
Notice that TEEP is always less than or equal to OEE, and OEE is always less than or equal to OOE, because each metric widens the exclusions built into its denominator.
OEE measures Availability, Performance, and Quality against Planned Production Time — total calendar time minus planned stops such as breaks, changeovers, and scheduled maintenance. It’s the industry-standard metric, popularized as part of the Total Productive Maintenance framework, and it’s the number most plants report up to leadership. A deeper primer lives in our OEE glossary entry.
OEE’s blind spot is that it treats no-demand downtime — a line sitting idle because there’s no order to run — the same as a broken bearing. That’s the gap OOE is built to close. Cryotos rolls up captured downtime, speed, and defect data into a live BI dashboard broken down by Availability, Performance, and Quality for every asset, line, and shift.
OOE measures Availability, Performance, and Quality the same way OEE does, but it strips no-demand and schedule-driven downtime out of the Availability component first. Where OEE penalizes a line for sitting idle because there was no order to run, OOE isolates true equipment and process performance from commercial and planning decisions.
This makes OOE a narrower, more diagnostic question: when the equipment was actually asked to produce, how effectively did it perform? That distinction matters most for maintenance teams measured on a number they don’t fully control.
Tagging every downtime entry by cause — mechanical failure, changeover, scheduled maintenance, or no-demand loss — is what makes an accurate OOE calculation possible in the first place.
TEEP measures OEE multiplied by Utilization, against Calendar Time — all 24 hours of every day, 365 days a year, with no exclusions for shift patterns or weekends. TEEP answers the capacity question: if this asset ran every hour it possibly could, how much output is being left on the table?
A plant running two shifts, five days a week, can post a strong 75% OEE and still show a TEEP under 40%, simply because the asset sits idle two-thirds of the calendar year. That gap reflects capacity utilization, not a performance problem.
All three metrics use the same formula — Availability × Performance × Quality — and differ only in the time denominator plugged into Availability. Once you understand where each denominator starts and stops, the three calculations follow logically from each other.
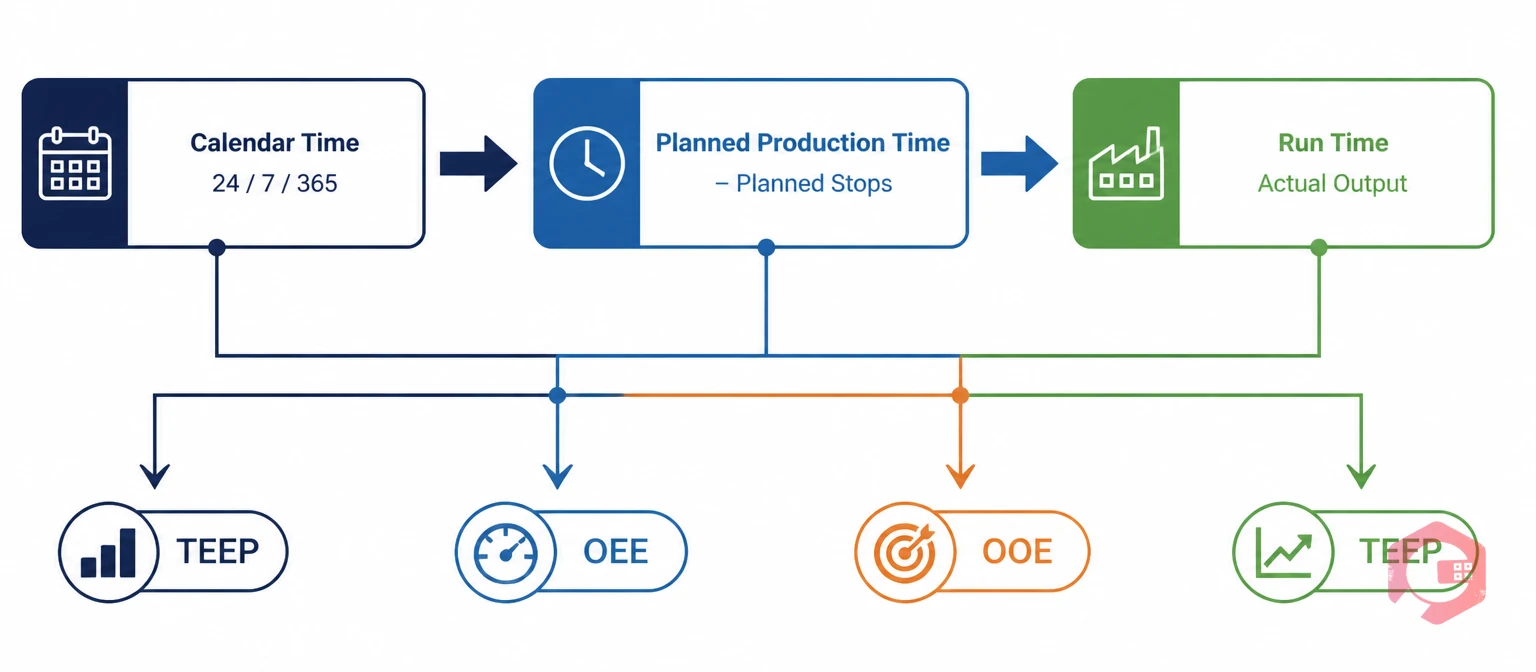
The Three-Denominator Framework treats production time as three nested layers, each wider than the last: Run Time is the equipment actually producing, Planned Production Time is Run Time plus planned stops, and Calendar Time is Planned Production Time plus every unscheduled hour, weekend, and shift gap in the year.
Availability, Performance, and Quality data come from the same three inputs regardless of which metric is being calculated: downtime logs, cycle-time deviations, and defect counts tied to each work order. Run the numbers directly with the OEE calculator before building a manual spreadsheet.
Take a line with 24 hours of Calendar Time, an 8-hour scheduled shift, and 1 hour of no-demand downtime built into that shift. Performance runs at 90% and Quality at 98% for all three calculations.
Same equipment, same shift, three very different numbers — and each one is telling the truth about a different question.
Cryotos captures downtime, speed, and quality data once through work order updates and asset logs, then calculates OEE, OOE, and TEEP from that same dataset instead of three separate spreadsheets. Because all three metrics share Availability, Performance, and Quality as inputs, one data-capture workflow feeds every calculation.
Ask the Cryotos AI dashboard something like “what’s our TEEP for Line 3 this quarter” and the answer comes back as a chart, without a manual formula rebuild. Teams can benchmark OEE, OOE, and TEEP by asset using the report builder, broken down by plant, line, or shift.
Because Cryotos retains the full history of downtime, performance, and quality data, OEE, OOE, and TEEP trends can be compared over weeks, quarters, or years, and benchmarked across assets, lines, or plants. A widening gap between OEE and TEEP over time is a leading indicator of underused capacity long before it shows up in a formal utilization audit.
This matters most during continuous improvement work. SMED changeovers, autonomous maintenance, and quality root-cause programs all show up simultaneously across OEE, OOE, and TEEP when they share the same Availability, Performance, and Quality inputs, which gives teams a way to confirm a gain in one metric isn’t hiding a loss somewhere else.

None of the three metrics is “correct” on its own — each answers a different management question, and most mature TPM programs track all three side by side rather than picking one. The table below maps each metric to the decision it fits best.
| Metric | Best For | Typical Owner |
|---|---|---|
| OEE | Daily and weekly plant-floor performance reviews | Maintenance and operations |
| OOE | Fair maintenance KPIs isolated from demand swings | Maintenance managers |
| TEEP | Capacity planning, shift-addition, and capex decisions | Plant and finance leadership |
A widening gap between any two of these numbers is itself a signal: OEE-to-OOE gaps point at scheduling, and OEE-to-TEEP gaps point at capacity. Teams weighing a capacity decision can cross-check technician efficiency with the wrench time calculator before committing to a new shift.

The most common mistake teams make is reporting a single blended OEE number without breaking it into Availability, Performance, and Quality, which hides which component is actually causing the loss. A handful of other patterns show up just as often across plants that are new to formal tracking.
Fixing these patterns usually starts with consistent downtime tagging, since every one of the three metrics depends on the same underlying data being captured the same way every shift. Once that discipline is in place, the gap between OEE, OOE, and TEEP stops being a guess and becomes a number a plant can actually act on.
The main difference is the denominator each metric measures against: OEE uses planned production time, OOE uses planned production time with no-demand downtime removed, and TEEP uses full calendar time. The formula, Availability multiplied by Performance multiplied by Quality, stays the same across all three.
TEEP is usually lower than OEE because it measures against every hour of the year, including nights, weekends, and shifts the plant never runs. OEE only measures against the hours the plant actually scheduled, so it excludes that unscheduled time before the math even starts.
Yes, OOE is typically higher than OEE for the same asset and time period, because OOE removes no-demand downtime from the Availability calculation before comparing to output. Once that scheduling-driven downtime disappears from the denominator, the resulting percentage rises.
A TEEP score above 60% is considered strong for most discrete manufacturers, since even efficient plants rarely run every asset around the clock. Plants running a single shift often see TEEP in the 20% to 35% range even with a world-class OEE, simply because two-thirds of the calendar goes unused.
You don’t strictly need software, but tracking three key performance indicators from separate spreadsheets multiplies the chance of inconsistent downtime tagging between them. A Computerized Maintenance Management System that captures downtime once and calculates all three from the same dataset keeps the numbers consistent and comparable over time.
Most plants start with OEE because it’s the industry-standard benchmark and the easiest to explain to leadership. Once downtime causes are tagged consistently, adding OOE and TEEP takes little extra effort since all three draw on the same underlying data.
Tracking OEE, TEEP, and OOE from one dataset turns three disconnected numbers into one consistent story for leadership, maintenance, and finance. Talk to Cryotos about setting up multi-metric OEE, TEEP, and OOE dashboards for your plant.


Cryotos AI predicts failures, automates work orders, and simplifies maintenance—before problems slow you down.


