
The six big losses are six specific failure modes. They are breakdowns, setup and adjustments, idling and minor stoppages, reduced speed, process defects, and startup and yield losses. Together they pull a machine's Overall Equipment Effectiveness below 100%.
Each of the six big losses sits under one of the three OEE factors: availability, performance, or quality. Tracking them separately turns OEE from one confusing score into six specific problems a team can actually fix.
Key Takeaways

The six big losses come from the Total Productive Maintenance framework, developed by Seiichi Nakajima. It groups every cause of lost production into six categories tied directly to the OEE formula. Total Productive Maintenance connects equipment reliability directly to manufacturing output.
Overall Equipment Effectiveness equals availability multiplied by performance multiplied by quality, and each factor carries exactly two of the six big losses. That is why the framework always names six losses — never five, never seven.
A Computerized Maintenance Management System (CMMS) gives manufacturing and maintenance teams the data layer they need. It logs each loss separately at the asset level, instead of relying on end-of-shift estimates. That asset-level detail is what makes the next six sections possible. For the full formula and terminology, see the Overall Equipment Effectiveness glossary entry.

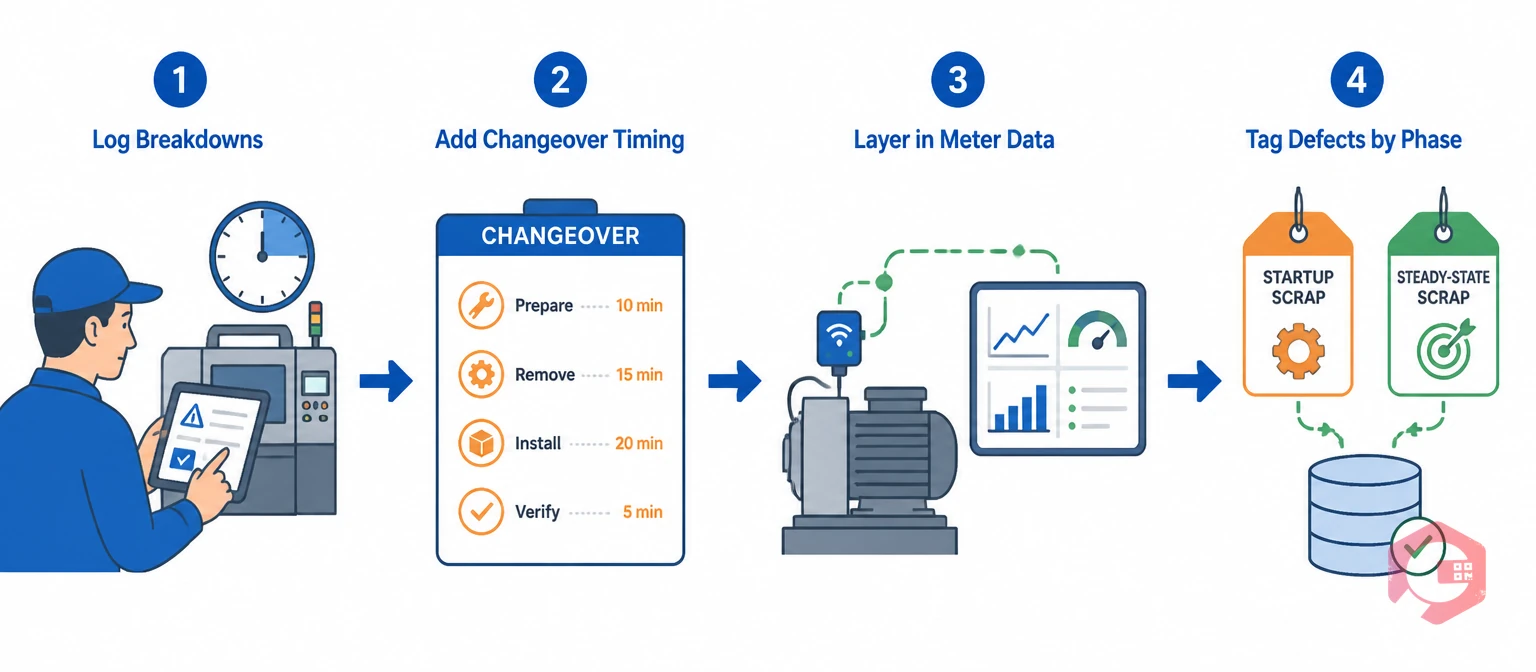
A breakdown loss is unplanned equipment failure that stops production entirely until repairs finish. It is the most visible and usually the most expensive of the six big losses. Output drops to zero for the full duration of the stoppage.
Maintenance teams using Cryotos have reported up to 30% reduction in unplanned downtime and 25% faster repair turnaround. The gain comes from downtime tracking that captures every breakdown as a work order. Each work order carries a timestamp, a root cause, and the parts used, instead of a vague "machine was down" note.
Tracked this way, breakdown loss stops being a surprise and starts being a number a team can forecast and budget against.
Setup and adjustment loss is the planned downtime between product runs that runs longer than the target time. Changeover time is expected, but every extra minute beyond the target is still availability lost from the schedule.
The Single-Minute Exchange of Die (SMED) methodology was built for exactly this problem. It shows that most changeovers can be cut dramatically once the steps are standardized and timed.
Logging changeover start and end times against each work order turns setup duration into data instead of an assumed constant. Once the numbers show which changeovers consistently overrun, teams can attach maintenance checklists with target times to the slowest ones.
Shrinking this loss does not require touching the machine at all — it only requires standardizing the people and process around it.
See where changeovers and breakdowns stack up against industry benchmarks with the free OEE calculator.

Idling and minor stoppage loss is the cumulative effect of small stops — jams, sensor faults, misfeeds — that each last only a few minutes. Because no single stoppage looks serious on its own, most facilities never log them individually.
Left untracked, these small stops can silently erode performance more than one major breakdown does. The reason is simple: they repeat constantly across a shift.
Most facilities are surprised by which stoppage type tops the list once they actually measure it.
Reduced speed loss is the output a machine fails to produce when it runs below its rated speed without ever triggering a stoppage alert. It is the easiest of the six big losses to miss, because the line keeps moving and nothing looks obviously wrong.
A machine quietly running at 85% of rated speed for an entire shift loses far more output than a five-minute stoppage ever would. That is exactly why this loss hides in plain sight.
Meter data exposes the gap right away. Comparing actual throughput — units produced, cycle counts, run hours — against rated capacity shows exactly how far behind a machine is running.
Once the cause is clear, assigning a corrective work order closes the gap before it costs another full shift of output.

A process defect is a unit that fails quality specs while the machine runs at steady state, not during startup or changeover. It is a quality loss, but the root cause is often a maintenance issue. Worn tooling, drifting calibration, or a machine running outside spec are common culprits.
Logging defect counts and reject reasons against the asset and time window matters. It lets a spike in scrap rate get cross-referenced against recent maintenance activity or calibration status. The spike no longer sits unexplained on a quality report.
Most quality losses trace back to an equipment condition. Fixing it is maintenance's job, not the operator's.
Startup and yield loss is the scrap produced during machine warm-up, right after a changeover, or following a stoppage, before the process stabilizes. The cause is different from steady-state defects, which is why TPM treats it as its own category.
Tagging defects to the production phase they occurred in makes the difference. Startup scrap and steady-state scrap have different causes, so separating them keeps the two from blending into one confusing scrap number.
The goal is not zero startup scrap. It is shrinking the window before the process stabilizes, using one of the three levers above.
Each of the six big losses sits under exactly one factor in the OEE formula. Grouping them in pairs, instead of chasing six separate fixes, moves the score the fastest. The OEE calculation itself has not changed. Only the visibility into what is driving it has.
The OEE Loss Triangle:
Reviewing all six big losses against this map shows which OEE factor is dragging the score down. There is no need to guess from one blended percentage.
A BI dashboard built around availability, performance, and quality keeps this breakdown visible in real time, shift by shift. It does not stay buried in a month-end spreadsheet.
Tracking the six big losses individually changes what an OEE drop actually tells a team. Instead of one number that something is wrong, it gets the specific failure mode causing it.
| Aspect | Single OEE Number Only | Six Big Losses Tracked Individually |
|---|---|---|
| What it tells you | Something is wrong | Exactly which loss caused the drop |
| Root cause visibility | Hidden inside the blended score | Visible per failure mode |
| Improvement focus | Generic "improve OEE" initiatives | A fix matched to the actual loss |
| Reporting cadence | Often a monthly rollup | Real time, per shift and per asset |
| Cross-shift comparison | Not possible from one number | Possible across shifts and sites |
The single percentage is not wrong — it is just not detailed enough to act on by itself.
Most facilities cannot track six loss categories by hand at the asset level. The volume of small stoppages and changeover minutes alone makes spreadsheet tracking impractical past a handful of machines.
Teams that successfully roll this out usually start with the two losses costing them the most. They do not try to instrument all six at once.
Once all six big losses are flowing into one system, ranking them by actual cost becomes possible for the first time. Teams stop reacting to whichever machine complained loudest that week.
OEE is the single percentage score: availability times performance times quality. The six big losses are the diagnostic breakdown underneath that score. They show which specific failure mode is responsible for whatever OEE is missing from 100%.
It varies by facility, but unplanned breakdowns and minor stoppages are the two most commonly underestimated. Breakdowns are dramatic but rare. Minor stoppages are frequent but individually small. Tracking both at the asset level usually reveals which one dominates for a specific line.
Availability loss comes from breakdown and changeover time divided by scheduled production time. Performance loss comes from actual run rate divided by rated run rate. Quality loss comes from good units divided by total units produced. Startup scrap should be tagged separately from steady-state scrap so the two causes do not blend together.
Yes. A CMMS with downtime tracking, meter integration, and a BI dashboard can log breakdowns, changeovers, minor stops, speed gaps, and defects as they happen. No one has to reconstruct any of it from memory at month-end.
Most facilities review breakdown and stoppage data weekly, since those losses change fastest and respond well to quick fixes. Setup, speed, and quality losses move more slowly, so a monthly review usually catches the trend without adding extra reporting overhead.
Treat the six big losses as six separate problems instead of one vague score. The next improvement cycle gets an actual target instead of a guess. Schedule a free demo to see how Cryotos captures every breakdown, changeover, stoppage, speed gap, and defect at the asset level in real time.


Cryotos AI predicts failures, automates work orders, and simplifies maintenance—before problems slow you down.


