

Condition monitoring uses real-time sensor data to detect early signs of equipment wear before a breakdown occurs. It tracks vibration, temperature, oil quality, and ultrasonic signals. Unlike calendar-based PM, it lets your team act on real health data. You can catch failures weeks or months early. Per ISO 17359, a well-run program can cut unplanned downtime by 30–50% on critical assets. This guide covers five core techniques, how to match each one to the right asset, and how to tie it all into your Computerized Maintenance Management System workflow.
Key Takeaways
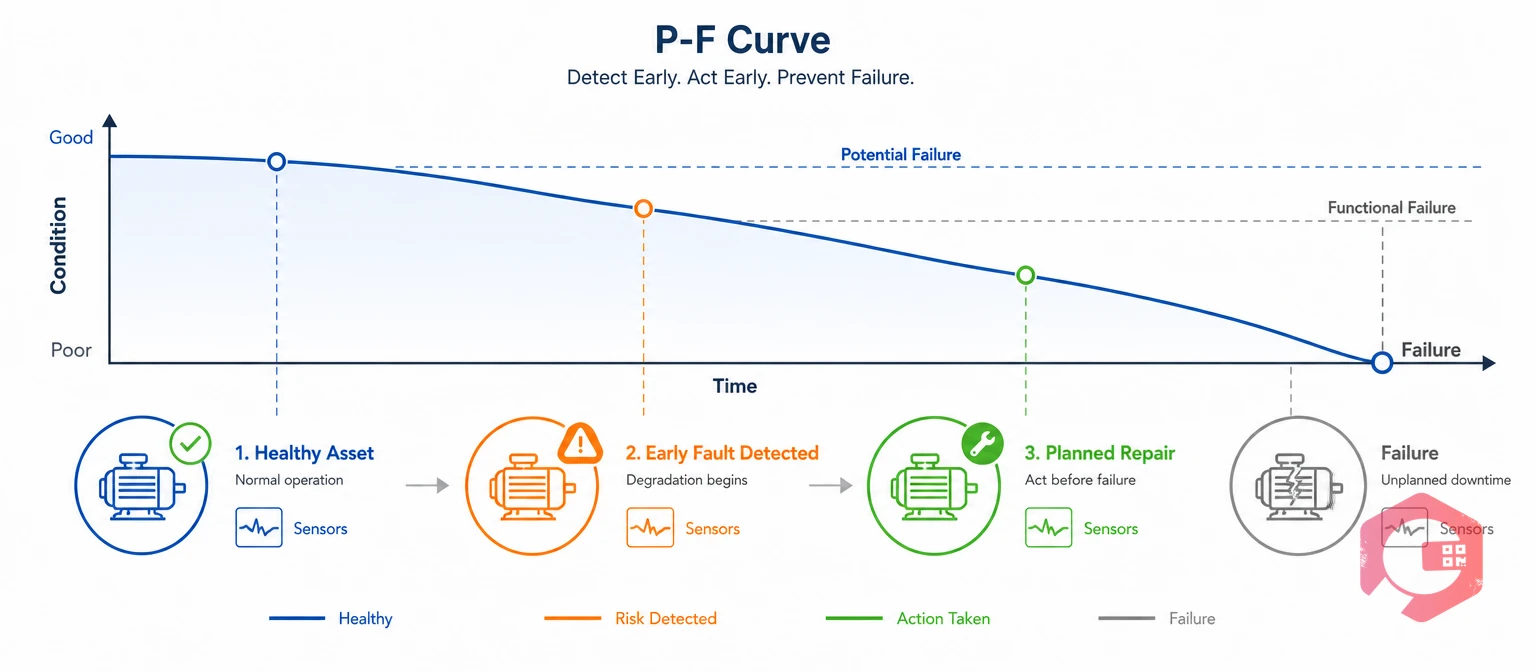
Condition monitoring is the regular check of equipment health to spot early signs of wear or damage. Instead of swapping parts on a set calendar, condition monitoring shows you each asset's real health. It flags the exact point where normal wear starts turning into a real problem.
The idea is built on the P-F curve, a key model in reliability engineering. The P-F interval is the gap between when a fault first shows on sensors (P point) and when the asset fully breaks down (F point). Condition monitoring catches faults at the P point. Vibration patterns shift. Temps rise. Oil gets dirty. Your team gets the full P-F window to plan and finish a repair.
Most mechanical and electrical faults have P-F intervals of several weeks to several months. That window is where condition monitoring pays off: turning emergency breakdowns into planned, scheduled repairs. The Society for Maintenance and Reliability Professionals (SMRP) finds that mature programs deliver 10–15% higher equipment uptime than time-based PM alone.

Each technique targets a specific type of failure. Picking the right one depends on the equipment type, the main failure mode, and how long the P-F interval runs. Here are five techniques that cover most industrial equipment failures.
Vibration analysis is the most widely used condition monitoring technique for rotating equipment. Sensors mounted on bearings, motors, pumps, and gearboxes measure vibration speed and strength. When vibration patterns change — higher readings at certain speeds, new patterns, or broad noise — they point to bearing wear, shaft misalignment, imbalance, looseness, or gear tooth damage.
It works best on assets where bearing or shaft failure is the main risk. The P-F interval for these faults is 1–3 months. That gives your team plenty of time to plan a fix.
Infrared thermography detects abnormal heat patterns that indicate electrical faults, insulation breakdown, or mechanical friction. A thermal camera shows surface heat patterns across equipment. It reveals hot spots you cannot see — loose wiring, overloaded circuits, failing insulation, and bearing friction.
This technique is best for electrical panels, switchgear, transformers, and bus bars. It also catches mechanical friction, steam trap issues, and refractory wear. You can scan while the gear runs under normal load. That makes it one of the least disruptive methods out there.
Oil analysis examines lubricant samples for contamination, wear particles, and chemical degradation to assess the health of hydraulic systems, gearboxes, and engines. Metal particles (iron, copper, chromium, lead) show wear on internal parts. Water means a seal failed. Viscosity shifts point to heat damage or wrong lube.
Oil analysis is a must for enclosed systems you cannot visually inspect. The P-F interval runs 2–6 months — one of the longest early warnings you can get.
Ultrasonic testing detects high-frequency sound emissions produced by compressed gas leaks, electrical discharge (arcing and corona), and early-stage bearing faults. Handheld detectors turn sounds above human hearing into signals you can hear. This helps technicians find the exact spot of leaks, electrical faults, and bearing wear.
It is great for finding compressed air leaks (which can eat 20–30% of compressor energy costs), steam trap faults, and partial discharge in high-voltage gear. It works alongside vibration analysis by catching bearing faults even earlier.
Motor current analysis detects electrical and mechanical faults in electric motors by analyzing the current waveform drawn from the power supply. Broken rotor bars, winding faults, and load problems each create distinct changes in the current pattern — often before vibration or heat symptoms show up.
It needs no contact with the motor — readings come from the motor control panel. That makes it ideal for motors in hazardous or tight spaces.
The CBM Technique Selection Matrix:
| Technique | Best For | Primary Failure Modes Detected | Typical P-F Interval | Monitoring Type |
|---|---|---|---|---|
| Vibration Analysis | Rotating equipment (motors, pumps, fans, gearboxes) | Bearing wear, misalignment, imbalance, looseness | 1–3 months | Continuous or periodic |
| Thermal Imaging | Electrical panels, switchgear, transformers, mechanical friction | Loose connections, overloads, insulation breakdown, hot bearings | 1–4 weeks | Periodic (route-based) |
| Oil Analysis | Hydraulic systems, gearboxes, engines, compressors | Wear particles, contamination, chemical degradation | 2–6 months | Periodic (sample-based) |
| Ultrasonic Testing | Compressed air systems, steam traps, high-voltage equipment | Leaks, arcing, corona discharge, early bearing faults | 1–3 months | Periodic (route-based) |
| Motor Current Analysis | Electric motors (especially in hazardous or inaccessible locations) | Rotor bar faults, stator winding issues, eccentricity | 2–6 months | Periodic or continuous |
The matrix above is a starting point. Each site should adjust based on its own conditions, asset criticality, and failure history in the CMMS.
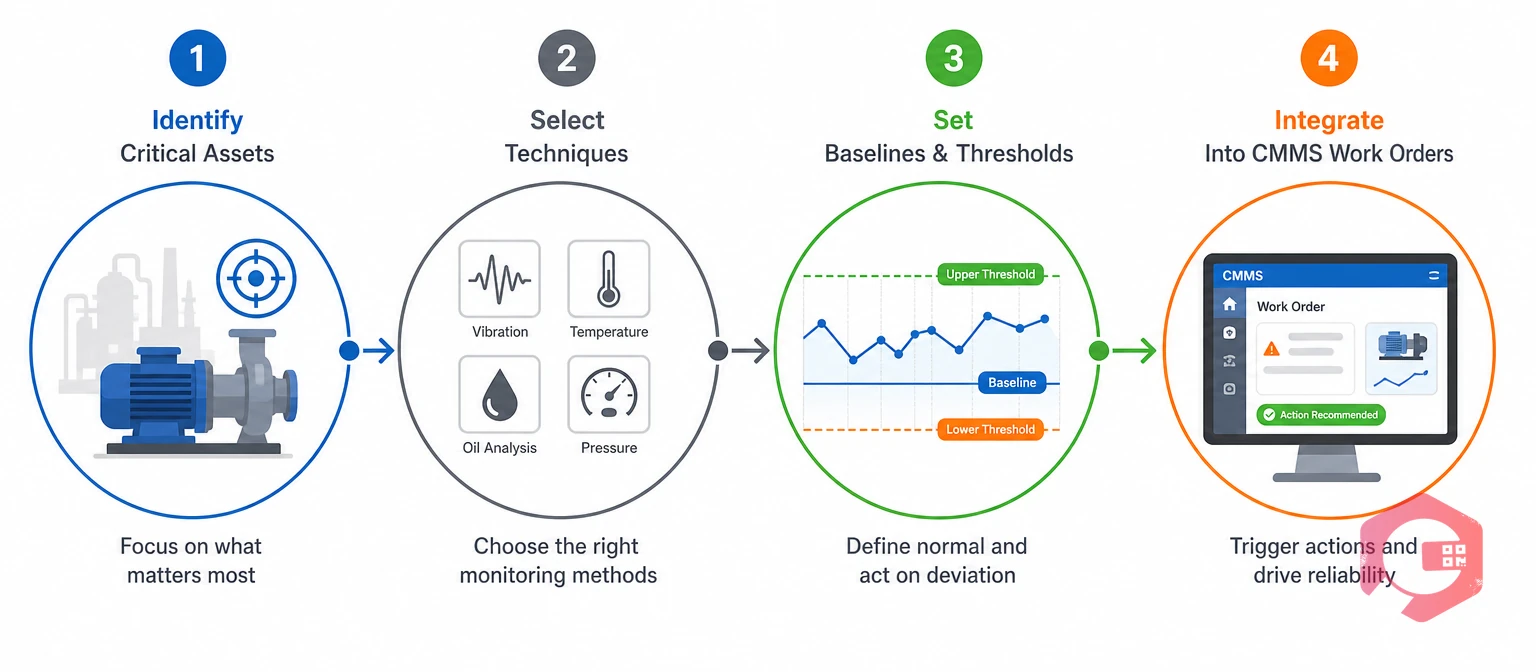
Condition monitoring data only prevents failures when it feeds into a workflow that can act on the findings. Without that link, reports pile up in folders while the asset keeps wearing down toward a breakdown. Here is how to set it up as a working system — not a data collection exercise.
Not every asset justifies the cost of condition monitoring. Start with assets that check two boxes: high failure impact (production loss, safety risk, or costly repairs) and a failure mode one of the five techniques can detect. A criticality ranking from your CMMS — based on failure frequency, downtime impact, and repair cost — finds the 15–20% of assets causing 80% of unplanned downtime. Those are your condition monitoring candidates.
Use the CBM Technique Selection Matrix above to match each critical asset to the monitoring technique that targets its dominant failure mode. A pump with bearing issues gets vibration monitoring. A transformer with heat events gets thermal imaging. A hydraulic press with dirty-oil seal failures gets oil analysis. Match the technique to the failure mode — not the asset label.
Every technique needs a baseline reading taken when the asset is in good working order. You compare later readings against that baseline to spot changes. Set two levels. An alert threshold means early change — schedule an inspection. An alarm threshold means big change — create a priority work order. Without set thresholds, the data is just numbers without meaning.
This is where most condition monitoring programs fail. The readings exist, but they live in a separate system — a vibration analyst's laptop, a thermal imaging report folder, an oil lab spreadsheet — disconnected from the maintenance planning workflow. The IoT and meter reading integration in Cryotos connects sensor data directly to asset records, so threshold exceedances automatically generate work orders with the relevant reading data attached. Maintenance teams using Cryotos have reported up to 30% reduction in unplanned downtime and 25% faster repair turnaround — results driven by closing the gap between data collection and maintenance action.
Use the MTBF calculator to track whether your condition monitoring program is actually improving asset reliability over time — a rising MTBF trend on monitored assets confirms the program is working.
Most programs that fail do not fail because the technology is wrong. They fail because the process around the technology has gaps. Here are the mistakes maintenance teams run into most often. Per Reliable Plant, over 50% of programs stall in year one due to process gaps — not tech problems.
The five main types are vibration analysis, infrared thermography, oil analysis, ultrasonic testing, and motor current analysis. Each targets a different type of failure. Vibration analysis finds mechanical faults in rotating gear. Thermography catches heat buildup from electrical or friction problems. Oil analysis spots contamination and wear in lubed systems. Ultrasonic testing finds leaks and electrical discharge. Motor current analysis detects motor faults without touching the motor.
Preventive maintenance services parts on a fixed schedule — every 30 days or every 500 hours — no matter what shape the part is in. Condition monitoring checks the actual health of the part and triggers work only when it spots wear. The result is that PM can waste time on healthy assets or miss fast-wearing ones between service dates. Condition monitoring matches the work to the asset's real-time condition.
Rotating equipment — motors, pumps, fans, compressors, and gearboxes — gets the most value. These assets have well-known failure modes with long P-F intervals that vibration and oil analysis can catch early. Electrical gear (switchgear, panels, transformers) is the next best fit. Thermal imaging stops dangerous failures before they happen. Low-risk assets or those that fail too fast for periodic checks (some electronics, for example) are poor fits.
The best setup links sensor data or manual readings straight to the CMMS asset record. You set alarm thresholds, and the system creates work orders when a reading crosses the line. This cuts out the manual review step where most programs get stuck. Cryotos does this through its IoT meter reading module. Sensor data feeds into asset records. Threshold breaches trigger work orders. MTBF trends update on their own — creating a closed loop from data to action with no extra reporting layer.
Condition monitoring is the highest-return predictive maintenance investment for plants with critical rotating and electrical assets. The difference between organizations that succeed and those that abandon it comes down to one factor: whether the data connects to action through a CMMS workflow. Schedule a free demo to see how Cryotos integrates condition monitoring data, automated work order generation, and asset health dashboards into one connected system.

Cryotos AI predicts failures, automates work orders, and simplifies maintenance—before problems slow you down.



