

A critical spare parts list is the short list of parts you must always stock because running out of them would stop production, endanger people or break a compliance rule. The most reliable way to build one is a weighted criticality score: rate each part on five criteria, weight the ratings and rank the results.
This guide covers seven steps, from ranking assets to yearly reviews, with a worked example and stocking rules for each tier. It also lists the mistakes that most often undermine a critical spare parts list. It suits maintenance managers, reliability engineers and storeroom planners who need a list they can defend in a budget review.
Key Takeaways

A critical spare parts list is a ranked set of parts that must be stocked because running out creates serious risk. Most maintenance teams build one from memory, which favors whatever failed last month and misses rare, severe failures.
Both errors cost money. A missing part turns a one-hour repair into days of waiting. Overstock ties up cash and adds to your maintenance costs through storage, aging and obsolescence.
ISO 55000 asset management, reliability-centered maintenance and FMEA all rank risk before deciding where to spend effort. A weighted score applies the same logic to parts, and bodies such as the Society for Maintenance & Reliability Professionals offer wider guidance on reliability practice.
Start with assets, not the storeroom. List the assets whose failure would stop production, endanger people or breach a compliance duty, then rank them by criticality. Maintenance teams that start here avoid scoring hundreds of low-risk parts.
For each critical asset, list every part that can fail, such as bearings, seals, drives, sensors, valves and control modules. Pull the list from OEM manuals, bills of materials and past work orders, which often reveal parts the manuals never mention.
Failure history shows which parts break and what each stoppage costs. Pull 12 to 24 months of work orders and downtime records for every critical asset. Note the failed part, the repair time and the lost output.
Where records are thin, ask technicians which parts they replace most and which repairs stalled waiting for delivery. Treat those answers as a draft until data confirms them. Multiply downtime hours by the hourly cost of lost output to compare parts in money terms, because a low-cost bearing that halts a line for two days can outrank an expensive module nobody misses.
Use the MTBF calculator to turn each part's failure history into a likelihood rating.
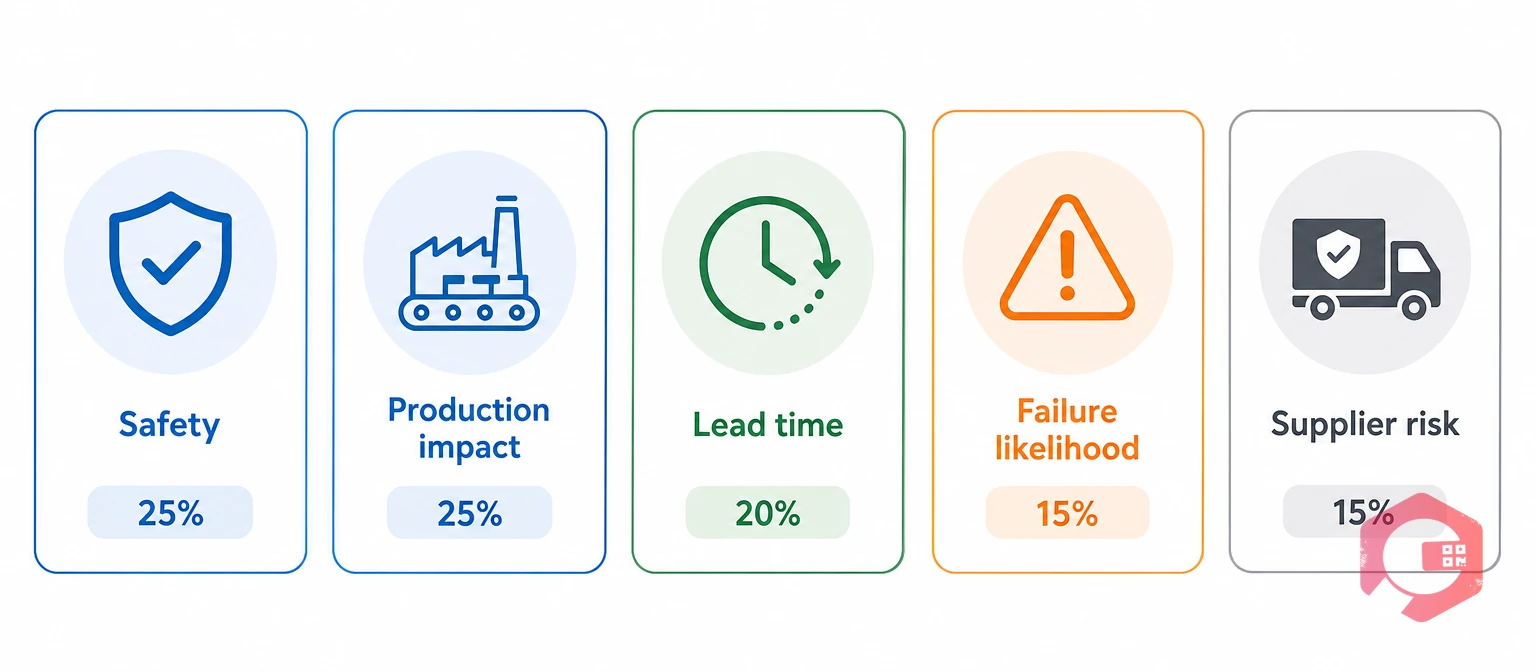
A weighted criticality score is a single number that ranks a part by the risk of not having it on the shelf. Each criterion gets a weight, each part gets a 1 to 5 rating, and the score is the weighted sum multiplied by 20.
Agree the criteria and weights with maintenance, operations, safety and procurement together, and record who signed off. The weights below are a starting point to adjust for your operation. Write each rating level in plain words so two people score the same part the same way.
| Criterion | Weight | Rating 1 | Rating 3 | Rating 5 |
|---|---|---|---|---|
| Safety and compliance impact | 25% | No injury or compliance risk | Minor reportable incident | Serious injury or breach |
| Production or service impact | 25% | No effect on output | Reduced output | Full line or site stop |
| Replacement lead time | 20% | Under 2 days | 2 to 4 weeks | Over 12 weeks |
| Failure likelihood | 15% | No failures in 5 years | A few failures | Repeated in last 12 months |
| Substitutability and supplier risk | 15% | Many equivalents | One alternative | Single source |
Leave unit cost out of the score. A costly part can still be critical, so cost decides how you hold the part, not whether it matters. Replace the example thresholds with figures from your own operation.

Multiply each rating by its weight, add the results and multiply by 20. A PLC module rated 3, 5, 5, 2 and 5 scores (0.25 × 3) + (0.25 × 5) + (0.20 × 5) + (0.15 × 2) + (0.15 × 5) = 4.05, and 4.05 × 20 = 81.
Have two people score a sample independently, because large gaps point to a vague rating definition. Repeat the same steps for every part on your critical spare parts list.
The Score-Override-Tier Method:
| Part | Safety | Production | Lead time | Failure | Substitute | Score | Tier |
|---|---|---|---|---|---|---|---|
| PLC CPU module | 3 | 5 | 5 | 2 | 5 | 81 | A |
| Boiler relief valve | 5 | 4 | 4 | 1 | 3 | 73 | A (override) |
| Drive motor bearing | 2 | 5 | 4 | 3 | 4 | 72 | B |
| Hydraulic hose | 2 | 3 | 1 | 4 | 1 | 44 | C |
| Conveyor idler roller | 1 | 2 | 2 | 4 | 1 | 38 | C |
These ratings are illustrative. With Tier A at 75 or above and Tier C below 50, the relief valve lands in Tier B on points alone. Its safety rating of 5 triggers the override, so it becomes Tier A, because an average can hide a severe risk.

A stocking tier is a risk band that sets how many units of a part you hold and how often you review it. Tiers turn scores into stocking rules for your critical spare parts list. Use these cut-offs as a starting point and tune them against your own usage and supplier data.
| Tier | Score | Stocking rule | Review |
|---|---|---|---|
| A: Critical | 75 or above, or any override | Hold on site, at least one unit | Quarterly |
| B: Important | 50 to 74 | Stock to min/max from usage and lead time | Every 6 months |
| C: Routine | Below 50 | Hold little or none; buy on demand | Annually |
For costly Tier A parts that rarely fail, a unit at every site may not pay back. Cost then decides between a shared pool across plants, supplier consignment or a refurbished unit. Document the risk you accept.
A Computerized Maintenance Management System (CMMS) keeps the list live, so stock levels, alerts and failure history sit in one place. Keep your scoring sheet as the source of truth for scores and tiers, then manage stock in the system.
Cryotos supports the stock side with QR and barcode stock visibility, warehouse structure mapping, minimum-threshold alerts and LIFO, FIFO or average costing. Maintenance teams using Cryotos have reported up to 30% reduction in unplanned downtime and 25% faster repair turnaround.
A critical spare parts list goes stale whenever an asset, supplier or failure pattern changes. Re-score affected parts after any major failure, asset replacement or supplier change, and run a full review at least once a year.
Retire parts when an asset is decommissioned, so the list never carries dead stock.
ABC analysis ranks parts by annual spend, so it shows where the money goes. A weighted criticality score ranks parts by the risk of not having them. Use ABC to control cost and the score to protect uptime.
Five is enough for most sites. More than six slows scoring and rarely changes the ranking. Keep each criterion measurable, so two people reach the same rating.
Review Tier A quarterly, Tier B every six months and Tier C once a year. Re-score any part after a major failure, an asset change or a supplier change.
Yes. Criticality measures impact, not price. A cheap sensor that stops a line and takes 12 weeks to arrive scores high on production impact and lead time, so it earns a place on the list.
Yes. A spreadsheet works well for agreeing weights and scoring parts. Once tiers are set, move stock levels and alerts into your CMMS, so the list stays current.
A scored list protects uptime without filling the storeroom. Schedule a free demo to see how Cryotos helps you track Tier A stock, set minimum alerts and keep critical spares ready.



Cryotos AI predicts failures, automates work orders, and simplifies maintenance—before problems slow you down.



