Criticality analysis is a structured method for ranking assets by how much their failure would affect safety, production, quality, and cost. Maintenance teams use the ranking to decide which assets get the fastest response, the deepest PM, condition monitoring, and critical spares. Done well, it focuses limited time and budget on the small group of assets that cause most unplanned downtime.
Many plants complete a criticality study and then file it away. The ranking only cuts downtime when it changes daily decisions, such as which work order goes first or which pump gets a vibration route. This guide shows how maintenance teams turn criticality scores into five practical actions, with a response matrix, a worked example, and the KPIs that prove the result.
Key Takeaways

An asset criticality ranking is an ordered list of equipment, sorted by the business impact of each asset failing. Each asset gets a score based on the consequence of failure and, in many methods, the likelihood of failure.
Most teams score the consequences in several areas and combine them on a risk matrix. The approach supports asset management systems built on ISO 55000, which expects decisions to follow risk and value. It is also the usual first step in reliability-centered maintenance programs.
Where a component-level view is needed, teams use FMECA or FMEA to rank individual failure modes inside a critical asset.
The output of criticality analysis is simple: a ranked list that tells everyone which assets matter most.
Criticality analysis reduces downtime because unplanned stops are rarely spread evenly across a plant. A small share of assets usually causes a large share of the lost hours, which matches the Pareto principle.
Without a ranking, maintenance effort tends to follow whoever shouts loudest or whichever machine broke last. With one, the team can see where the next hour of work prevents the most lost production.
In short, criticality analysis gives the maintenance team permission to treat assets differently, and that difference is what cuts downtime.
The easiest way to act on criticality analysis is to group assets into tiers and set a standard response for each tier. Many plants use three or four tiers. The matrix below uses four and works as a starting point.
| Tier | What It Means | Example Assets | Standard Maintenance Response |
|---|---|---|---|
| Tier 1: Critical | Failure stops production, affects safety, or has no backup. | Bottleneck press, main air compressor, boiler feed pump. | Immediate response, condition monitoring, deep PM, critical spares on hand. |
| Tier 2: High | Failure slows production or has a slow backup. | Packaging line conveyor, process chiller. | Same-shift response, time-based PM, key spares stocked. |
| Tier 3: Medium | Failure causes inconvenience or a short delay. | Standby pump, building HVAC unit. | Response within days, basic PM, parts on order. |
| Tier 4: Low | Failure has little or no impact. | Office equipment, spare fans. | Run to failure, repair when convenient. |
Write the matrix into your maintenance procedures, so every planner, supervisor, and technician uses the same rules. Review it with production leaders, since they own the impact side of the score.
Want to see which Tier 1 assets fail most often? Check each one with the free Cryotos MTBF calculator and start with the lowest values.
A criticality ranking only helps when it changes what the team does each day. Most of the downtime benefit comes from five levers that every maintenance team controls.
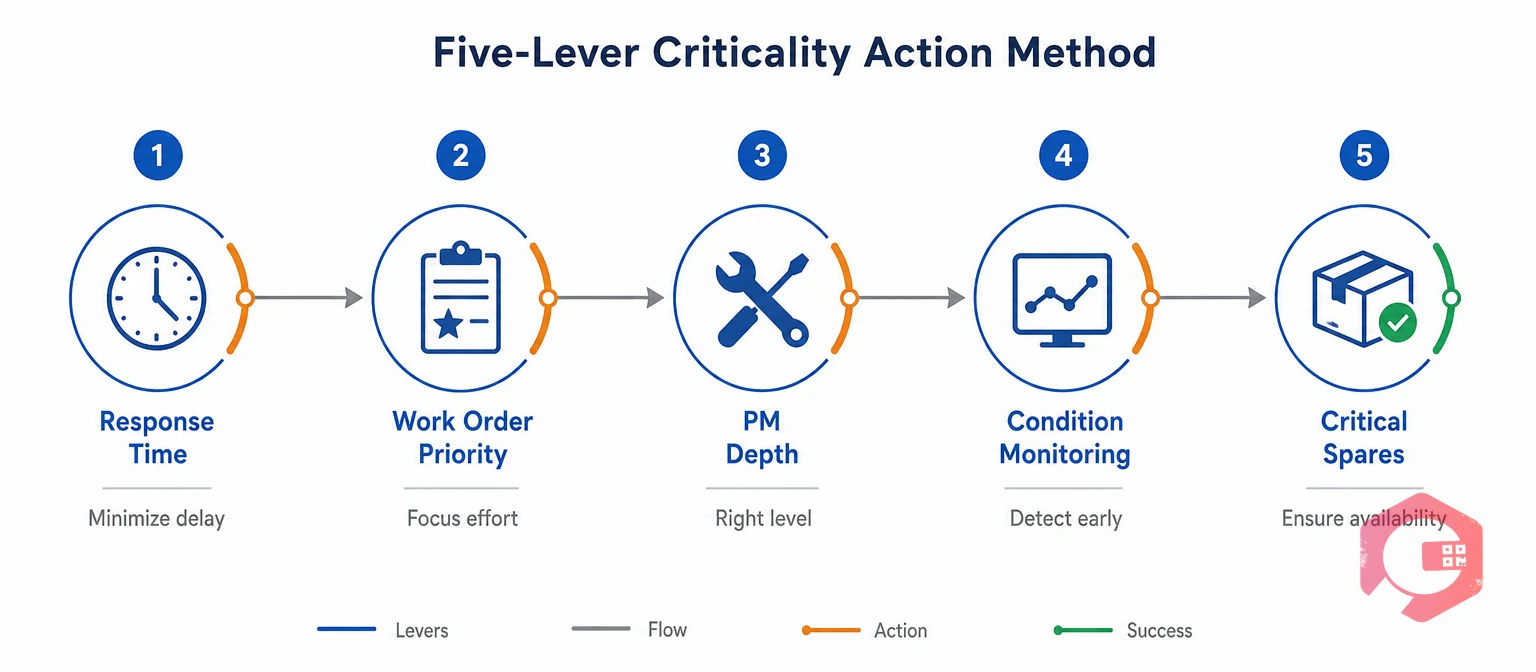
The Five-Lever Criticality Action Method:
Each lever is covered below. Apply all five to Tier 1 first, then work down the list.
Response rules are the fastest way to turn criticality analysis into less downtime, because they change behavior on the next breakdown.
Asset tier alone does not set priority. A minor oil drip on a Tier 1 press is less urgent than a full stop on a Tier 2 conveyor. Score each request on two questions: how critical is the asset, and how severe is the fault right now? The combination sets the work order priority.
Clear priority rules also reduce arguments between production and maintenance, because the rule decides, not the loudest voice.
Criticality analysis should change how much planned work each asset receives. The goal is to spend PM hours where they prevent the most downtime.
Load these tasks into preventive maintenance software, so the depth of work follows the tier automatically.
Condition monitoring is usually worth the cost on Tier 1 and some Tier 2 assets. Vibration routes, thermal scans, oil analysis, and live sensor readings give days or weeks of warning before a failure. Readings from IoT meter reading can raise a work order as soon as a value crosses its limit.
A good rule is to monitor an asset when the cost of one surprise failure is higher than a year of monitoring it.
Long repairs on critical assets often come from waiting for parts, not from the repair itself. Criticality analysis shows which parts deserve a place on the shelf.
Track these parts in inventory management and link each one to its asset, so planners can see at a glance which critical repairs are covered.
The example below is illustrative, based on patterns common in mid-sized plants. A food packaging plant with 120 assets ran a criticality analysis and grouped its equipment into four tiers.
| Tier | Number of Assets | Share of Unplanned Downtime Hours | Main Change Made |
|---|---|---|---|
| Tier 1 | 14 | About 60% | Added vibration routes, deeper PM, and stocked critical spares. |
| Tier 2 | 31 | About 30% | Moved to run-hour PM and same-shift response. |
| Tier 3 | 45 | About 8% | Extended PM intervals and freed technician hours. |
| Tier 4 | 30 | About 2% | Moved to run-to-failure. |
The team used the hours freed in Tiers 3 and 4 to fund the extra work on Tier 1, so total maintenance labor stayed about the same. Over the next six months, the plant tracked unplanned downtime on Tier 1 assets each week and reviewed every Tier 1 failure.
The lesson is that criticality analysis does not need a bigger budget. It moves existing effort from assets that do not drive downtime to the ones that do.
Track a small set of KPIs by tier to prove that criticality analysis is working. Tier-level numbers show the effect far more clearly than plant-wide averages.

Use downtime tracking to split stop hours by asset and tier, so the trend is visible every week rather than at year end.
Criticality analysis is not a one-time study. Rankings drift as production changes, equipment ages, and backups are added or removed.
A ranking that matches today's plant keeps every lever pointed at the right assets.
Most criticality programs fail at the follow-through, not the scoring. Maintenance teams that successfully cut downtime avoid these mistakes:
Fixing these habits turns criticality analysis from a document into a daily decision tool.
A Computerized Maintenance Management System stores each asset's criticality tier and uses it to drive scheduling, priority, and reporting automatically.
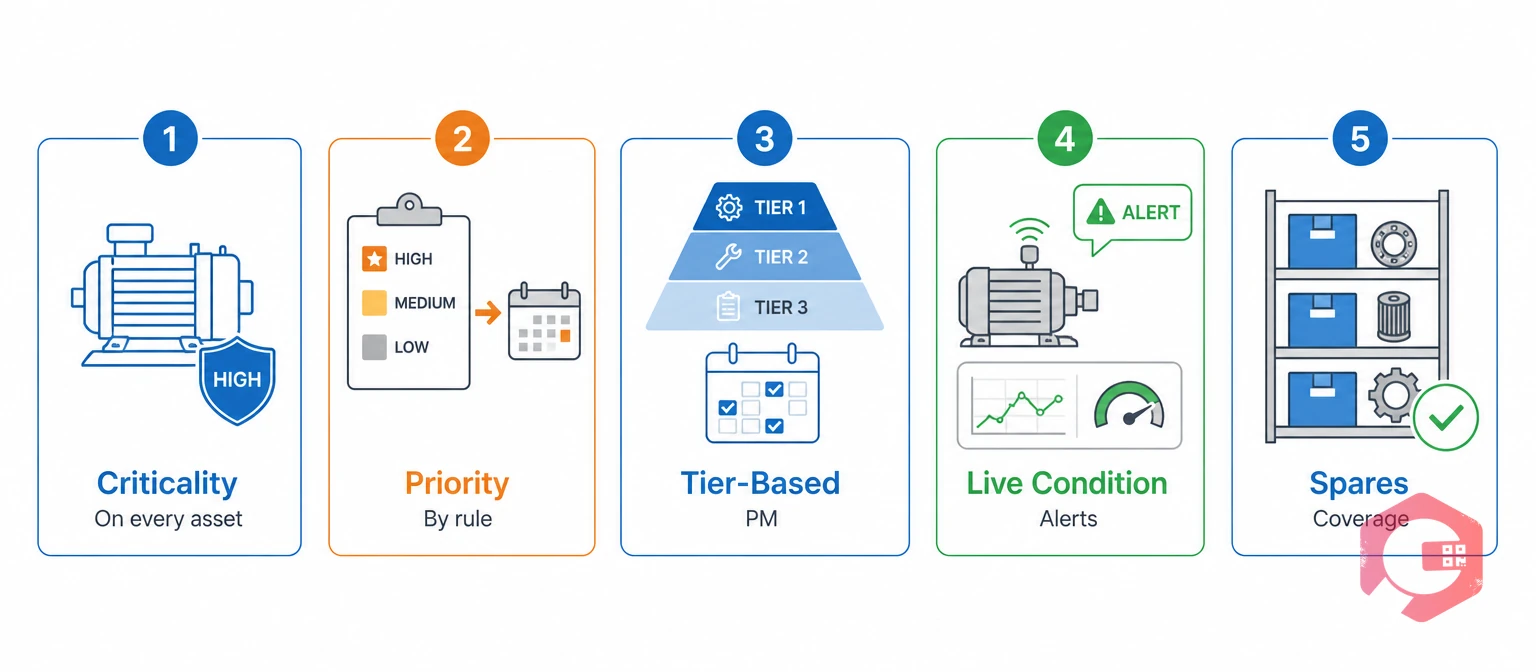
The results show up in uptime. Maintenance teams using Cryotos have reported up to 30% reduction in unplanned downtime and 25% faster repair turnaround. Much of that comes from aiming work at the assets that matter most.
When criticality lives inside the maintenance system, the ranking shapes every decision without anyone having to look it up.
The main goal is to focus limited maintenance time and budget on the assets whose failure would hurt safety, production, quality, or cost the most. The ranking guides response times, PM depth, condition monitoring, and spares.
Most plants use three or four tiers. Fewer tiers are easier to apply, while more tiers give finer control. Keep the top tier small, often 10 to 20 percent of assets, so it still means something.
Include maintenance, production, safety, and quality leads. Maintenance knows failure history and repair effort, while production and safety know the real impact of a stop.
Review the full ranking at least once a year. Also re-score assets after major failures, process changes, new product lines, or changes to backup equipment.
No. Criticality analysis ranks whole assets, while FMEA and RCM look at individual failure modes and the right task for each. Many teams use criticality to choose which assets get a full FMEA or RCM review first.
Yes. A small team can score assets in a simple spreadsheet in a few sessions. The biggest gains come from applying the result, such as faster response and better spares for the top tier.
Criticality analysis cuts downtime when the ranking drives every response, PM task, and spare part decision. Schedule a free demo to see how Cryotos puts asset criticality on every work order and reports downtime by tier.


Cryotos AI predicts failures, automates work orders, and simplifies maintenance—before problems slow you down.