Life cycle cost analysis (LCCA) is a method that totals every cost of owning equipment over its service life. You convert each cost to present value, then compare options on one number instead of the purchase price.
A cheap machine that fails often can cost far more than a pricier, reliable one. This guide shows how to perform life cycle cost analysis in six steps. It includes a worked 10-year example and the records you need from your maintenance system. It also covers the biggest challenge teams face, missing cost history, and how Cryotos solves it.
Key Takeaways

Life cycle cost is the total of all costs an asset creates between purchase and disposal. Life cycle cost analysis compares equipment options on that total over a fixed study period.
ASTM E917 and NIST Handbook 135 document the method, and ISO 55000 frames asset decisions around whole-life value. The Whole Building Design Guide overview of LCCA is a useful public primer. Teams use it for three kinds of decisions.
Most maintenance teams feel the gap between price and cost every year. For continuously running motors, energy typically dwarfs the purchase price. The Hydraulic Institute and Europump guide to pump life cycle costs reaches a similar conclusion.
LCCA is closely related to total cost of ownership, but it adds discounting and a defined study period. It also treats maintenance costs and downtime as core inputs, so it turns a purchase debate into a cost model you can defend.
Start by writing the decision as one question, such as "overhaul this compressor or replace it." Then fix one study period for every option. A 10-year period is common for rotating equipment.
If options have different lives, keep the same study period and credit any remaining value as salvage, or compare equivalent annual cost.
A clear question and a fixed period keep the analysis honest.

Sort every cost into six buckets so nothing hides outside the analysis.
The Six-Bucket Life Cycle Cost Framework:
Downtime is the bucket teams most often leave out, and it is often the largest. Give it a cost per hour from lost margin, overtime, and scrap, and agree on that number with finance.
To size your own maintenance bucket, try the mean maintenance cost calculator.
Collect actual cost and failure data from your maintenance records before you estimate anything. Vendor brochures supply price and rated energy use, but your own history shows repair frequency, repair cost, and downtime hours.
A Computerized Maintenance Management System keeps these records on one asset, so the cost history becomes a report instead of a research project. Real history makes the analysis defensible when finance asks where a number came from.
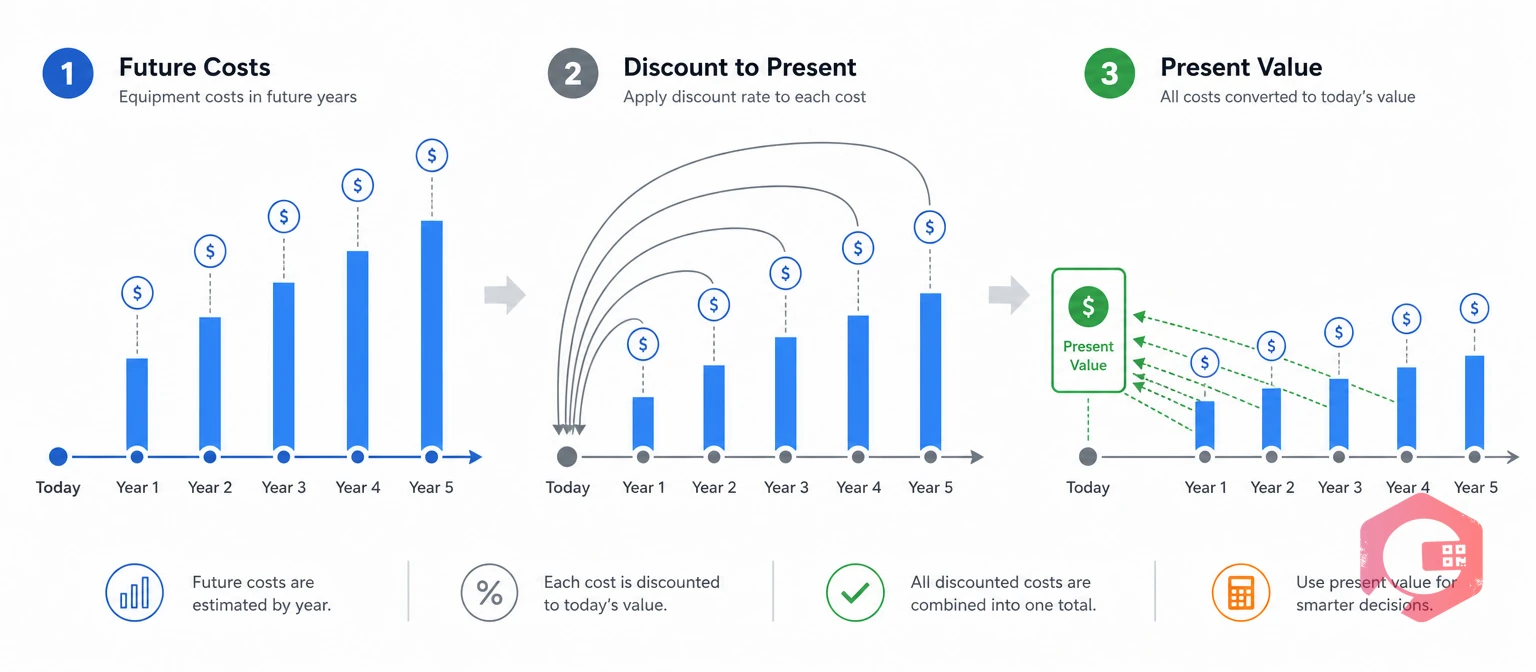
Net present value is the sum of all costs, each discounted back to today's money. The net present value method lets you compare options that spend money in different years.
The discount rate is the yearly percentage used to convert future costs into present value. Agree on it with finance, because it reflects your cost of capital.
Equivalent annual cost is the yearly cost of owning an asset once all costs are spread over its life. Use EAC = NPV × r ÷ (1 − (1 + r)^−n) to compare options with different lives.
Comparing options means running every cost bucket through the same present value math. This illustrative example uses a 10-year study, an 8% discount rate, flat costs, and downtime valued at $1,250 per hour. The figures are assumptions, not customer data.
| Cost Bucket | Keep and Overhaul (Present Value) | Replace (Present Value) |
|---|---|---|
| Acquire (overhaul or purchase) | $18,000 | $150,000 |
| Operate (energy) | $255,000 | $208,000 |
| Maintain (planned work) | $40,300 | $47,000 |
| Fail (corrective repairs) | $67,100 | $20,100 |
| Fail (downtime) | $151,000 | $50,300 |
| Retire (salvage value) | $0 | -$6,900 |
| Total present value | $531,400 | $468,500 |
| Equivalent annual cost | $79,200 | $69,800 |
Replacing is about $62,900 cheaper in present value, even though it costs $132,000 more up front. Downtime and repair savings drive most of the gap. Figures are rounded to the nearest $100, and the example leaves out the Hold bucket for simplicity.
Stress-test the result by changing one assumption at a time and watching whether the ranking flips. In the compressor example, one input matters far more than the rest.
The decision hinges on downtime hours, so verify that number with maintenance records, not vendor claims.
Most life cycle cost analysis errors come from five habits that are cheap to fix.
Fixing these five habits makes the result far easier to defend.
The biggest challenge in life cycle cost analysis is rarely the math. It is finding trustworthy cost history for the asset you are judging.
Picture a plant deciding whether to overhaul or replace an 11-year-old compressor. This scenario is a composite of patterns common to maintenance teams, not a single customer account.
Without history, the team argues from opinion, and the lowest upfront cost usually wins.
Cryotos solves the data problem by keeping every cost and failure record on one asset history. The inputs to life cycle cost analysis then come from reports, not memory.
In the compressor scenario, the team exports the asset's work orders, downtime hours, and parts spend. They enter those figures into the present value model. Maintenance teams using Cryotos have reported up to 30% reduction in unplanned downtime and 25% faster repair turnaround. Downtime is the input that moves the result most.
Cryotos does not replace the discount rate from finance or the engineering judgment behind the study period. It supplies the records, and a spreadsheet runs the present value math.
Life cycle cost analysis adds up everything an asset costs from purchase to disposal and converts it to today's money. You can then compare options fairly, even when one costs more up front.
Total cost of ownership totals the costs of owning an asset. LCCA usually adds discounting over a defined study period and ranks competing options. Many teams use the two terms loosely.
Use the rate your finance team sets for investments, often tied to cost of capital. Match it to your dollar type, and test a range, because the ranking can change.
Replace when the present value of keeping the asset, including repairs, energy, and downtime, exceeds the present value of replacing it. Rules of thumb, such as repair cost above half of replacement value, are only quick screens.
Equipment decisions get easier when the cost history is already on file. Schedule a free demo to see how Cryotos keeps work orders, downtime, parts, and budget on one asset record.


Cryotos AI predicts failures, automates work orders, and simplifies maintenance—before problems slow you down.