
Criticality vs risk analysis comes down to one question each. Criticality asks how badly a failure would hurt. Risk asks how likely that failure is and how badly it would hurt. Maintenance teams use criticality to rank assets by consequence, then use risk to decide which of those assets need action first. Together, the two point scarce maintenance hours at the few assets that cause most unplanned downtime.
Many plants stop at the criticality ranking. That leaves a reliable but important machine over-maintained and a failing, mid-ranked one ignored. This guide shows how the methods differ, how to combine them in five steps, and how to put the result into daily work.
Key Takeaways
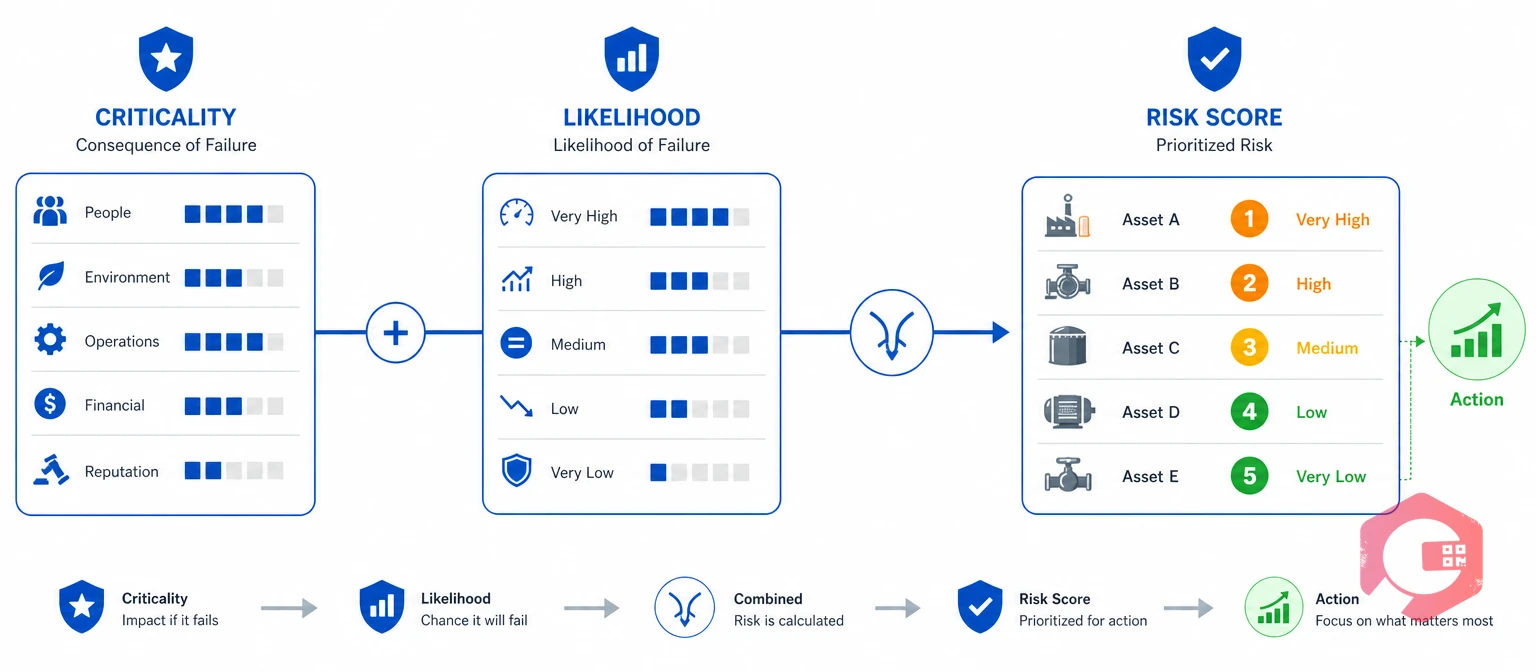
Asset criticality analysis is a ranking of equipment by the consequence of its failure. It scores safety, production, quality, and repair-cost impact, then sorts assets into tiers.
Asset risk analysis is a score that combines the consequence of a failure with its likelihood. Likelihood comes from failure history, age, and condition data. A criticality vs risk analysis uses the first method to build a shortlist and the second to order it.
| Aspect | Criticality analysis | Risk analysis |
|---|---|---|
| Core question | How bad is it if this asset fails? | How likely is failure, and how bad would it be? |
| Inputs | Safety, production, quality, and cost consequences | Consequence plus failure history, age, and condition |
| Output | A fixed tier, usually 1 to 4 | A score that moves over time |
| Update cycle | Yearly, or after a process change | After repeat failures, repairs, or condition changes |
| Best use | Setting standard response levels and critical spares | Deciding which assets get work first this quarter |
A typical criticality score asks four questions about each asset:
Both methods fit ISO 55000 asset management thinking, which expects decisions to follow risk and value. Reliability engineering practices such as FMEA and reliability-centered maintenance (RCM) rely on the same consequence-and-likelihood logic. In short, criticality shows which assets matter, and risk shows which of them need work now.
Criticality alone falls short because it ignores how often an asset fails. A critical asset with a clean record and a fresh overhaul can receive the same care as a critical asset that failed three times last year.
Consider a backup generator that runs a few hours a year. Its production impact looks low, yet it must start on demand during an outage, so a failed test is a serious warning. Only a likelihood score captures that signal, which is why a criticality vs risk analysis beats a single ranking.
Most maintenance teams find this out when a mid-ranked asset causes a stop nobody expected. Risk analysis closes the gap by adding failure history. A Computerized Maintenance Management System (CMMS) already records that history. General risk management scores likelihood and consequence together, and probabilistic risk assessment applies the idea to complex systems. Criticality picks the shortlist, and risk orders it.
To turn failure history into a likelihood score, run each asset's failure intervals through the MTBF calculator.
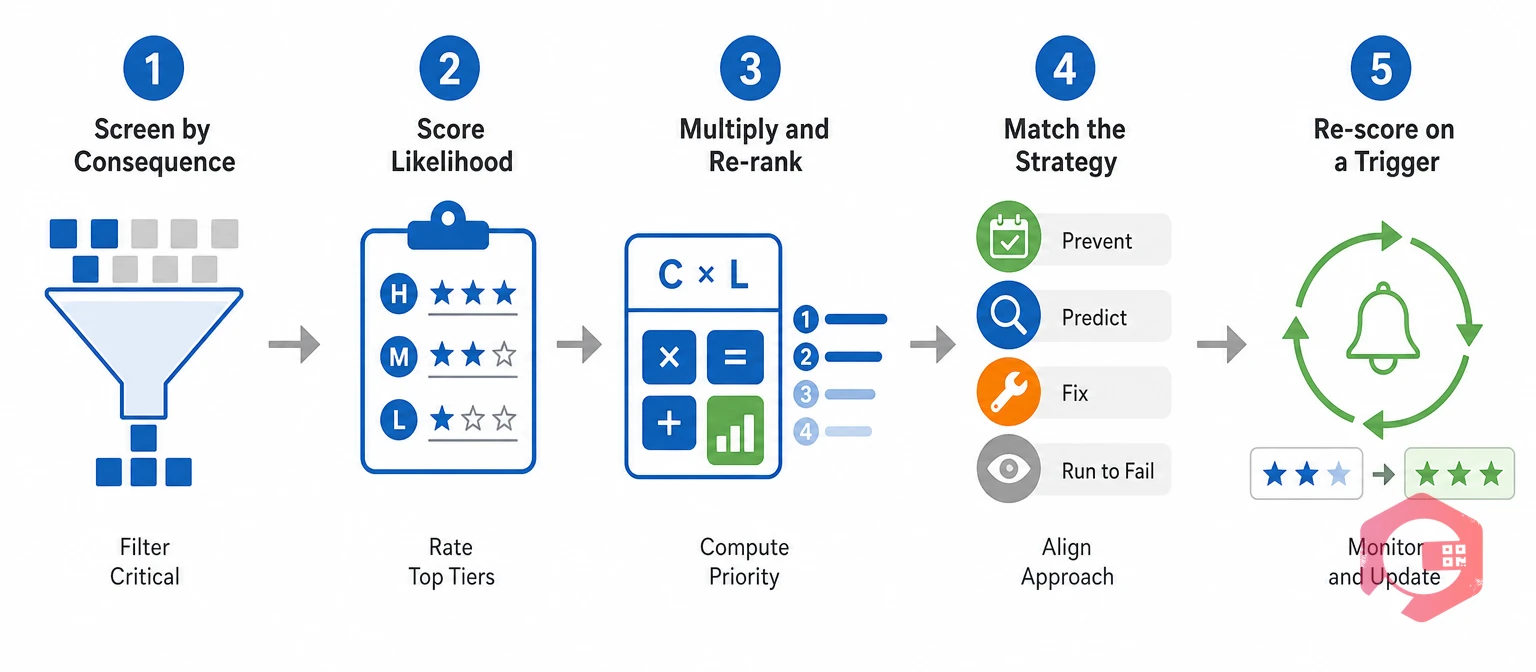
The fastest way to combine both methods is to run criticality first as a screen, then hand the top tiers to a risk score. Criticality vs risk analysis works best as a sequence, not a contest.
The Criticality-to-Risk Handoff Method:
Step 4 is where most programs stall, because the strategy has to land in a schedule. Preventive maintenance software lets teams set PM frequency and checklists per asset, so a high-risk score changes real work.
Likelihood is the hard half of the score, but work order history gives most teams enough to start. Pull 12 to 36 months of failures per asset, compare age against expected life, and add condition readings where you have them. Use a simple starting scale, then adjust it to your own failure rates:
A rough likelihood score built from real failure history beats a perfect score that never gets built.
A risk score is consequence multiplied by likelihood, each rated on a 1 to 5 scale. The scorecard below shows how the two methods can reorder the same five assets. The scores are illustrative, not client data.
| Asset | Consequence (C) | Likelihood (L) | Criticality rank | Risk score (C x L) | Risk rank |
|---|---|---|---|---|---|
| Main air compressor | 5 | 2 | 1 (tie) | 10 | 3 |
| Emergency generator | 5 | 3 | 1 (tie) | 15 | 2 |
| Packaging gearbox | 4 | 5 | 3 | 20 | 1 |
| Boiler feed pump | 3 | 3 | 4 | 9 | 4 |
| Cooling tower fan | 2 | 4 | 5 | 8 | 5 |
The packaging gearbox ranks third on criticality but first on risk, because it keeps failing. The compressor drops from first to third, since it is reliable after a recent overhaul.
A simple banding turns scores into action. Treat these cut-offs as a starting point and tune them to your own risk tolerance:
The same five assets get a different priority order once likelihood enters the score, and the bands tell the planner what to do next.
The most common challenge in criticality vs risk analysis is that the ranking lives in a spreadsheet while work orders, PM schedules, and spares follow habit. A study gets done, a slide gets presented, and the next breakdown goes to whoever shouts loudest. Cryotos has published one example of the fix: at BorgWarner, criticality-driven PM scheduling cut unplanned stoppages across its manufacturing lines.
Cryotos maintenance management software gives teams five places to put a risk ranking to work:
Maintenance teams using Cryotos have reported up to 30% reduction in unplanned downtime and 25% faster repair turnaround. Much of that comes from aiming work at the assets where failure hurts most. A risk ranking cuts downtime only once it controls the schedule, the queue, and the shelf.
Most teams that struggle with criticality vs risk analysis make one of four mistakes, and each is easy to avoid.
Treat the score as a living record, and the program keeps earning its time.
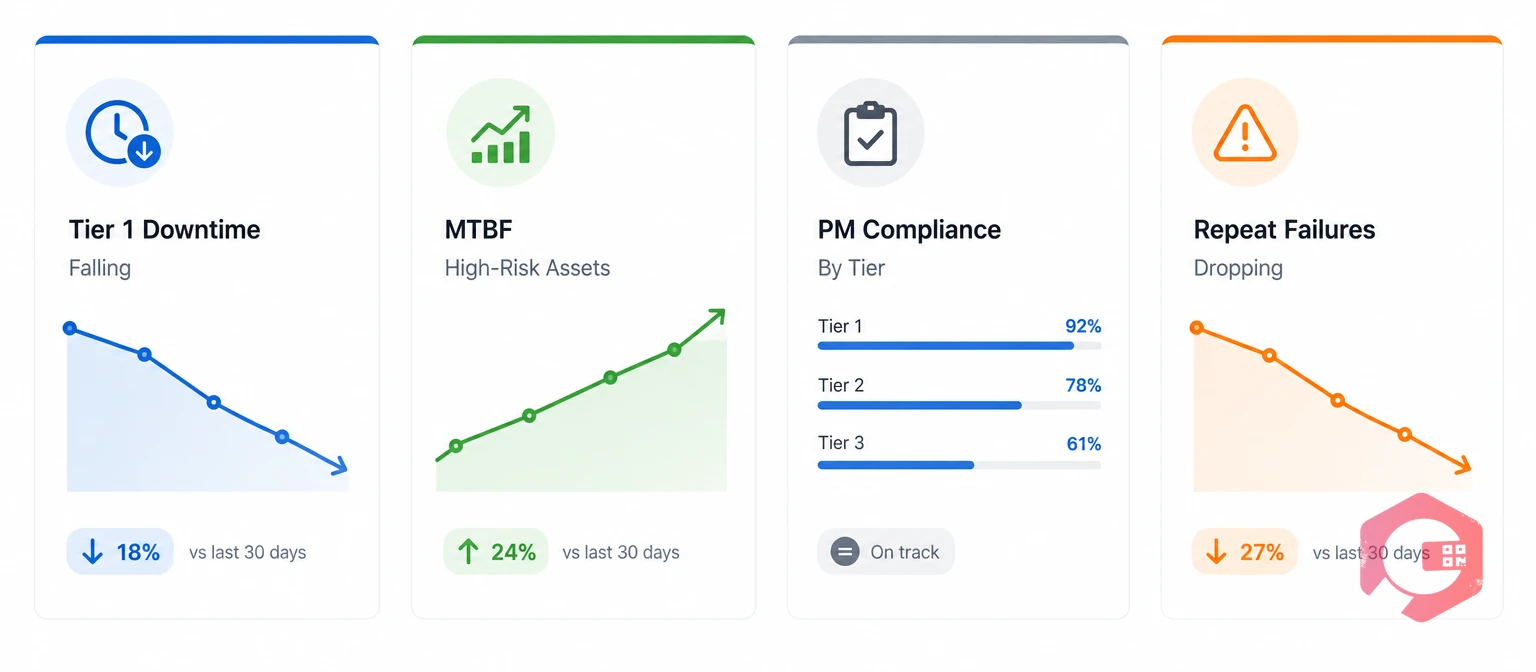
Four metrics show whether a criticality vs risk analysis program is paying off, and teams that track them by tier can see within a quarter whether a high-risk asset is improving.
Review these figures alongside standard maintenance KPIs each month. Metrics tied to tiers turn a one-off study into a living program.
Criticality measures the consequence of an asset failing. Risk multiplies that consequence by the likelihood of failure. A critical asset can be low risk if it is reliable, and a mid-ranked asset can be high risk if it fails often.
It points PM hours, condition monitoring, and spares at the assets most likely to stop production. Teams stop over-maintaining reliable machines and start fixing repeat offenders.
Run criticality first. It is a quick screen that sorts hundreds of assets into tiers. Then score likelihood only on the top tiers, which keeps the risk work small and focused.
Re-score after any repeat failure, major repair, or process change, and review the full list once a year. Likelihood changes as assets age, so a static score goes stale quickly.
Prioritizing by consequence and likelihood turns maintenance from firefighting into planned work. Schedule a free demo to see how Cryotos puts asset priority into PM schedules, work orders, and downtime reports.



Cryotos AI predicts failures, automates work orders, and simplifies maintenance—before problems slow you down.