
Dashboard reports in a CMMS can predict which production line will fail next quarter by combining three leading indicators — MTBF trend decline, rising breakdown occurrence (BDO), and falling OEE availability — into a line-by-line risk scorecard reviewed on a 90-day rolling basis.
Most maintenance teams look at their CMMS dashboards reactively: they check last month’s downtime after it has already happened. The teams that consistently avoid costly surprises do something different. They read dashboard trends forward — spotting the early signals of a deteriorating line weeks or months before the failure occurs. According to a Deloitte analysis of predictive maintenance in Industry 4.0, companies that use data-driven maintenance prediction reduce unplanned downtime by 30–50% compared to calendar-based programs.
This guide gives you the specific metrics to track, the thresholds to set, and the quarterly review process to run — so your CMMS dashboard tells you which line needs attention before next quarter begins, not after it ends.
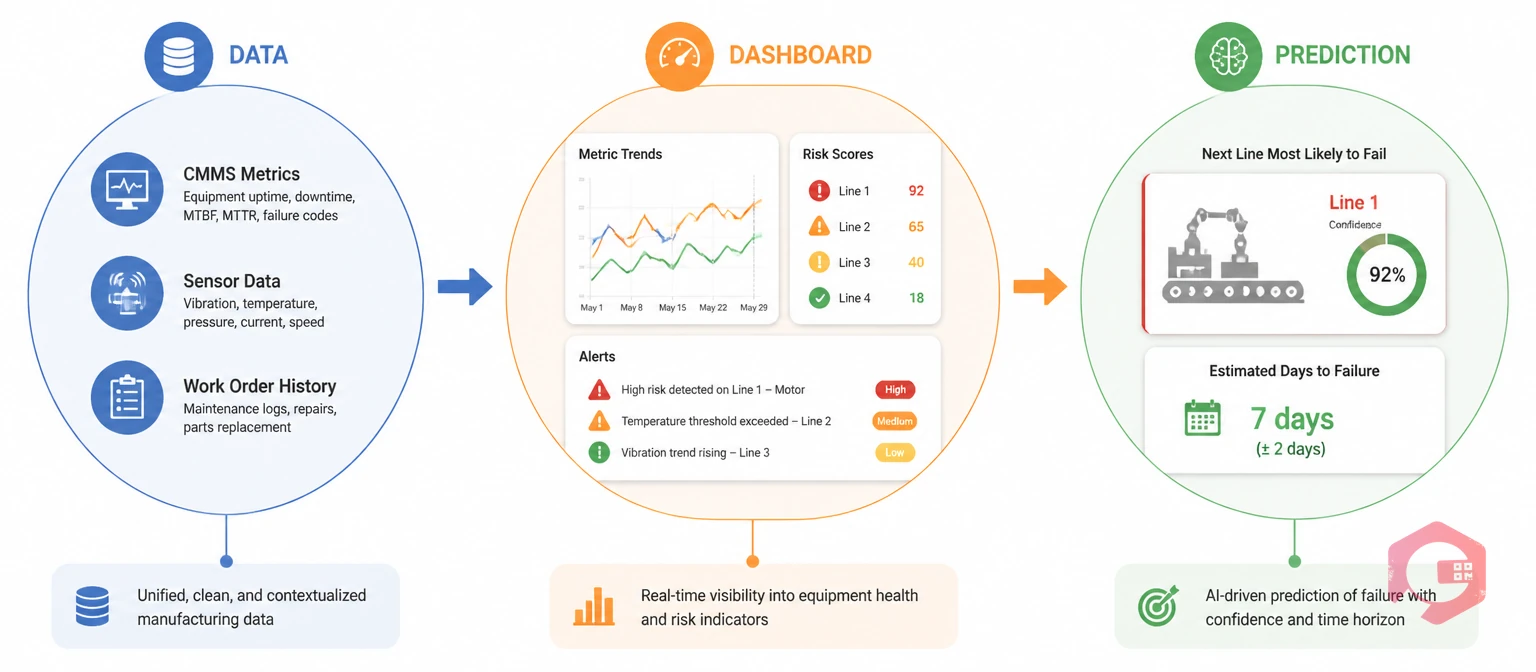
Dashboard-based production line failure prediction is the practice of using CMMS reporting data — specifically historical trends in reliability KPIs — to identify which lines are showing early deterioration patterns that statistically precede major failures within 30 to 90 days.
This is not the same as predictive maintenance powered by IoT sensors and machine learning models. That approach requires sensor infrastructure and data science capability. Dashboard-based prediction is more accessible: it uses the maintenance and downtime data your CMMS is already collecting, analysed through structured trend review rather than algorithms.
The key insight is that production line failures rarely arrive without warning. They are almost always preceded by a measurable pattern in your CMMS data: failure events start clustering, repair times creep up, and overall equipment effectiveness starts deteriorating in the availability dimension. The problem is that most maintenance managers only see these patterns in hindsight — after the major failure has already forced an emergency shutdown. A disciplined quarterly dashboard review flips that dynamic.

You do not need to monitor dozens of KPIs to predict which line is at risk. Three metrics, read together on a 90-day rolling trend, give you the clearest forward-looking signal available from CMMS data alone.
Mean Time Between Failures (MTBF) measures how long a line runs, on average, between unplanned breakdowns. A single MTBF reading tells you very little. The trend over time tells you a great deal. When MTBF drops consistently across three consecutive monthly reporting periods — even if each individual month still looks acceptable in isolation — the line is telling you that failures are arriving earlier and earlier. A 15% or greater decline in MTBF over a 60-day period is a strong early warning signal that warrants investigation before it becomes a crisis.
According to Reliable Plant reliability research, MTBF decline precedes major equipment failures by an average of 6 to 10 weeks in manufacturing environments. That window is exactly the lead time you need to schedule a proactive intervention rather than an emergency repair. Use Cryotos’s MTBF calculator and report builder to plot this trend monthly, by production line.
Breakdown Occurrence (BDO) counts the number of unplanned failure events on a line within a reporting period. When a single line’s BDO increases quarter-over-quarter — particularly when other lines in the same facility are stable — that line is carrying a disproportionate failure load. This is not just a maintenance problem. It is a risk signal.
The threshold to watch: if one line’s BDO is more than 40% higher than your facility’s average BDO per line in a given quarter, that line is a candidate for pre-quarter intervention. The BDO comparison across lines is a simple but powerful filter that most maintenance reports do not surface automatically — it requires a cross-line view that your CMMS report builder should be configured to provide. Cryotos’s downtime tracking module captures BDO by asset, department, and line in real time, making this comparison straightforward.
Overall Equipment Effectiveness (OEE) has three components: Availability, Performance, and Quality. For failure prediction, the Availability component is the most actionable. It measures the percentage of planned operating time during which a line is actually running. When Availability starts declining on a specific line — even while Performance and Quality remain stable — that line is spending more and more time in unplanned repair states.
A world-class Availability target for production lines in manufacturing is 90% or above. When a line’s Availability drops below 80% for two consecutive months, or shows a consistent downward trend from a healthy baseline over 90 days, flag it for quarterly pre-intervention review. According to McKinsey’s manufacturing reliability research, Availability is the single most controllable OEE dimension through maintenance management — and the first to deteriorate ahead of a major failure event.
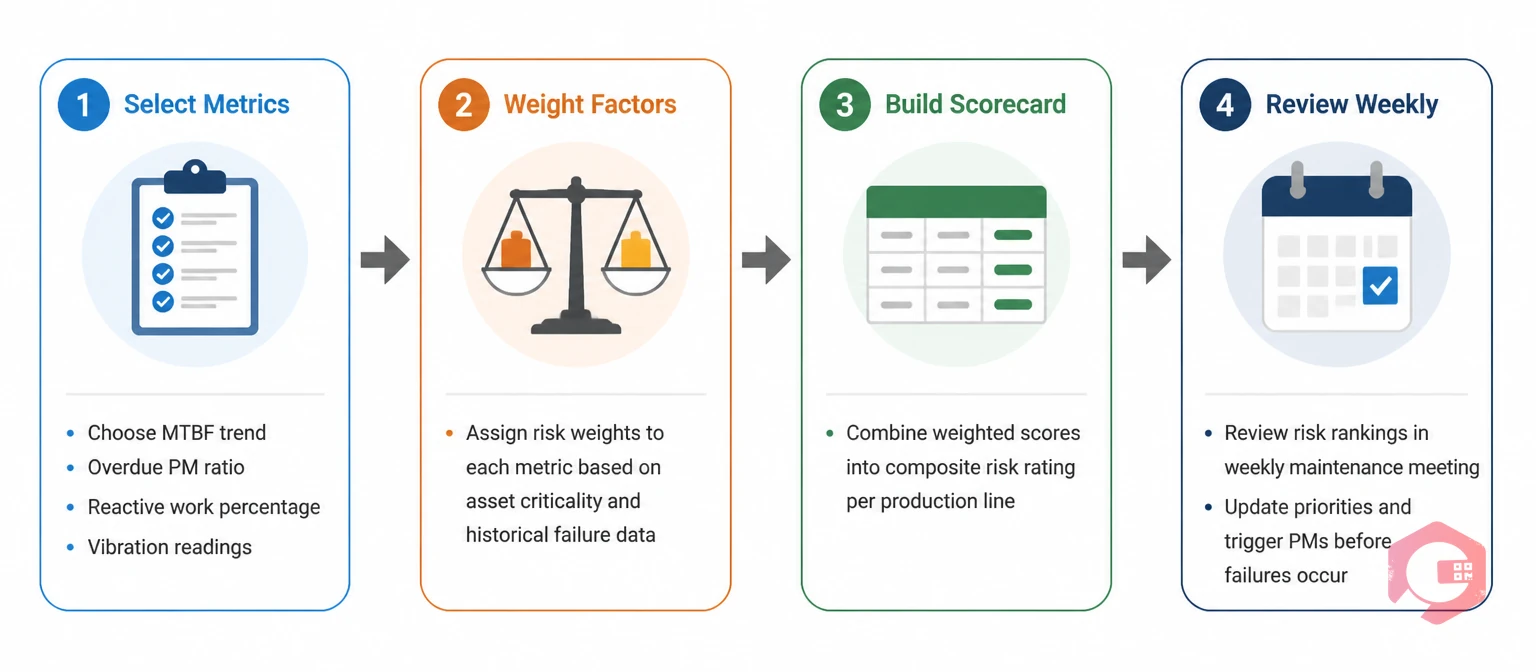
A risk scorecard turns the three signals above into a structured, repeatable quarterly review process. Here is how to set it up in three steps using your CMMS report builder.
At the start of each quarter, run a 90-day summary report for every production line in your facility. The report should capture, for each line: MTBF at month 1, month 2, and month 3 of the prior quarter; BDO per month and total for the quarter; and OEE Availability percentage by month. Export these as a structured view — either within the CMMS dashboard or via the report builder — so you can compare all lines side-by-side. This is the raw material for the scorecard.
Apply a simple three-signal scoring framework to each line. For each signal, assign a flag: Green (no concern), Amber (watch), or Red (intervene). Use these thresholds as your starting point:
A line with two or more Red flags is your highest-priority intervention target heading into the next quarter. A line with three Amber flags deserves a closer look even if no single metric has crossed the Red threshold.
For every line that scores two or more Red flags, schedule a pre-quarter maintenance review before production targets are set for the coming quarter. This review should include: a root cause investigation of the top three recurring failure modes from the prior 90-day report; a FMEA check on the highest-frequency failure types; a spare parts audit for critical components on that line; and a PM schedule review to check whether current intervals still match actual failure frequency. The goal is to convert the next quarter’s likely unplanned failures into planned maintenance interventions — before the quarter begins.
The risk scorecard is a quarterly process. But your CMMS dashboard should also be running continuous threshold alerts so that deteriorating lines surface in real time — not just at quarter-end reviews.
Configure your CMMS to fire an automatic alert when any of the following conditions occur on a production line:
According to OSHA’s preventive maintenance guidelines, proactive threshold-based alerts are among the most effective risk-reduction measures available to industrial maintenance programmes. The key is setting thresholds that are sensitive enough to catch early signals without generating so many alerts that teams start ignoring them. Start conservative — tighter thresholds — and loosen them only if alert volume becomes operationally unmanageable.
Cryotos’s BI Dashboard supports drill-down from organisation level to individual line and asset level, with scheduled reporting delivered daily or weekly to your email. This means a maintenance manager does not need to log in and manually check every line — the dashboard brings the signals to them.
Running this process manually — pulling data from spreadsheets, calculating trends, comparing lines — is exactly the kind of work that does not get done consistently under production pressure. The value of a CMMS is that it automates the data collection and surfaces the signals without requiring a separate analysis project.
Cryotos is built to support the quarterly failure prediction workflow described in this guide across three core capabilities. First, the maintenance management platform captures every breakdown event with timestamps, duration, line, asset, and failure mode — so the BDO and MTBF trend calculations run automatically from real operational data, not estimates. Second, the Report Builder allows maintenance managers to create custom cross-line comparison reports with the specific fields needed for the risk scorecard — MTBF trend, BDO per period, Availability by month — and schedule them to run and deliver automatically at the start of each quarter. Third, the BI Dashboard provides a live view of OEE components by line, with drill-down to asset level, so that a deteriorating line surfaces in the visual before it shows up in a formal report.
Maintenance teams using Cryotos have reported a 30% reduction in unplanned downtime and 25% faster repair times — outcomes that align directly with the kind of pre-quarter intervention that dashboard-based failure prediction enables. When a line is flagged in the quarterly scorecard and addressed with targeted PM before production begins, the quarter runs without the emergency that would otherwise have consumed those gains.
For facilities with IoT sensor infrastructure, Cryotos also supports IoT meter reading integration — connecting live sensor data from SCADA, PLC, and edge devices directly to the CMMS, so that condition-based alerts supplement the trend-based dashboard signals described here. The two approaches together — dashboard trend review and real-time sensor thresholds — give maintenance teams the most complete early-warning picture available without a dedicated data science team.
If your production lines are still catching you off guard at the start of each quarter, the issue is almost certainly not a lack of data — it is a lack of a structured process for reading the data you already have. Cryotos gives your team the dashboard infrastructure to run that process consistently. Explore all Cryotos features to see how the BI Dashboard and report builder work in a real manufacturing environment.
With consistent quarterly trend monitoring of MTBF, BDO, and OEE Availability, most developing failures can be identified 30 to 90 days before they occur. The lead time depends on how quickly the deterioration pattern appears in the data. Lines with gradual wear-related failures typically show 60 to 90 days of signal; lines with sudden component failures may show only 30 days. Running automated threshold alerts alongside quarterly reviews maximises the lead time you capture.
Predictive maintenance typically refers to sensor-driven, algorithm-based failure detection using real-time data from vibration sensors, thermal cameras, or oil analysis equipment. Dashboard-based failure prediction uses the historical maintenance records already in your CMMS — breakdown events, downtime hours, repair times — analysed through trend review rather than live sensor data. The dashboard approach requires no additional sensor investment and works with any facility that has been running a CMMS for at least three to six months.
Prioritise lines where the cost of unplanned downtime is highest — typically the lines with the highest production output, the lowest spare capacity, or the longest repair times. Your CMMS downtime data will show you which lines have historically produced the most expensive failures. Start the scorecard process on your top five to ten highest-criticality lines, then expand to all lines once the process is running consistently.
A formal quarterly scorecard review is the recommended minimum — timed to the start of each production quarter so that findings can be acted on before targets are set. In addition, automated real-time threshold alerts in the CMMS dashboard provide continuous monitoring between formal reviews. For high-criticality lines, a monthly informal review of the three key metrics adds an additional layer of protection.
Not entirely, but it closes most of the gap for facilities without sensor infrastructure. Dashboard-based trend analysis catches the majority of developing failures because most failures are preceded by a pattern of increasing frequency and duration in breakdown data — and that data lives in your CMMS. IoT sensors add resolution and speed to the signal, particularly for sudden mechanical failures. The right answer for most manufacturing facilities is to start with dashboard-based prediction using existing CMMS data, and layer in IoT sensing on the highest-risk assets as the programme matures.
The data to predict next quarter’s production line failures is almost certainly already in your CMMS. The MTBF trends are there. The BDO counts are there. The OEE Availability history is there. What most maintenance teams are missing is not data — it is a repeatable process for reading that data forward rather than backward.
The quarterly risk scorecard described here takes less than two hours to run once the reports are configured. The cost of not running it — one emergency production shutdown, one unplanned line replacement, one missed quarterly target — will almost always exceed an entire year’s CMMS investment. Cryotos CMMS gives your maintenance team the reporting infrastructure to run this process consistently, with the BI Dashboard, report builder, and downtime tracking module working together to surface the signals before they become crises. Book a free demo today and see how Cryotos helps manufacturing teams stay ahead of the quarter.


Cryotos AI predicts failures, automates work orders, and simplifies maintenance—before problems slow you down.


