
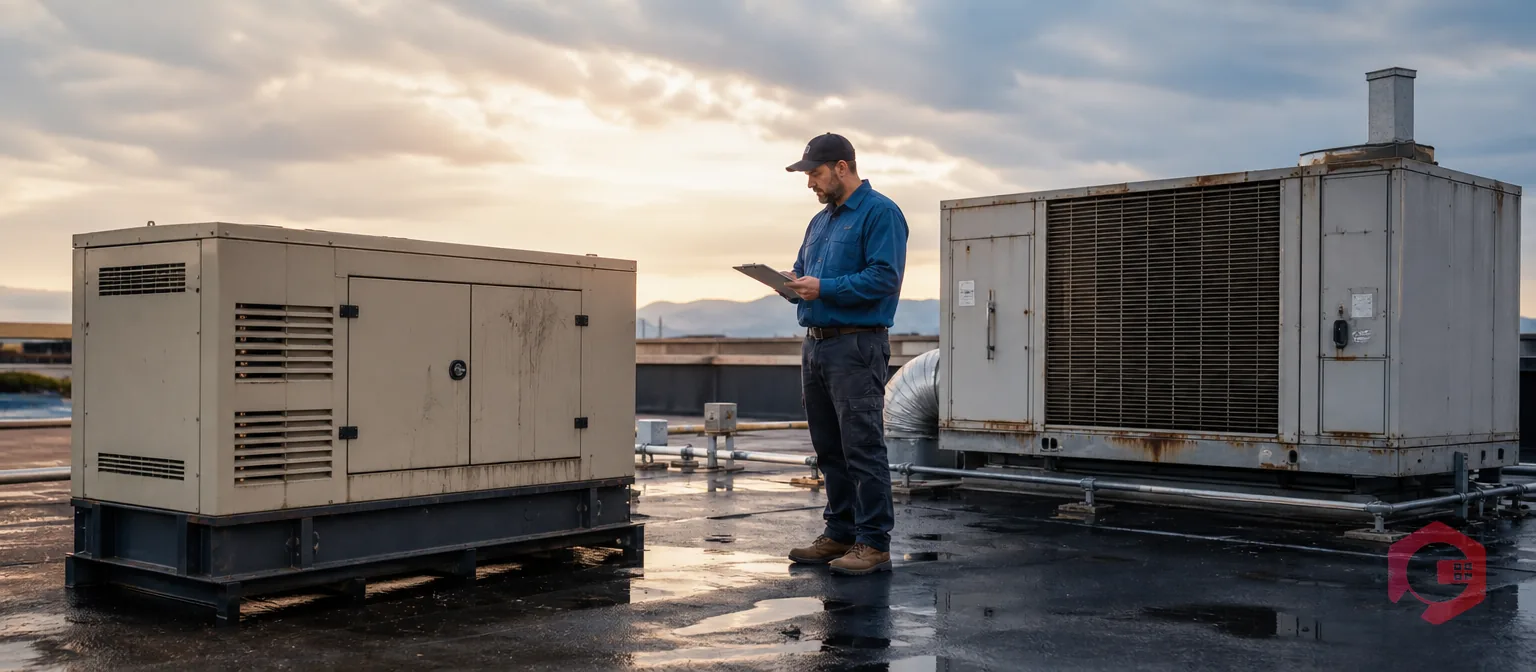
Deferred maintenance is the decision to delay a maintenance task that should happen now — and every time that decision is made, the asset involved moves closer to a failure that will cost three to five times more to fix than the original task would have. That isn't a scare statistic. It's the predictable outcome of a specific compounding mechanism that most maintenance managers understand intuitively but rarely see quantified clearly enough to act on.
The challenge isn't awareness. Most maintenance teams know that deferring PM tasks creates risk. The challenge is that deferred maintenance looks affordable in the moment — one deferred oil change, one missed filter replacement, one skipped inspection — while the cost accumulates invisibly until the failure event makes it impossible to ignore. By then, the £200 task has become a £2,000 repair, and the pattern that produced it is still running unchecked on every other asset in the facility. According to Plant Engineering's maintenance cost benchmarking research, deferred maintenance is the primary driver of unplanned downtime in facilities that don't operate a structured PM programme — and unplanned repairs consistently cost 3–5× more than equivalent planned work. This guide explains the mechanism, shows you how to find the backlog in your CMMS data, and gives you eight specific actions to break the spiral before it breaks your budget.

Deferred maintenance is maintenance work that is due, known to be due, and consciously postponed rather than completed on schedule. It's not the same as a maintenance task that hasn't been identified yet. It's not the same as a planned future task that isn't due yet. Deferred maintenance is the gap between what should have been done and what was actually done — and it accumulates as a backlog that carries real financial and operational risk.
The distinction matters because it determines where the solution lives. Unidentified maintenance needs a better inspection programme. Future maintenance needs a better scheduling system. Deferred maintenance needs a specific intervention to address the existing backlog and a systemic fix to stop the deferral habit from continuing.
Deferred maintenance typically falls into three categories. The first is intentional deferral — a PM task is postponed because the production schedule won't allow downtime, because a technician isn't available, or because a manager decides the risk is acceptable in the short term. The second is unintentional deferral — a PM task slips through because the work order wasn't created, the schedule wasn't updated, or the completion reminder didn't fire. The third is resource-constrained deferral — the task was never going to happen with available resources, and the backlog has been building for months or years without anyone acknowledging it as a systematic problem. All three produce the same outcome: an asset running past its maintenance threshold, accumulating wear and risk with every operating hour.
The 3× cost multiplier on deferred maintenance isn't arbitrary. It comes from a specific mechanism that operates the same way across asset types, industries, and facility sizes. Understanding the mechanism is the starting point for making the case — to a management team, a finance director, or a building owner — that preventive maintenance investment is not a discretionary cost.
Every maintainable asset has a window between the point where it should be serviced and the point where the consequences of not servicing it become severe. That window is the decision point — and its width varies by asset type. A bearing that needs lubrication has a wide window: miss one cycle, and the bearing still runs; miss three cycles, and you're looking at premature failure. A cooling tower's biological control programme has a much narrower window: miss one treatment cycle, and Legionella risk escalates rapidly.
The critical feature of the decision point window is that the cost of intervention stays roughly constant throughout it — the PM cost is the PM cost. But outside the window, the cost curve changes sharply. The bearing that cost £80 to lubricate now needs a £600 replacement. The Legionella risk that cost £200 to control now requires emergency remediation at £3,000 and a regulatory notification. OSHA's preventive maintenance guidance explicitly identifies the decision point concept — noting that the longer planned maintenance is deferred beyond its due date, the higher the probability and severity of resulting equipment failure. The window is the only period when the economic case for maintenance is unambiguous.
According to McKinsey's analysis of maintenance strategy economics, every £1 invested in structured preventive maintenance returns £3–5 in avoided reactive repair costs over an asset lifecycle — which directly quantifies the 3–5× cost multiplier from the other direction. The three cost components that produce this multiplier are absent in planned maintenance and present in every unplanned reactive repair.
First, consequential damage. A planned maintenance task addresses the wear item before it affects the surrounding components. A deferred task allows the wear item to damage the components around it. The failed bearing that costs £600 to replace may also destroy a £1,500 motor shaft. The clogged HVAC filter that costs £40 to replace, if ignored long enough, causes the evaporator coil to ice over and the compressor to run under elevated pressure — a £2,500 repair from a £40 maintenance task.
Second, emergency premium on parts and labour. Planned maintenance uses pre-ordered parts at standard prices with scheduled labour at standard rates. Emergency reactive repairs use whatever's available at whatever price, often with same-day delivery premiums, engineer call-out fees, and weekend or out-of-hours labour rates. The same component that costs £200 on a Monday morning purchase order costs £340 on an emergency Saturday callout.
Third, production and service impact. A planned maintenance task can be scheduled during off-peak hours, communicated to affected tenants or production teams, and completed with minimal operational disruption. An unplanned failure shuts down the asset at the moment demand for it is highest, generates tenant complaints, triggers SLA events, and displaces every other planned task in the maintenance schedule. The operational cost of a two-hour production line stoppage — lost output, disrupted schedules, overtime to recover — can dwarf the repair cost itself.

Deferred maintenance doesn't accumulate linearly. It compounds — and the compounding mechanism explains why facilities that defer maintenance don't experience a gradual decline. They experience periodic crises that get progressively worse.
The first deferral almost always is harmless. One missed PM on an asset that's running well within tolerance, in a week when reactive demand is high and the technician isn't available — that's a reasonable operational decision. The asset continues to run. Nothing fails. The deferred task gets added to next month's schedule.
But the task often doesn't happen next month either, because reactive demand is still high, because the PM compliance report doesn't surface missed tasks prominently, or because the rescheduled task competes with new reactive jobs for the same technician time. By month three, the asset is two PM cycles behind. The wear that the missed PM was designed to address has accumulated. The asset is still running, but it's now closer to its failure threshold than the maintenance plan assumed it would be.
Stage 2 is where the spiral begins to self-perpetuate. The deferred maintenance has allowed some assets to deteriorate to the point where they start generating reactive faults. Those reactive faults add to the work order queue. The technicians who should be running PM tasks are now responding to reactive jobs. The PM completion rate falls further. More assets accumulate deferred maintenance. More assets generate reactive faults. The ratio of reactive to planned work tips past the point of no return.
According to Reliable Plant's maintenance ratio research, facilities where reactive maintenance exceeds 30% of total work order volume are already in this cycle. The reactive work isn't just expensive — it's consuming the resource that would have prevented it. Breaking the cycle requires a deliberate intervention, not just a commitment to doing more PM. The planned maintenance ratio is one of the most useful metrics for detecting this tipping point before the spiral becomes a crisis.
Stage 3 is the crisis phase. When maintenance has been deferred across an asset fleet for an extended period, the backlog doesn't resolve itself — it concentrates. The assets that were installed at the same time accumulate deferred wear at roughly the same rate, which means their failure thresholds tend to arrive at roughly the same time. When the heatwave arrives, when the production peak hits, when the building goes back to full occupancy after a holiday — the assets that needed maintenance three months ago start failing simultaneously.
The maintenance team is overwhelmed. SLAs breach. Tenants complain. Emergency contractors are mobilised at premium rates. The cost of the crisis far exceeds the accumulated cost of the PM tasks that would have prevented it — and the underlying backlog still exists on the assets that haven't yet failed.
If your CMMS has been running for six months or more, your deferred maintenance backlog is visible in the data. You need to look in three places.
First, overdue PM tasks. Pull a report of all PM work orders with a due date in the past that are not closed. Sort by asset and by age of overdue task. Any PM task that is more than one cycle overdue on a critical asset is deferred maintenance. Any PM task that has been rescheduled more than twice without completion is almost certainly chronically deferred.
Second, reactive-to-planned ratio by asset. The BI Dashboard in a properly configured CMMS shows you the split between planned and reactive work orders per asset. An asset with a reactive ratio above 60% — meaning more than 6 in 10 work orders on that asset are reactive, not planned — is an asset where deferred maintenance has already reached Stage 2 of the spiral. It's telling you it needs attention through the frequency of its failures, not through the PM calendar.
Third, MTBF trend decline. Pull MTBF trend data for your highest-criticality assets over the past 12 months. Any asset whose MTBF is declining quarter-over-quarter while PM compliance is also declining is a near-certain candidate for Stage 3 crisis failure within the next 90 days. The trend line is the warning. The CMMS data has been generating it for months. The question is whether anyone is looking at it.
Breaking the deferred maintenance spiral requires both clearing the existing backlog and changing the conditions that created it. These eight actions address both dimensions.

Cryotos CMMS gives maintenance teams the visibility and the operational tools to catch deferred maintenance before it reaches the spiral stage — and to manage the backlog systematically when it already exists.
Key capabilities for deferred maintenance prevention and backlog management:
Maintenance teams using Cryotos consistently report that the shift from reactive-dominant to planned-dominant maintenance happens within 6–12 months of implementing the PM compliance tracking and escalation alert features. If your deferred maintenance backlog is invisible in your current system, Cryotos CMMS gives your team the visibility to find it and the tools to clear it before it finds you.
Deferred maintenance is maintenance work that is due, known to be due, and postponed rather than completed on schedule. It's a problem because it allows asset wear to accumulate beyond the point where it can be addressed through planned maintenance, pushing the asset toward reactive failure at a cost that is typically 3–5 times higher than the original planned task. When deferred maintenance affects multiple assets simultaneously, it generates the reactive work volume that crowds out the preventive work that would have prevented the crisis.
The generally accepted multiplier is 3–5 times the planned maintenance cost when deferred maintenance reaches the reactive failure stage. The premium comes from three sources: consequential damage to components surrounding the failed item; emergency premiums on parts and labour; and production or service impact from an unplanned asset outage. The exact multiplier varies by asset type and failure mode, but the mechanism is consistent — planned maintenance prevents the consequential costs that reactive repair cannot avoid.
Look in three places: overdue PM work orders sorted by age and asset criticality; reactive-to-planned maintenance ratio per asset over the past 90 days; and MTBF trend data for high-criticality assets. Any PM task more than one cycle overdue on a critical asset is deferred maintenance. Any asset with a reactive ratio above 60% is in the deferred maintenance spiral. Any asset with a declining MTBF trend and falling PM compliance is within 90 days of a crisis failure if the pattern continues.
Treat the backlog as a project rather than folding it into the normal PM schedule. Allocate dedicated technician time — separate from the reactive demand that created the backlog — and set a target clearance date for high-criticality assets. Triage by asset criticality first: clear the assets where a failure would be most operationally or financially damaging. Run the backlog clearance programme for 90 days and measure PM completion rate at the start and end. The goal isn't to clear every overdue task simultaneously — it's to stop the backlog from growing while systematically reducing the highest-risk items.
A CMMS prevents compounding through three mechanisms: automated alerts when PM tasks become overdue; work order prioritisation that weights PM tasks by asset criticality so they compete visibly with reactive demand rather than being silently displaced; and trend monitoring that shows MTBF decline and reactive ratio deterioration as early warning signals before they convert into crisis failures. Without these mechanisms, deferred maintenance stays invisible until it becomes expensive.
Deferred maintenance doesn't announce itself as a crisis when it starts. It announces itself as a single postponed task, a reasonable operational decision in a week when everything else is more urgent. The problem is that the same decision gets made the following week, and the week after that, until the accumulated deferral across a fleet of assets produces the simultaneous failure crisis that is suddenly everyone's emergency.
The spiral is preventable. The decision point window for every asset is visible in your CMMS data — in the overdue PM list, in the reactive ratio trend, in the MTBF decline. What most maintenance teams lack isn't the data. It's the system that makes that data impossible to ignore when the reactive queue is full and the next PM task looks like it can wait until tomorrow.
Tomorrow is where maintenance backlog lives. If your PM completion rate is below 85% and your reactive ratio is climbing, your deferred maintenance backlog is already compounding. Book a free Cryotos demo to see how the PM compliance dashboard, overdue task alerting, and MTBF trend monitoring work together to make deferred maintenance visible, manageable, and preventable before it reaches the crisis stage.


Cryotos AI predicts failures, automates work orders, and simplifies maintenance—before problems slow you down.


