

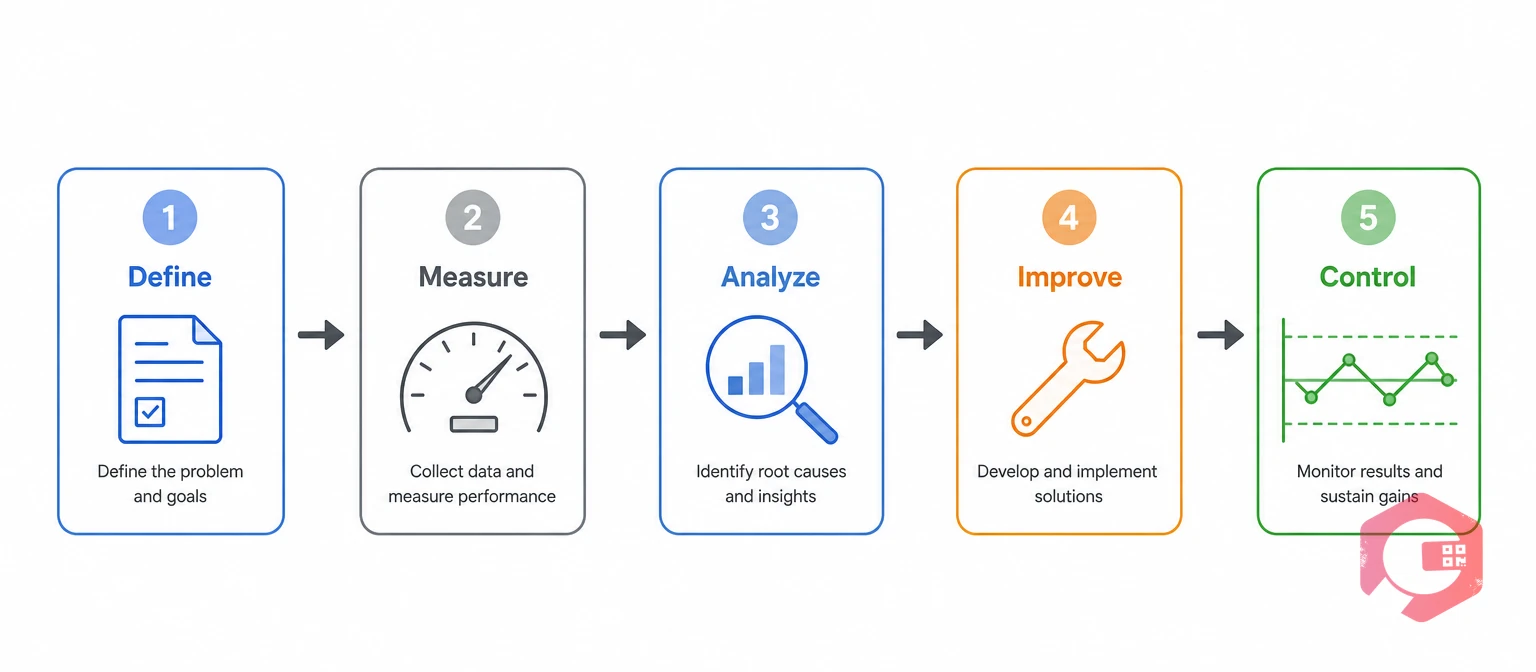
A DMAIC project is a five-phase effort that uses data to find and fix the root cause of one process problem. To run a DMAIC project in maintenance, you export work order, downtime, and failure data from your Computerized Maintenance Management System and let that data drive each phase, from baseline to control.
This guide walks through all five phases: Define, Measure, Analyze, Improve, and Control. You'll see the exact CMMS fields to pull, a worked packaging line example with real formulas, and the mistakes that stall a DMAIC project before it delivers results.
Key Takeaways
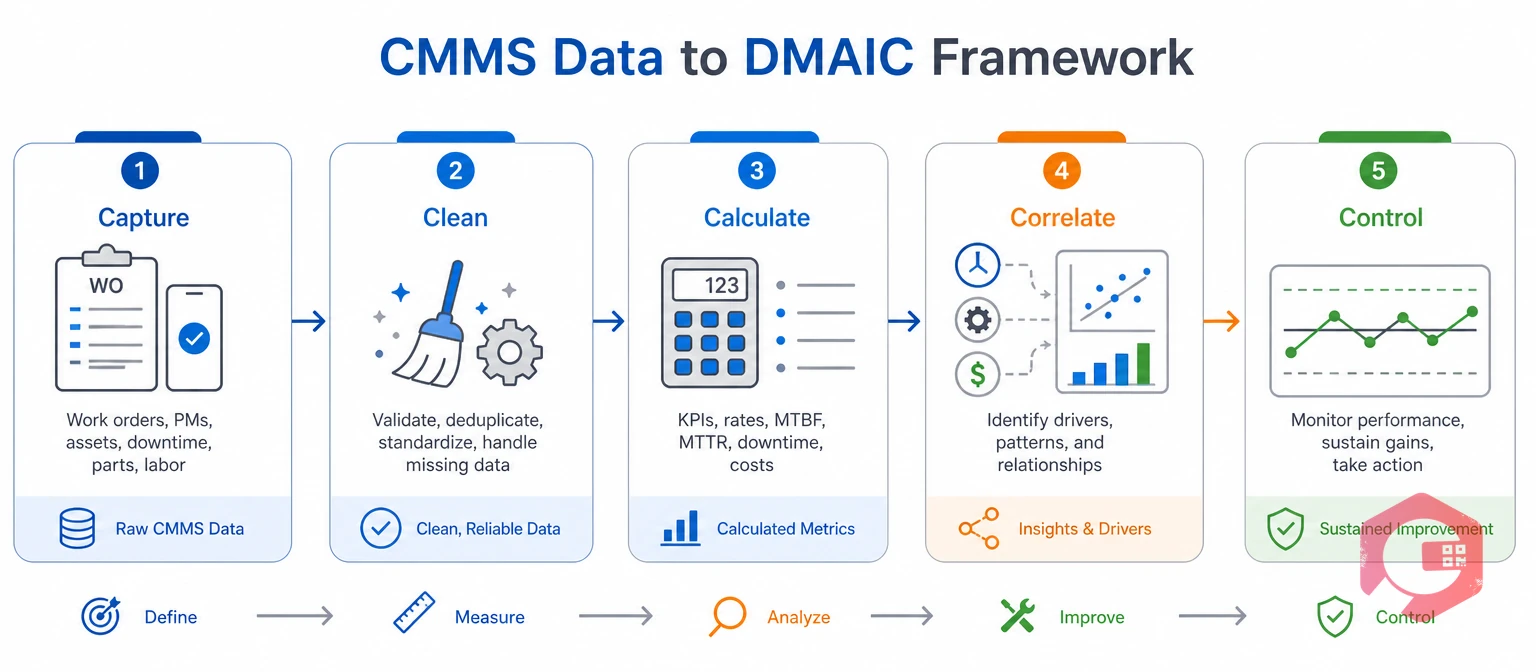
A DMAIC project needs four inputs from your CMMS: complete work order history, reliable timestamps, consistent failure codes, and asset-level downtime records. Without them, the Measure phase turns into weeks of manual data cleanup.
The DMAIC model is written up in ISO 13053-1, the international standard for the Six Sigma DMAIC methodology. Groups such as SMRP publish maintenance metric definitions that keep your calculations consistent, and methods like FMEA use the same failure records.
Mean time between failures (MTBF) is the average operating time between failures of a repairable asset. It is the first number most maintenance teams baseline.
The CMMS Data-to-DMAIC Framework:
The table shows which CMMS records feed each phase of a DMAIC project.
| Phase | CMMS data to pull | Tool or calculation | Output |
|---|---|---|---|
| Define | Downtime hours and stoppage counts by asset for the last 6 to 12 months | Ranked asset list, SIPOC diagram | Signed project charter |
| Measure | Work orders with start time, end time, asset, type, and failure code | MTBF, MTTR, DPMO, sigma level | Baseline report |
| Analyze | Failure codes, PM completion, parts used, shift | Pareto chart, 5 Whys, fishbone, hypothesis tests | Confirmed root causes |
| Improve | PM tasks, checklists, spare part levels, pilot work orders | Pilot vs. baseline comparison | Approved, tested fix |
| Control | Weekly stoppage counts and downtime by asset | Control chart, dashboard alerts | Control plan and updated SOPs |
Cryotos captures these fields on every job through work order management, so the data for a DMAIC project builds up as your team closes jobs. A project that starts with clean records spends its time on analysis instead of hunting for data.
To define a DMAIC project, write one problem statement that names an asset, a metric, a time period, and a target. A vague goal such as "improve reliability" gives the team nothing to measure.
Filter closed work orders by breakdown type for the last six to twelve months, then rank assets by downtime hours. The asset at the top of the list is usually the right first project because the payoff is largest.
Ask the production supervisor which stoppages hurt most. Their view of the customer impact, such as missed batches or overtime, decides which failures the project treats as defects.
A SIPOC diagram lists Suppliers, Inputs, Process, Outputs, and Customers on one page. For a breakdown, it shows who reports the fault, how the work order moves, and who depends on the repaired asset.
A charter fits on one page. In the worked example used in this guide, the team picks Packaging Line 2 and writes: "In the last six months, Packaging Line 2 had 42 unplanned stoppages totaling 118 hours. Reduce stoppages by 50% within six months."
Most maintenance teams get stuck here because they pick a whole plant instead of one line. A tight problem statement saves a DMAIC project weeks of rework.
Not sure what a stoppage costs? Try the unplanned downtime calculator to size the problem before you write the charter.
Measure the baseline by exporting six to twelve months of work orders, checking the data, and calculating downtime hours, MTBF, MTTR, DPMO, and sigma level. The baseline is the number every later improvement gets compared against.
Measurement System Analysis in Six Sigma asks whether your data can be trusted. For CMMS data, that comes down to five checks:
Teams that skip these checks often build a polished chart on data that is wrong.
Defects per million opportunities (DPMO) is the number of defects you would expect in one million chances for a defect to occur. Sigma level is a score of process capability that converts the DPMO into standard deviations from target.
In the example, Packaging Line 2 runs three 8-hour shifts a day for 180 days. That gives 540 shifts and 4,320 scheduled hours. Each shift is one opportunity, and a shift with an unplanned stoppage counts as one defect. The figures below are illustrative, so swap in your own export.
| Metric | How to calculate | Example result | Where it comes from in the CMMS |
|---|---|---|---|
| Unplanned stoppages | Count breakdown work orders | 42 | Work orders |
| Downtime hours | Add up stop durations | 118 hours | Downtime records |
| Availability | (4,320 - 118) / 4,320 | 97.3% | Scheduled hours and downtime |
| MTBF | 4,202 uptime hours / 42 stoppages | 100 hours | Uptime and failure count |
| MTTR | 118 downtime hours / 42 repairs | 2.8 hours | Work order start and end times |
| DPMO | 42 / 540 x 1,000,000 | 77,778 | Stoppage count and shift count |
| Sigma level | Convert DPMO with a standard table | About 2.9 | Calculated from DPMO |
At 2.9 sigma, roughly 7.8% of shifts lose time to an unplanned stoppage. Standard Six Sigma tables include a 1.5 sigma shift by convention, so state that assumption in your report.
Verify your own figures with the MTBF calculator, and pull stop durations from downtime tracking, so hours come from live records instead of memory. A baseline you can reproduce is a baseline the plant manager will accept.
Analyze by ranking failure codes with a Pareto chart, then asking why the top codes keep happening. The goal is a confirmed root cause, not a longer list of symptoms.
A Pareto chart sorts causes from largest to smallest so the vital few stand out. Here is the Line 2 data by failure code.
| Failure code | Stoppages | Downtime (hours) | % of stoppages | Cumulative % |
|---|---|---|---|---|
| Seal and heater failure | 14 | 41 | 33.3% | 33.3% |
| Sensor misalignment | 9 | 22 | 21.4% | 54.8% |
| Film jam | 7 | 12 | 16.7% | 71.4% |
| Conveyor belt fault | 5 | 19 | 11.9% | 83.3% |
| Motor or drive fault | 4 | 15 | 9.5% | 92.9% |
| Other | 3 | 9 | 7.1% | 100.0% |
The top two codes cause 55% of stoppages and 53% of downtime hours. That is where this DMAIC project should spend its effort.
Take the top code and ask why until you reach something you can change. The 5 Whys technique works well alongside the notes technicians leave on closed work orders.
A fishbone diagram groups possible causes under six headings, and each one maps to CMMS data you already hold.
Data can confirm what the team suspects. Simple tests are enough for most maintenance projects:
Most maintenance teams find the root cause sits in the PM plan, not the repair itself. A confirmed cause gives the Improve phase something specific to fix.
Improve by choosing one fix for each confirmed root cause, testing it on one asset, and comparing the results with your baseline. Skipping the pilot is the fastest way to lose the team's trust.
In the Line 2 example, the fix is a heater calibration task plus a seal inspection. The team adds both through its preventive maintenance software and attaches a checklist to the work order.
Run the fix on Line 2 for six to eight weeks and record every stoppage as a work order. In a regulated plant, send the change through change control and QA review first.
Name one owner for the pilot and hold a short weekly review. That person checks that the new tasks are being completed and that every stoppage is coded at closure.
Suppose the pilot meets the target and Line 2 logs 21 stoppages over the next six months instead of 42. DPMO falls from 77,778 to 38,889, and the sigma level rises from 2.9 to about 3.3. With 60 downtime hours, MTBF climbs from 100 hours to about 203 hours, and availability rises from 97.3% to 98.6%. A pilot turns a promising idea into evidence, and evidence gets the fix approved for every similar line.
Control keeps a DMAIC project's gains by tracking the key metric on a control chart, alerting owners when it drifts, and updating PM templates and procedures. Most improvement projects that fade do so because this phase was skipped.
A control chart plots a metric over time with limits that show normal variation. For stoppage counts, a c-chart works well. At the baseline average of about 1.6 stoppages per week, the upper control limit is about 5.4, so any week with six or more stoppages is a signal to investigate.
After the fix, recalculate the limits from the new data. At about 0.8 stoppages per week, the upper limit drops to about 3.5. The NIST Engineering Statistics Handbook explains how to set control limits for different chart types.
Maintenance teams using Cryotos have reported up to 30% reduction in unplanned downtime and 25% faster repair turnaround. A control plan is what makes gains like these last.
Close the project formally by handing the chart to the process owner, recording the final numbers against the baseline, and logging what the team learned. Control is complete when someone outside the project team owns the chart.

The most common reason a DMAIC project stalls is weak data, followed by a vague scope and no plan to control the result.
Each of these mistakes can be prevented with a short checklist and a named owner.
Use this DMAIC project checklist to confirm each phase is complete before you move to the next one.
If any item is missing, stay in that phase until it is done.
A DMAIC project is a structured way to fix one specific process problem. The team defines the problem, measures it, finds the cause, tests a fix, and then controls the result. In maintenance, work order data supplies the numbers for every step.
Most maintenance projects run three to six months. Define and Measure usually take about five weeks, Analyze about three, and Improve four to eight weeks including the pilot. Control continues after the project closes.
You need six to twelve months of work orders with the asset, work type, start and end times, and failure code. PM completion records and downtime hours per asset help too. If failure codes are missing, sample the technician notes for your top assets.
No. A Green Belt or Black Belt helps with the statistics, but a maintenance lead with a clear charter, clean data, and basic tools such as Pareto charts and the 5 Whys can run a successful project. Ask a certified colleague to review the Analyze phase.
Count your defects and opportunities, then divide defects by opportunities and multiply by one million to get DPMO. Convert that DPMO to a sigma level with a standard table. For example, 77,778 DPMO is about 2.9 sigma.
DMAIC improves an existing process, while DMADV (Define, Measure, Analyze, Design, Verify) designs a new process or product from scratch. Use DMAIC when the asset already runs and you have work order history to analyze.
Yes. A team of three or four people can run one on a single asset. Keep the scope small, use spreadsheet exports for the analysis, and aim for one measurable win before you take on a second project.
A DMAIC project works well when every stoppage, repair, and PM is recorded once and recorded properly. Schedule a free demo to see how Cryotos gives your team the work order, downtime, and reporting data to run each phase with confidence.



Cryotos AI predicts failures, automates work orders, and simplifies maintenance—before problems slow you down.



