

Shift-based MTBF measures how long a machine runs between breakdowns using only the hours it was scheduled to operate, shift by shift. Instead of spreading uptime across all 24 hours of every day, it uses the real shift calendar for each location: working days, number of shifts, and each shift's start and end time. Paired with shift-wise MTTR, it shows which shift loses the most time to breakdowns, how fast each shift gets a machine running again, and where reliability actually breaks down.
Most plants don't run around the clock, yet many still report MTBF as if they do. That hides weak spots and makes machines look more reliable than they are. This guide explains how machines are assessed by shift, how to calculate the metrics, the insights the data reveals, and how a Computerized Maintenance Management System (CMMS) handles the calculations for you.
Key Takeaways
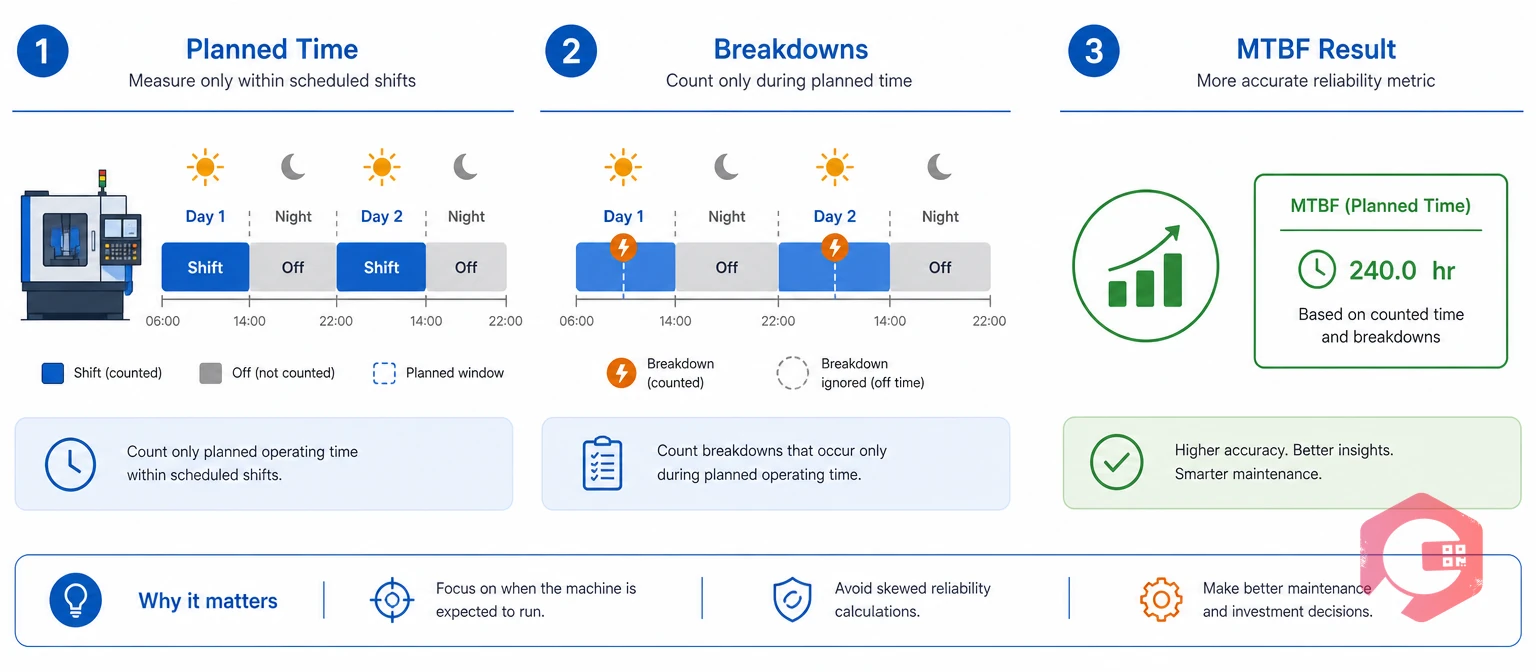
Shift-based MTBF is the average operating time between breakdowns, counted only within scheduled shift hours. It follows the same logic as standard mean time between failures, but it replaces calendar time with planned operating time.
Planned operating time is the total shift hours a machine is scheduled to run in a period. A location running two 8-hour shifts, Monday to Saturday, has 16 hours of planned operating time per working day and none on Sunday.
Shift-wise MTTR is the average repair time for breakdowns that started in a given shift. Together with shift-based MTBF and downtime by shift, it answers three different questions:
Reliability programs built on SMRP best-practice metrics and Total Productive Maintenance (TPM) both tie equipment performance to the time a machine is expected to run. ISO 55000 takes the same line, judging an asset by the value it delivers during its planned use. Measuring reliability by shift puts that principle into daily practice.
Calendar-based MTBF inflates reliability for any plant that doesn't run 24×7. It counts nights, Sundays, and holidays as hours of "running without failure," even when the machine was switched off.
Take a machine at a two-shift plant that runs Monday to Saturday. In a 31-day month, it has 744 calendar hours but only 432 planned operating hours. With 4 breakdowns and 10 hours of downtime, the two methods give very different answers:
The calendar figure looks 74% better, but the machine didn't get more reliable. The plant simply counted hours when nobody was using it. That gap causes real problems: PM intervals get set too long, spares get stocked too thin, and management sees a healthy trend while operators fight the same unplanned maintenance every week.
Most maintenance teams only notice the problem when they compare MTBF with production loss reports and the numbers don't match. Shift-based MTBF removes that distortion by measuring reliability only when the machine is meant to be working.
Machines are assessed by shift when every breakdown is tagged with the shift it happened in, and every shift has a defined operating window. That needs two sets of data: a shift calendar for each location and accurate breakdown timestamps.
The calendar is set once per location, and every machine under that location follows it. A utility compressor that runs 24×7 at a two-shift plant should be marked separately, so its planned operating time isn't understated.
Accurate stop and restore times matter most. Downtime tracking that captures them on the shop floor, from a mobile app or a QR scan, removes the guesswork of filling in times at the end of the day.
Want to test your own numbers first? Try the free Cryotos MTBF calculator with your planned operating hours instead of calendar hours.
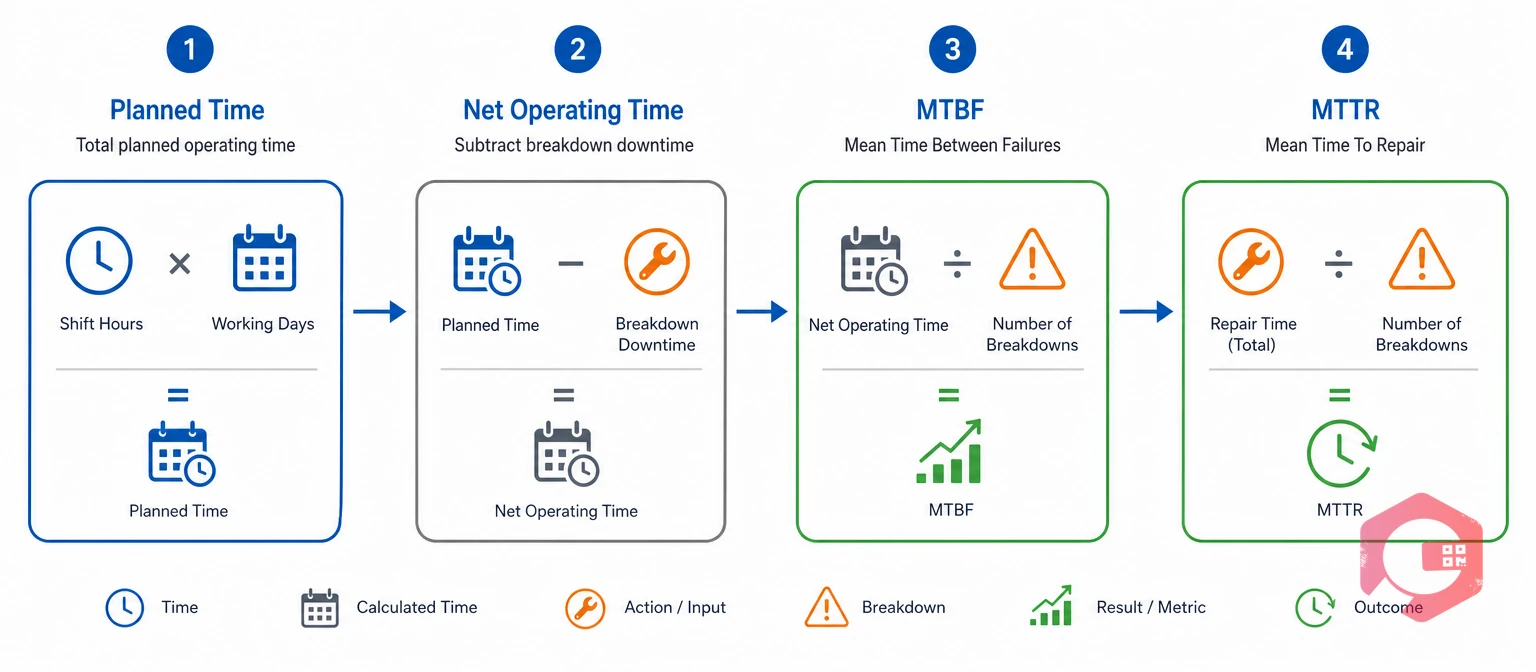
Shift-based MTBF and MTTR use simple formulas. The only change from the standard method is where the operating time comes from.
The repair side follows the usual method, so you can cross-check any shift's figure with the MTTR calculator.
A plant runs Shift A from 06:00 to 14:00 and Shift B from 14:00 to 22:00, Monday to Saturday. October 2026 has 27 working days, so each shift has 216 hours of planned operating time. One machine had four breakdowns in the month.
| Metric | Shift A | Shift B | Machine Total |
|---|---|---|---|
| Planned operating time | 216 h | 216 h | 432 h |
| Breakdowns | 3 | 1 | 4 |
| Breakdown downtime | 7 h | 3 h | 10 h |
| MTTR | 2.3 h | 3.0 h | 2.5 h |
| Shift-based MTBF | 69.7 h | 213.0 h | 105.5 h |
The machine-level MTBF of 105.5 hours looks acceptable. The shift view tells a different story: Shift A fails three times as often as Shift B, while Shift B takes longer to repair. A single monthly number hides both patterns.
Count the failure in the shift where it started, and give that shift the full repair time for MTTR. For MTBF, split the downtime by the hours that fall inside each shift.
An overnight shift belongs to the day it starts. A breakdown at 02:00 on Tuesday during a 22:00 to 06:00 shift counts as Monday's night shift. Breakdowns on non-working days or in gaps between shifts should be tagged as "outside shift hours," so they stay visible without distorting any shift's figures.
With these three rules, every breakdown lands in exactly one shift, and the numbers add up the same way every month.
Shift-based MTBF and calendar-based MTBF use the same failure count but different time bases. The table shows where each one fits.
| Factor | Calendar-Based MTBF | Shift-Based MTBF |
|---|---|---|
| Time base | All 24 hours of every day | Scheduled shift hours on working days |
| Best fit | Continuous 24×7 operations | Plants running one, two, or three shifts |
| Accuracy for shift plants | Overstates reliability | Matches real operating exposure |
| Shift-level insight | None | Failures, repair time, and downtime per shift |
| Effect on PM intervals | Intervals often set too long | Intervals based on real running hours |
| Setup needed | None | A shift calendar for each location |
For a true 24×7 plant, both methods give the same answer. For every other plant, the shift basis is the one that matches what operators and production reports actually see.
Shift-wise data turns MTBF and MTTR from a monthly score into a list of clear actions. These are the insights maintenance teams most often find once every breakdown carries a shift tag.
One shift often logs far more failures than the others on the same machines. The cause is usually operating practice, loading, or changeover habits, not the machine itself.
Night shifts often show a higher MTTR because fewer technicians, supervisors, and stores staff are on site, a familiar challenge of shift work. A long night-shift MTTR usually points to access to spares or skills, not a lack of effort.
Breakdowns in the first hour of a shift often trace back to information lost at handover. A short, structured handover log with open faults and machine condition closes that gap.
Machines that sit idle over a Sunday or holiday often fail in the first shift back. That pattern makes a strong case for a pre-start checklist on the first shift after a break.
Downtime by shift turns reliability into lost production hours. It's the number production managers care about most, and it makes maintenance priorities easy to explain.
Gaps between shifts and non-working days are natural slots for planned work. Moving PMs into those windows protects production hours without skipping maintenance.
A shift with repeated minor stops may need more operator training on daily cleaning, lubrication, and inspection checks. Shift data shows exactly which crew to start with.
Each insight points to a specific owner and a specific action, which is what makes shift-level data worth collecting.
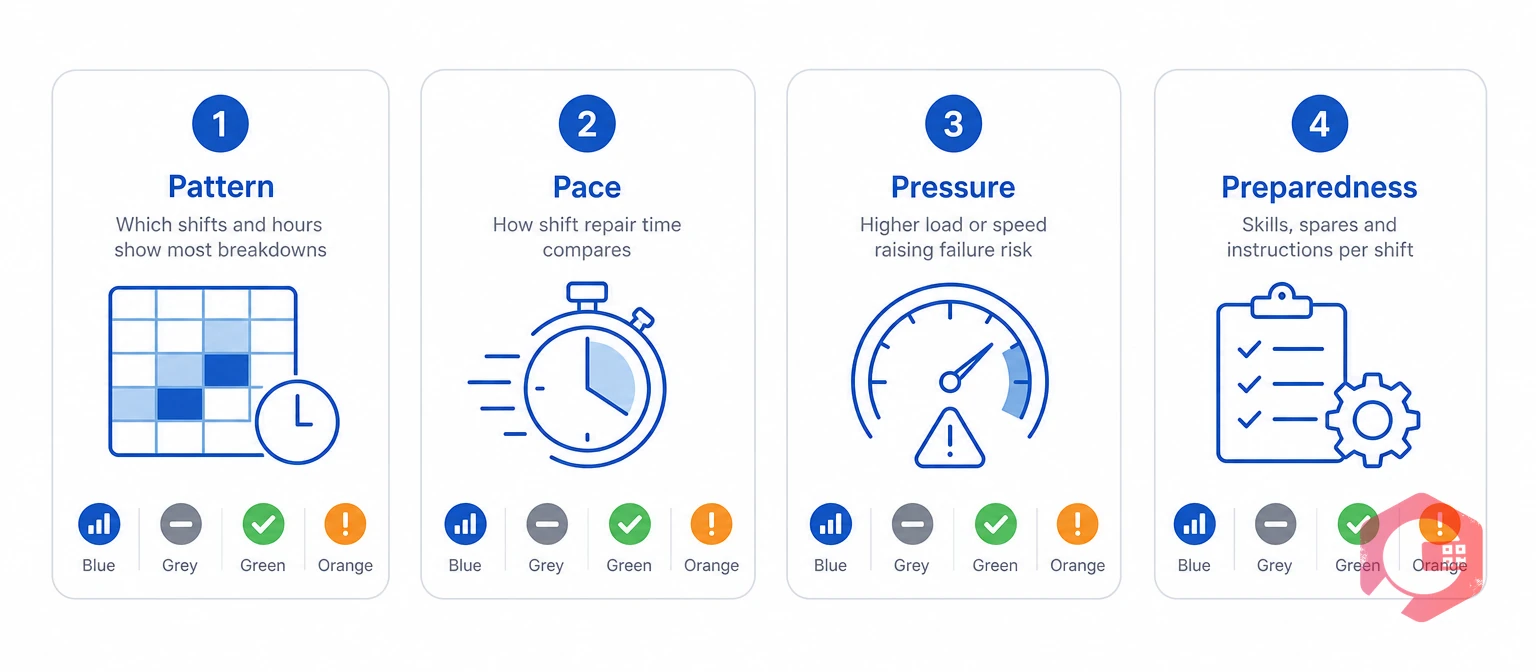
A monthly shift reliability review works best with a fixed structure. Maintenance teams that look through the same four lenses every month spot trends faster and spend less time arguing about the data.
The Shift Reliability 4P Framework:
Run the review with production and maintenance in the same room. Agree on one action per lens, assign an owner, and check the result the next month. A maintenance KPI dashboard with a shift filter keeps everyone looking at the same live numbers.
Over a quarter, the gap in shift-based MTBF between the best and worst shift should start to close.
The most common mistake is tagging a breakdown by the time the work order was raised instead of the time the machine stopped. A delay of even 30 minutes can push a failure into the wrong shift.
Each of these is a data or process gap, not a people problem. Fixing them makes shift-based MTBF a number that both maintenance and production trust.
Cryotos connects shift calendars, breakdown work orders, and reliability metrics, so shift-based figures come from system data instead of spreadsheets. Each location gets its own shift configuration, and every machine under it follows that calendar.
Maintenance teams using Cryotos have reported up to 30% reduction in unplanned downtime and 25% faster repair turnaround. Shift-level visibility shows exactly where that improvement should start.
Because shift data sits on the same record as asset history, spares, and checklists, asset maintenance management software becomes the single place to see how each machine performs on every shift.
Regular MTBF usually divides uptime by calendar hours, including nights and weekends when a machine may be switched off. Shift-based MTBF divides uptime by planned shift hours only. For plants that don't run 24×7, the shift basis gives a lower but more accurate figure.
Group breakdowns by the shift in which the machine stopped. Add up the repair time for each group and divide by the number of breakdowns in that shift. The result shows how fast each shift restores machines.
The breakdown belongs to the shift where it started, and that shift gets the full repair time for MTTR. For MTBF, the downtime is split by the hours that fall in each shift, so each shift's operating time stays accurate.
No. MTBF and MTTR measure failures, so only breakdown work orders should count. Including preventive or planned jobs makes machines look like they fail more often and dilutes repair-time figures.
Yes. A CMMS with location shift calendars can tag every breakdown with its shift and calculate MTBF from planned operating time. It then reports MTTR, MTBF, and downtime by shift without manual spreadsheets.
Shift-level reliability data shows where breakdowns start and how fast each shift recovers. Schedule a free demo to see how Cryotos calculates shift-based MTBF and MTTR from your own shift calendars and breakdown records.



Cryotos AI predicts failures, automates work orders, and simplifies maintenance—before problems slow you down.



