

Failure code analytics is the review of failure codes recorded on completed work orders to show where downtime, cost, and repeat breakdowns concentrate. For a maintenance in-charge, it replaces gut feel with a ranked list of what stops the plant.
Every closed work order already holds a clue about what failed and why. When those clues are coded the same way each time, patterns appear within weeks. This guide explains how failure codes connect to issue types, which numbers to track, and how to run a short weekly review that turns codes into decisions.
Key Takeaways

Failure code analytics is the review of work order failure codes to find where downtime, cost, and repeat faults concentrate. It turns closed jobs into a ranked list of problems worth fixing.
A failure code is a short label that records what went wrong on a completed job. Bearing wear, belt slippage, sensor fault, and operator error are typical examples.
A useful failure code has three traits:
Standards such as ISO 14224 and methods such as FMEA and RCM all depend on the same habit: name failures the same way every time so they can be counted. Most maintenance teams that skip this step end up with free-text notes that nobody can total. A Computerized Maintenance Management System stores the code on each work order, so the counts build themselves as jobs close.
A failure code and an issue type describe the same event from two points in time. The issue type records the symptom at reporting, and the failure code records the confirmed cause at closure.
An issue type is the symptom category a requester selects when reporting a problem. It helps route and prioritize the request before anyone has opened the machine.
| Point | Issue type | Failure code |
|---|---|---|
| Recorded by | Requester or operator | Technician who did the repair |
| Recorded when | At work request or work order creation | At work order closure |
| What it describes | The symptom someone saw | The confirmed cause of the failure |
| Example | Machine making a grinding noise | Bearing wear |
| Best used for | Routing and priority of new requests | Analytics, PM changes, and spare parts |
In Cryotos, failure types and failure codes are tied to issue types and issue codes, so the symptom and the confirmed cause stay linked on one work order management record. Over time, that link shows which reported symptoms usually turn out to have which causes. The issue type tells you what people notice, and the failure code tells you what to fix.
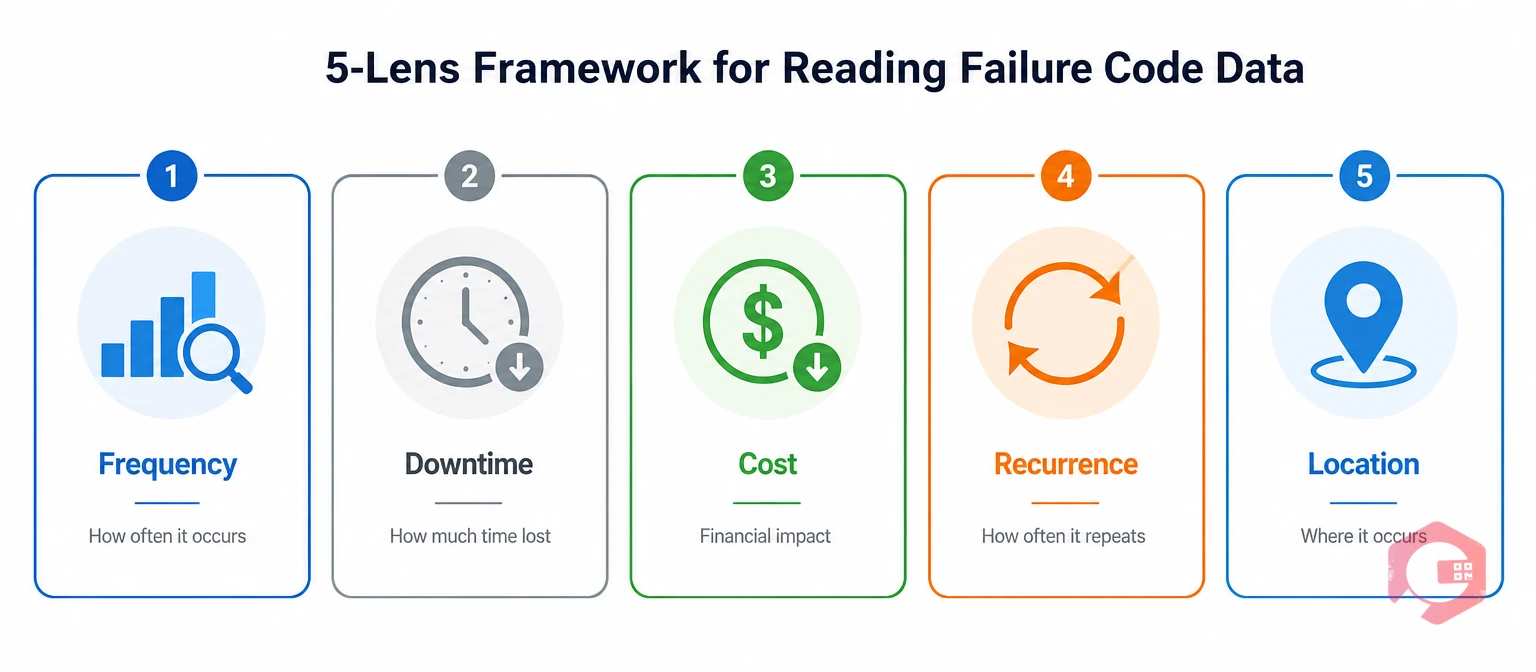
A maintenance in-charge should read failure code data through five lenses: frequency, downtime, cost, recurrence, and location. A code that looks minor on one lens can rank first on another.
The Five-Lens Failure Code Review Framework:
Recurrence ties directly to reliability, because dividing operating time by the number of failures gives mean time between failures, and the MTBF calculator does that arithmetic for any asset. Ranking by a single lens hides risk, so review at least frequency, downtime, and recurrence together.
See how long each failure code takes to fix with the MTTR calculator, then compare the result against the downtime hours in your own data.
A failure code analytics worksheet lists each code with its issue type, event count, downtime hours, repeat count, and first action. The sample below covers 30 days on one production line, and the numbers are illustrative, so replace them with your own closed work orders.
| Failure code | Linked issue type | Events (30 days) | Downtime (hrs) | Repeats within 30 days | First action |
|---|---|---|---|---|---|
| Bearing wear | Grinding noise or vibration | 14 | 38 | 6 | Add lubrication task and vibration check to the PM |
| Motor overload trip | Electrical trip | 5 | 14 | 1 | Check load and cable condition |
| Belt slippage | Drive running below speed | 9 | 11 | 2 | Add belt tension check to the weekly PM |
| Sensor fault | Line stops without warning | 7 | 9 | 4 | Review calibration and stock spare sensors |
| Seal leak | Fluid leakage | 8 | 6 | 3 | Review seal specification and add to inspection route |
| Operator error | Wrong setting or misuse | 6 | 4 | 2 | Run refresher training and update the setup SOP |
Read the sample from the top. Bearing wear caused 38 of the 82 downtime hours, about 46%, and the top three codes together caused 63 hours, about 77%.
A short register like this fits on one screen, which is why an in-charge can review it in minutes.
Reading failure code trends means comparing each code's count and downtime across weeks or months to see whether it is rising, falling, or flat. A single week is noise, but three or four weeks show direction.
A small but rising code is cheaper to stop early than a large one that has already settled in.
Failure code analytics answers six practical questions that a maintenance in-charge faces every week. Each one maps to a lens in the framework.
A repeat failure is the same failure code returning on the same asset within a set window. Most teams use 30 days as the window, then tighten it for critical assets.
These answers separate unplanned maintenance caused by genuine faults from work caused by gaps in the plan.
The main benefit of failure code analytics is that a maintenance in-charge can set priorities with data instead of opinion. Every decision below traces back to a code count, a downtime total, or a repeat rate.
Cryotos downtime tracking records stops by asset, so each failure code carries real hours. Maintenance teams using Cryotos have reported up to 30% reduction in unplanned downtime and 25% faster repair turnaround.
Better data does not fix a machine, but it tells the team which machine to fix first.
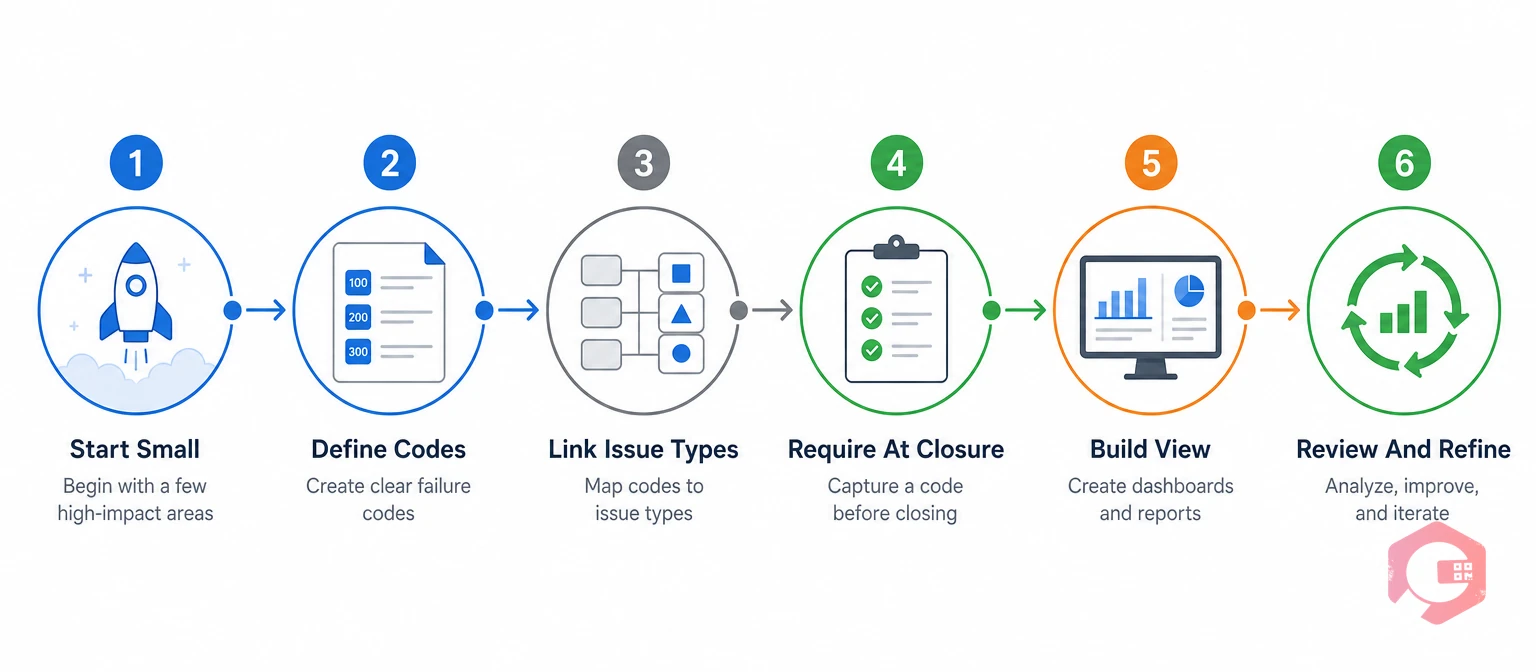
To set up failure code analytics, build a short code list, link each code to an issue type, require a code at work order closure, and review the results every week. Most facilities get better results by starting with their ten costliest assets than by coding the whole plant at once.
Once codes flow in, a BI dashboard can show downtime, repeat rate, and repair time by code without a manual spreadsheet.
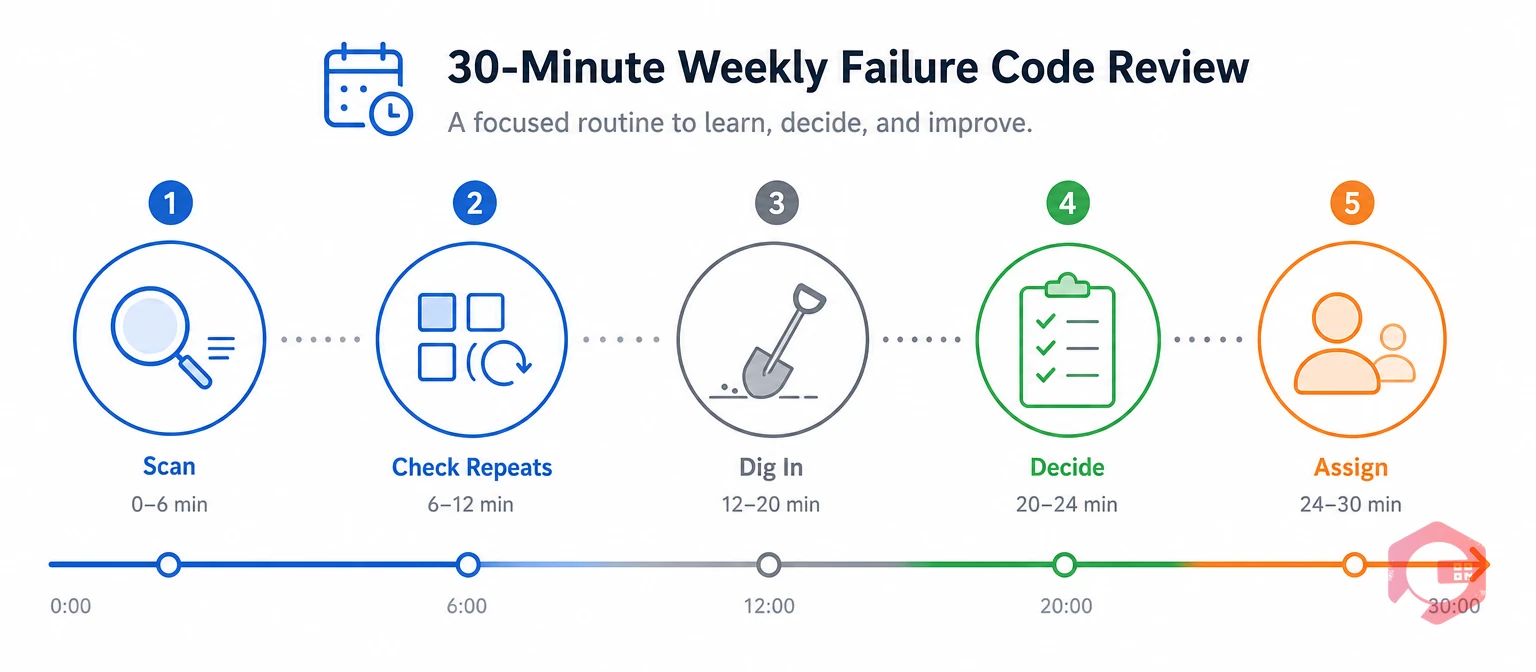
A 30-minute weekly review is enough for most maintenance in-charges to turn failure code data into action. Keep the meeting short, and end it with owners and dates.
Track the count for the same code over the next four weeks. If it drops, the fix worked. If it does not, the real cause is still hiding.
The most common mistake is a long, vague code list, because technicians then pick whatever is closest and the counts lose meaning.
Fix these six and the data becomes reliable enough to defend in a management review.
It means counting and ranking the reasons machines fail, using the code a technician selects on each closed work order. It shows which failures cost the most downtime, which ones repeat, and where to act first.
An issue type is the symptom a requester reports, such as noise or leakage. A failure code is the confirmed cause the technician records after the repair, such as bearing wear. Linking the two shows which symptoms lead to which causes.
Many teams start with 15 to 30 clearly defined codes grouped under a few failure types. A short list keeps technicians consistent. You can add a code later when a real pattern needs its own label.
A short weekly review works for most plants, with a deeper monthly review of trends and repeat failures. Weekly reviews catch a bad week early, and monthly reviews show whether the fixes held.
The analysis stops being useful, because the largest bar on the chart hides the real causes. Require a note whenever someone selects Other, review those notes monthly, and add a proper code when the same cause appears more than a few times.
Clear failure codes turn every closed job into a decision. Schedule a free demo to see how Cryotos links issue types, failure codes, and downtime so your team can act on the patterns.



Cryotos AI predicts failures, automates work orders, and simplifies maintenance—before problems slow you down.



