
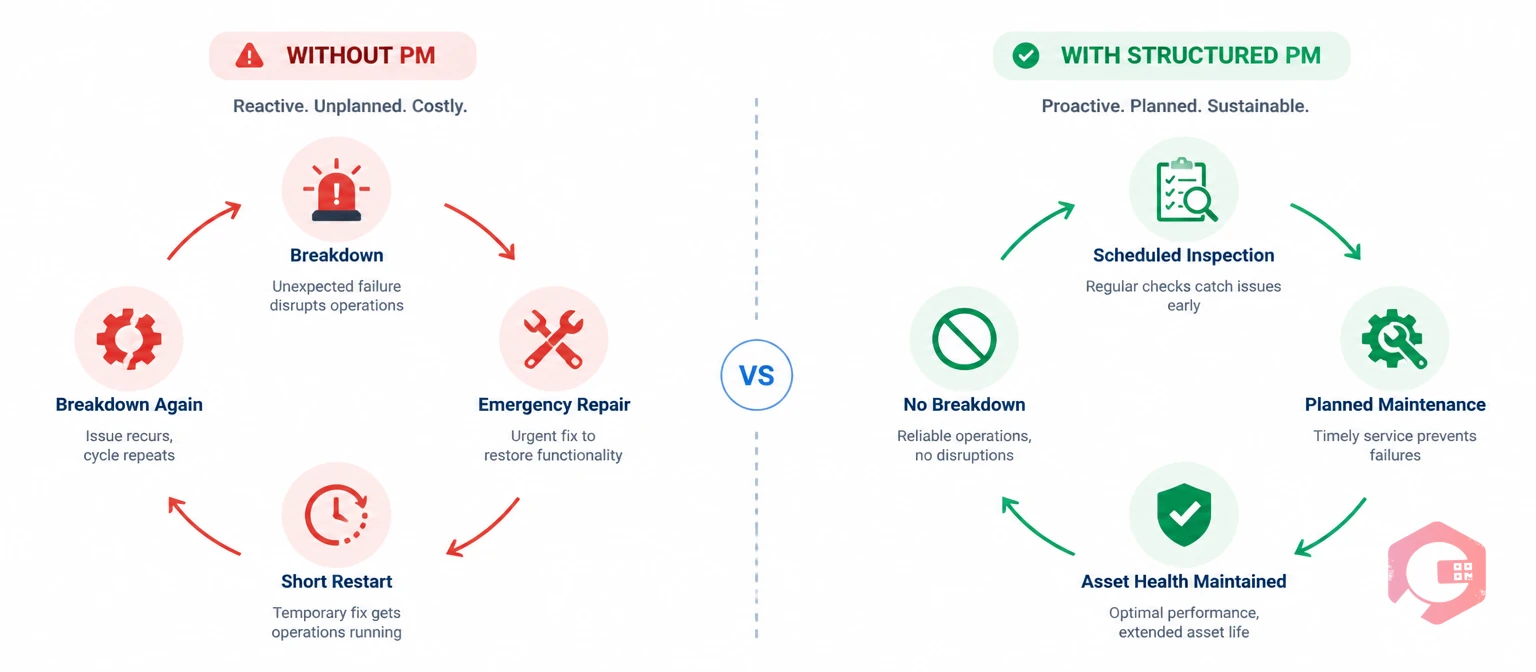
Emergency work orders spike in facilities with no structured PM programme because deferred maintenance accumulates across every asset simultaneously — and when multiple assets cross their failure threshold at the same time, the reactive work volume overwhelms the maintenance team, consumes the entire available technician capacity, and leaves no time to run the preventive work that would prevent the next round of failures.
It’s a loop that every maintenance manager who has inherited a reactive-only operation knows well. The emergencies arrive faster than they can be closed. The PM tasks that might break the cycle never get scheduled because the team is permanently in firefighting mode. The asset condition continues to deteriorate. The next spike arrives sooner than the last. According to Plant Engineering’s maintenance cost benchmarking research, facilities operating without a structured PM programme spend 3–5 times more per maintenance job than comparable facilities running planned maintenance — and the emergency work order spike is the primary driver of that cost differential. This guide explains exactly why the spike happens, what the data looks like before it arrives, and how a structured PM programme stops it.
Before explaining why the absence of a PM programme causes emergency spikes, it’s worth being precise about what a structured PM programme actually is — because many facilities that experience repeated emergency spikes believe they have one when they don’t.
A structured PM programme is not a list of maintenance tasks on a spreadsheet. It’s not a paper checklist that a technician completes when time allows. It’s not a set of manufacturer service intervals that nobody has verified against actual asset performance. A structured PM programme is a scheduled, tracked, and compliance-measured set of maintenance interventions — each tied to a specific asset, executed at a frequency derived from the asset’s failure history and operational context, with completion confirmed in a system that surfaces missed tasks before they become failures.
The word “structured” carries the operational weight here. Structure means the PM tasks are in a CMMS with due dates and assigned ownership. Structure means missed tasks generate alerts that reach someone who acts on them. Structure means PM completion rates are visible at management level — not as a monthly report, but as a live dashboard. Without that structure, a PM programme is a set of intentions, and intentions don’t prevent failures. OSHA’s preventive maintenance guidelines identify documented, scheduled PM as the baseline expectation for any facility operating equipment that poses a safety or operational risk — a standard that reactive-only operations do not meet. According to Reliable Plant’s maintenance effectiveness research, facilities with documented, digitally tracked PM programmes experience 40–50% fewer emergency work orders than comparable facilities running equivalent assets without structured PM.
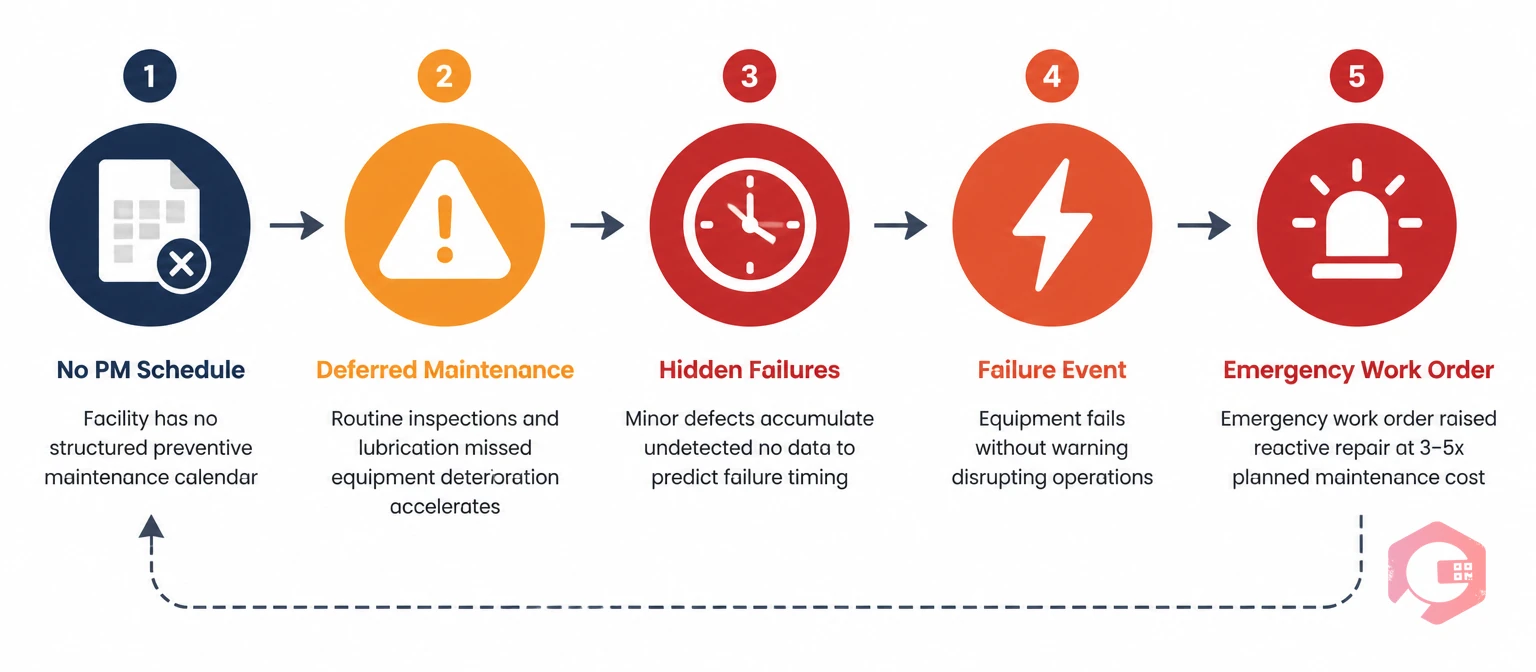
The emergency work order spike doesn’t arrive without warning. It follows a predictable sequence that plays out over weeks or months before the volume crosses the threshold that makes it visible as a crisis. Understanding the sequence is the first step to interrupting it.
Every asset in a facility has a wear curve — a rate at which its components degrade under normal operating conditions. Bearings wear. Filters clog. Belts stretch. Seals harden. In a facility with a structured PM programme, these wear items are inspected and replaced on a schedule that keeps them below the failure threshold. In a facility without one, the wear accumulates uninterrupted.
The problem isn’t that individual assets degrade — they all do. The problem is that in a reactive-only facility, every asset degrades at its own rate, simultaneously, without anyone monitoring the cumulative wear picture. The HVAC unit installed six years ago, the pump that’s been running since the building opened, the conveyor that had a belt replaced eighteen months ago — all of them are accumulating wear at different rates, toward different failure thresholds, with no planned intervention in any of them. Stage 1 is invisible until Stage 2 arrives.
Failure thresholds are not evenly distributed in time. When a facility’s asset base has been running without PM for an extended period, a disproportionate number of assets reach their failure threshold within the same window. This is not coincidence — it reflects the age profile of the asset base, common installation vintage, and the compounding effect of deferred wear. The pump that was last serviced three years ago, the AHU filter that was last changed fourteen months ago, and the compressor that has been running hot for six weeks all fail within the same month.
The maintenance team that was managing a normal volume of reactive work suddenly faces three times the emergency demand. The same technicians who were already stretched are now responding to priority failures on multiple assets simultaneously. Response times extend. Some emergencies wait. Assets that were marginal deteriorate further while the team is occupied with the primary failures. Stage 2 is the spike itself — and it’s almost always worse than the team expected because the underlying wear accumulation was invisible.
Stage 3 is what makes the spike self-perpetuating. When emergency work order volume is high, technicians spend all their available time on reactive repairs. PM tasks that should be running — and that would begin to rebuild the maintenance position — never get scheduled or get continuously deferred. The planned-to-reactive maintenance ratio collapses, and the team enters a state where the reactive demand prevents the preventive work that would reduce the reactive demand.
This is the trap. It’s not that the maintenance team doesn’t understand the value of PM — they almost universally do. It’s that the emergency queue is always full, always urgent, and always takes priority over tasks that don’t yet have a failure event attached to them. Breaking the trap requires more than intention: it requires a system that makes PM tasks visible, scheduled, and operationally weighted against reactive work in a way that protects PM completion even during high-volume reactive periods.

The cost premium on emergency reactive work relative to planned maintenance is well documented — and it compounds the operational damage of an emergency spike with direct financial damage that often exceeds the capital cost of the maintenance programme that would have prevented it.
The cost premium comes from five sources that are absent in planned maintenance. First, parts cost: emergency procurement bypasses the approved supplier process and sourcing negotiation, drawing from emergency stock at spot price or from local trade merchants at premium rates. Second, labour cost: emergency repairs often require overtime, call-out premiums, or contractor rates that apply outside normal working hours. Third, consequential damage: a bearing failure that would have cost £200 to replace if caught in a PM inspection may destroy a £2,000 motor shaft if it runs to complete failure. Fourth, temporary works: while critical equipment is being repaired on an emergency basis, temporary workarounds — hired portable equipment, bypass arrangements, manual processes — add cost that planned maintenance never incurs. Fifth, production or service impact: in FM operations, an HVAC failure in a client’s building or a lift shutdown in a multi-tenant property generates SLA breaches, tenant complaints, and potential contractual penalties.
According to McKinsey’s analysis of maintenance strategy economics, every £1 invested in structured preventive maintenance returns £3–5 in avoided emergency repair costs when measured across a full asset lifecycle. The emergency spike isn’t just an operational problem — it’s a financial one, and the financial case for structured PM is typically measurable within 12–18 months of implementation.
One of the most underused capabilities in a CMMS is its ability to predict an emergency spike before it arrives. Facilities that have been running a CMMS for 6–12 months — even reactively — have accumulated the data that shows the spike coming. The signals are in the work order history, if anyone is looking at them.
The primary signal is MTBF trend decline. When an asset’s Mean Time Between Failures starts dropping consistently over consecutive reporting periods, it’s accumulating wear faster than it’s being restored. A pump whose MTBF was 400 hours twelve months ago and is now 180 hours is heading toward an imminent failure — and if there are five assets showing the same trajectory simultaneously, the spike is visible in the data three months before it arrives.
The secondary signal is the reactive-to-planned ratio. When reactive work orders start outpacing PM completions on a per-asset or per-area basis, it indicates that the PM programme (if one exists) is already failing to contain deterioration. The BI Dashboard in Cryotos surfaces both of these signals at asset and portfolio level — allowing maintenance managers to see the accumulating risk before it converts into a simultaneous failure event. Facilities that review this data monthly can intervene with targeted PM campaigns on the highest-risk assets before the spike. Those that don’t typically see it in the emergency work order queue.
For FM companies managing portfolios of buildings, the emergency spike at a single reactive site creates a compounding effect that affects the entire portfolio. When one site generates an emergency work order surge — pulling technicians, consuming parts, and dominating the FM helpdesk — the preventive and planned work at other sites in the portfolio gets deferred. Those sites then accumulate the wear that produces their own spikes in subsequent weeks or months.
This is why FM companies that operate reactive-only across their portfolio don’t experience one spike — they experience rolling spikes, where the emergency pressure moves from site to site as the deferred wear from each previous spike’s resource drain reaches failure threshold on the next. The portfolio never returns to a stable maintenance position because the resource required to run PM at all sites simultaneously is never available when every site’s reactive demand is consuming it.
Breaking this cycle at portfolio scale requires a PM programme that is protected from reactive demand — where PM tasks at stable sites are not sacrificed to cover emergency demand at reactive ones. The preventive maintenance software in Cryotos allows FM operations managers to set PM task priorities that protect scheduled completion even during high reactive-demand periods — ensuring that the PM programme at stable sites continues to build the maintenance position that prevents those sites from becoming reactive in turn.
Cryotos CMMS is built to give maintenance teams the structure that converts a reactive-only operation into a planned one — not through a process overhaul that takes months to implement, but through a systematic approach to PM programme creation, scheduling, tracking, and optimisation that produces measurable results within the first 60–90 days of operation.
Key capabilities for PM programme implementation and emergency spike prevention:
Facilities that implement a structured PM programme through Cryotos consistently report a 30% reduction in unplanned downtime within 12 months — and the emergency work order spike that seemed like a permanent operational state typically halves within the first 90 days as the highest-risk assets receive their first planned intervention. If your maintenance operation is currently consuming all available resource on reactive repairs and leaving no capacity for prevention, Cryotos CMMS gives your team the structure to break the cycle.
The spike occurs because deferred maintenance allows wear to accumulate uninterrupted across every asset simultaneously. Without planned inspections and replacements, multiple assets cross their failure threshold at the same time — generating a surge of emergency work orders that overwhelms the maintenance team. The team then has no capacity for preventive work, which allows wear to continue accumulating on the remaining assets, producing the next spike sooner than the previous one.
Emergency reactive work orders typically cost 3–5 times more than equivalent planned maintenance jobs. The premium comes from emergency parts procurement at spot prices, overtime and call-out labour rates, consequential damage from run-to-failure events, temporary workaround costs, and the operational or SLA impact of unplanned downtime. The financial case for a structured PM programme is typically recoverable within 12–18 months of implementation when measured against the avoided emergency repair cost.
The two most reliable predictive signals are MTBF trend decline and rising reactive-to-planned ratio. When an asset’s MTBF is falling consistently across three or more consecutive reporting periods, it is accumulating wear faster than it is being restored — and is heading toward a failure event. When the reactive work order volume on a specific asset or area starts outpacing PM completion, it signals that the current maintenance programme is not containing deterioration. Both signals are visible in CMMS dashboard data 60–90 days before an emergency spike arrives.
The technician time trap is the self-perpetuating loop where high emergency work order volume prevents technicians from running PM tasks, which allows further wear accumulation, which produces more emergency work orders. The trap is operational rather than motivational — maintenance teams understand the value of PM but cannot execute it when the emergency queue is always full and always prioritised. Breaking the trap requires a CMMS system that makes PM tasks visible in the work queue, assigns them priority, and fires alerts when they are deferred — protecting PM execution even during high reactive-demand periods.
Most facilities see a measurable reduction in emergency work order volume within 60–90 days of implementing a structured PM programme, as the first round of planned inspections catches and addresses the highest-risk assets before they fail. A sustained reduction — typically 30–50% below the pre-programme baseline — usually emerges within 6–12 months as the PM schedule becomes established and asset condition data begins to inform interval optimisation. Facilities that also use MTBF trend monitoring to adjust PM frequencies based on actual failure data typically see faster improvement trajectories.
The emergency work order spike isn’t a random bad period. It’s the predictable outcome of a facility that has been accumulating deferred wear across its asset base without a system to intervene before the wear crosses the failure threshold. The spike arrives when enough assets reach that threshold simultaneously — and it self-perpetuates because the emergency demand consumes the capacity that would have been used for prevention.
The data that predicts the spike is in your CMMS. The MTBF decline is visible. The reactive-to-planned ratio is visible. The assets that are two months away from contributing to the next surge are identifiable today. What most reactive-only facilities lack is not the data — it’s the structured PM programme that converts the data insight into a scheduled work order before the failure occurs.
If your emergency queue is full and your PM tasks keep getting deferred, book a free Cryotos demo to see how the preventive maintenance module and PM compliance dashboard work together to break the reactive cycle — and what the emergency work order volume looks like 90 days after structured PM begins.


Cryotos AI predicts failures, automates work orders, and simplifies maintenance—before problems slow you down.


