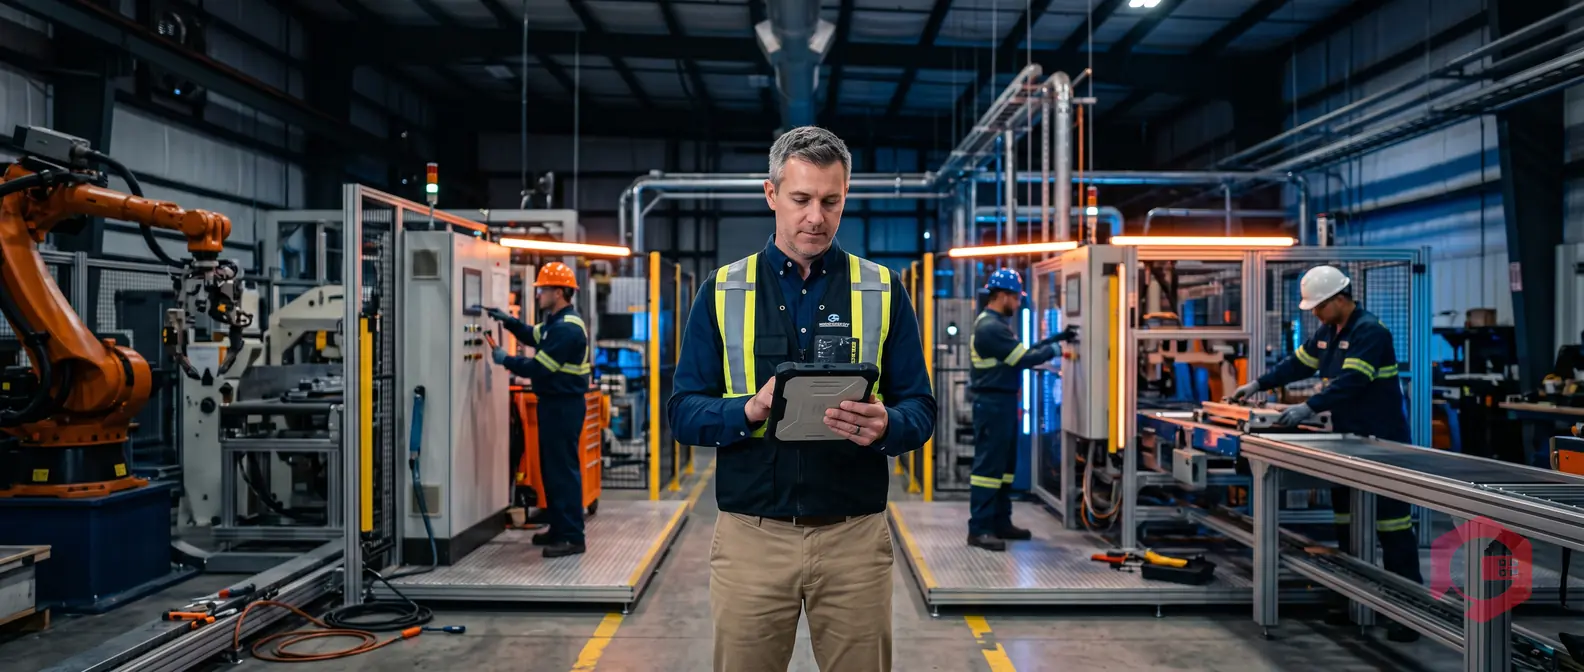
An employee performance dashboard is a real-time digital interface that consolidates key workforce metrics - including login/logout times, time spent per task, work order completion rates, and technician utilisation - into a single, actionable view. For maintenance teams, this dashboard goes far beyond what a standard HR tool offers: it tracks labour productivity at the task level, captures data digitally from mobile apps and QR code scans, and sends automated KPI reports by email on a schedule you define. According to a McKinsey report, organisations that use digital performance tracking reduce unplanned downtime by up to 20% and improve workforce utilisation by 15%. With the right labour task dashboard in place, maintenance managers can make faster decisions, identify underperformance early, and eliminate the manual effort of compiling weekly or monthly reports.
In a maintenance context, an employee performance dashboard is a centralised digital tool that tracks how every technician spends their time - from when they log in at the start of a shift to when they close the last work order of the day. Unlike generic HR performance tools that focus on annual reviews and goal-setting, a maintenance-specific dashboard is built around operational data: task durations, work order completion counts, idle time, and response times to breakdown requests.
The data feeding these dashboards is captured digitally - through mobile app check-ins, QR code scans at equipment locations, and IoT sensor inputs - so there is no manual data entry required. Every action a technician takes in the field is timestamped and attributed to their profile automatically.
HR dashboards measure outcome-level metrics: appraisal ratings, training completion, absenteeism. Maintenance employee performance dashboards measure operational metrics: how long it takes to fix a machine, how many tasks a technician completed versus what was assigned, and whether they were logged in during scheduled shift hours. The granularity is much higher, and the data updates in real time rather than quarterly.
A well-configured maintenance labour dashboard pulls data from several digital sources simultaneously:
Maintenance managers have always needed to know where their people are and what they are working on. For decades, this meant clipboards, paper timesheets, and end-of-shift verbal briefings. The result: inaccurate data, delayed decisions, and no way to spot patterns until problems had already grown expensive.
A dedicated labour task dashboard solves this by giving managers a live view of workforce activity - not a snapshot from last week's spreadsheet, but a view that refreshes as technicians work. According to the Reliable Plant Magazine, maintenance workforce productivity averages only 25-35% of available hours in many industrial facilities - meaning technicians are actively working on equipment less than a third of the time. A dashboard that surfaces idle time, travel time, and unassigned gaps makes it possible to close that gap.
When maintenance KPI reports are compiled manually, the process is slow and error-prone. A supervisor spends hours pulling data from multiple sources - paper logbooks, spreadsheets, email threads - and by the time the report lands in a manager's inbox, the data is already several days old. Decisions made on stale data cost money: parts ordered too late, overtime authorised unnecessarily, underperforming technicians going unnoticed for weeks.
Switching from manual to automated tracking delivers measurable gains across several dimensions:

Not every metric matters equally for every team. The KPIs you choose should reflect the operational priorities of your facility - whether that is minimising equipment downtime, controlling labour costs, or improving preventive maintenance compliance. That said, the following metrics form the core of any effective maintenance employee performance dashboard.
Login and logout tracking gives you a digital record of when each technician was active in the system. This covers shift start and end times, break durations, and any gaps in activity mid-shift. When attendance data is captured automatically through the maintenance mobile app, it replaces the need for separate time-and-attendance systems and eliminates buddy-punching or manual falsification. Managers can set alerts if a technician logs in significantly late or fails to log in entirely, triggering immediate follow-up.
The total time from accepting a work order to marking it complete is one of the most informative metrics on a maintenance dashboard. It tells you whether a technician is working efficiently, whether certain task types consistently take longer than estimated, and where bottlenecks exist - waiting for parts, waiting for approvals, or simply taking longer than peers on identical jobs. Over time, this data builds a benchmark for each task type, making future scheduling more accurate. A facility that tracked task durations across 12 months found technician efficiency improved by 22% simply because managers could identify and address the specific tasks where time was consistently lost.
Task completion rate measures the percentage of assigned work orders a technician closes within the target timeframe. Work order velocity tracks how many tasks a technician completes per day or week. Together, these two metrics reveal capacity and throughput. A technician with a high completion rate but low velocity may be thorough but slow. One with high velocity but a lower completion rate may be rushing and leaving tasks incomplete. The dashboard surfaces both so managers can have specific, data-backed coaching conversations.
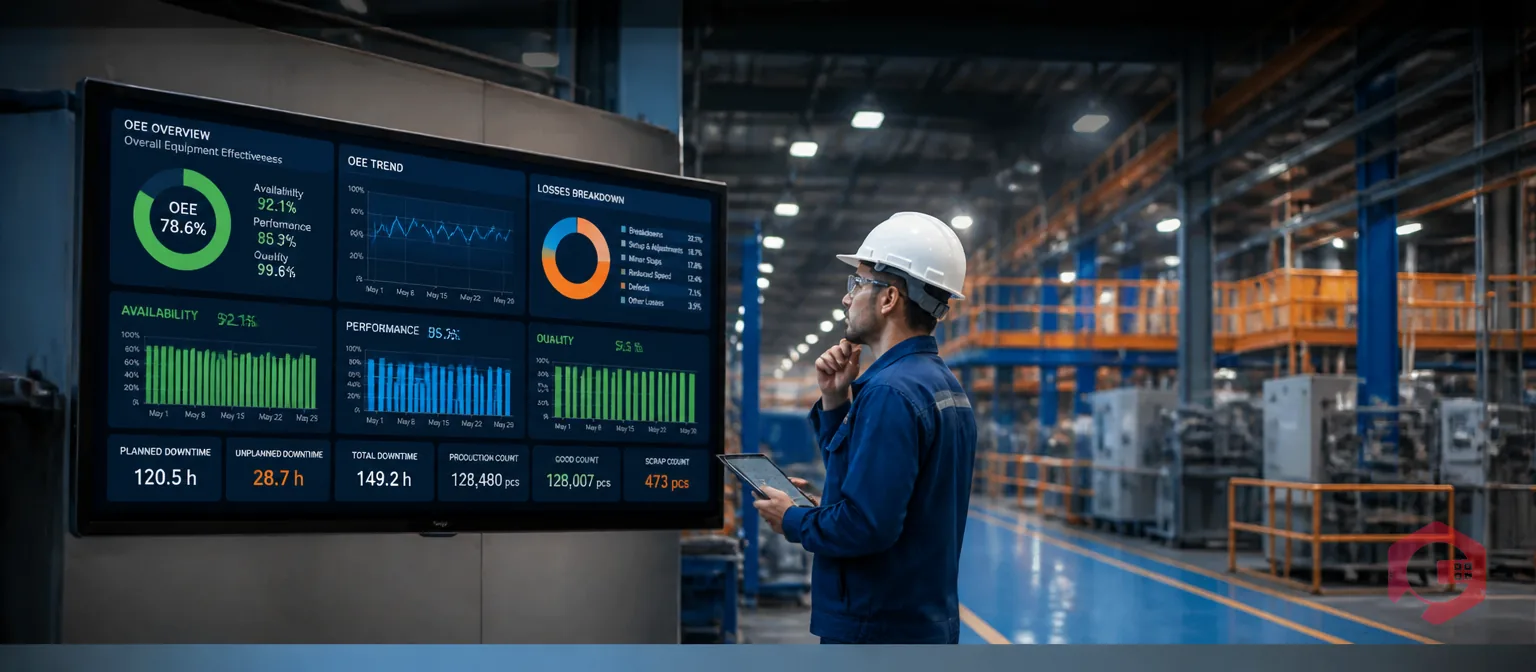
Utilisation rate measures the percentage of a technician's available hours that are spent on productive maintenance activities - as opposed to travel time, idle time, administrative tasks, or waiting. According to Plant Engineering, world-class maintenance departments target a utilisation rate of 55-65% on direct maintenance work, compared to an industry average of 25-35%. The employee performance dashboard makes this metric visible at the individual, team, and department level, so managers can identify whether low utilisation is a scheduling issue, a parts availability issue, or a workforce issue.
Automated KPI email reports are one of the highest-value features of a modern maintenance performance dashboard. Instead of waiting for a supervisor to compile and send a report, the system generates it automatically - on the schedule you define - and delivers it to the right people's inboxes without any manual intervention.
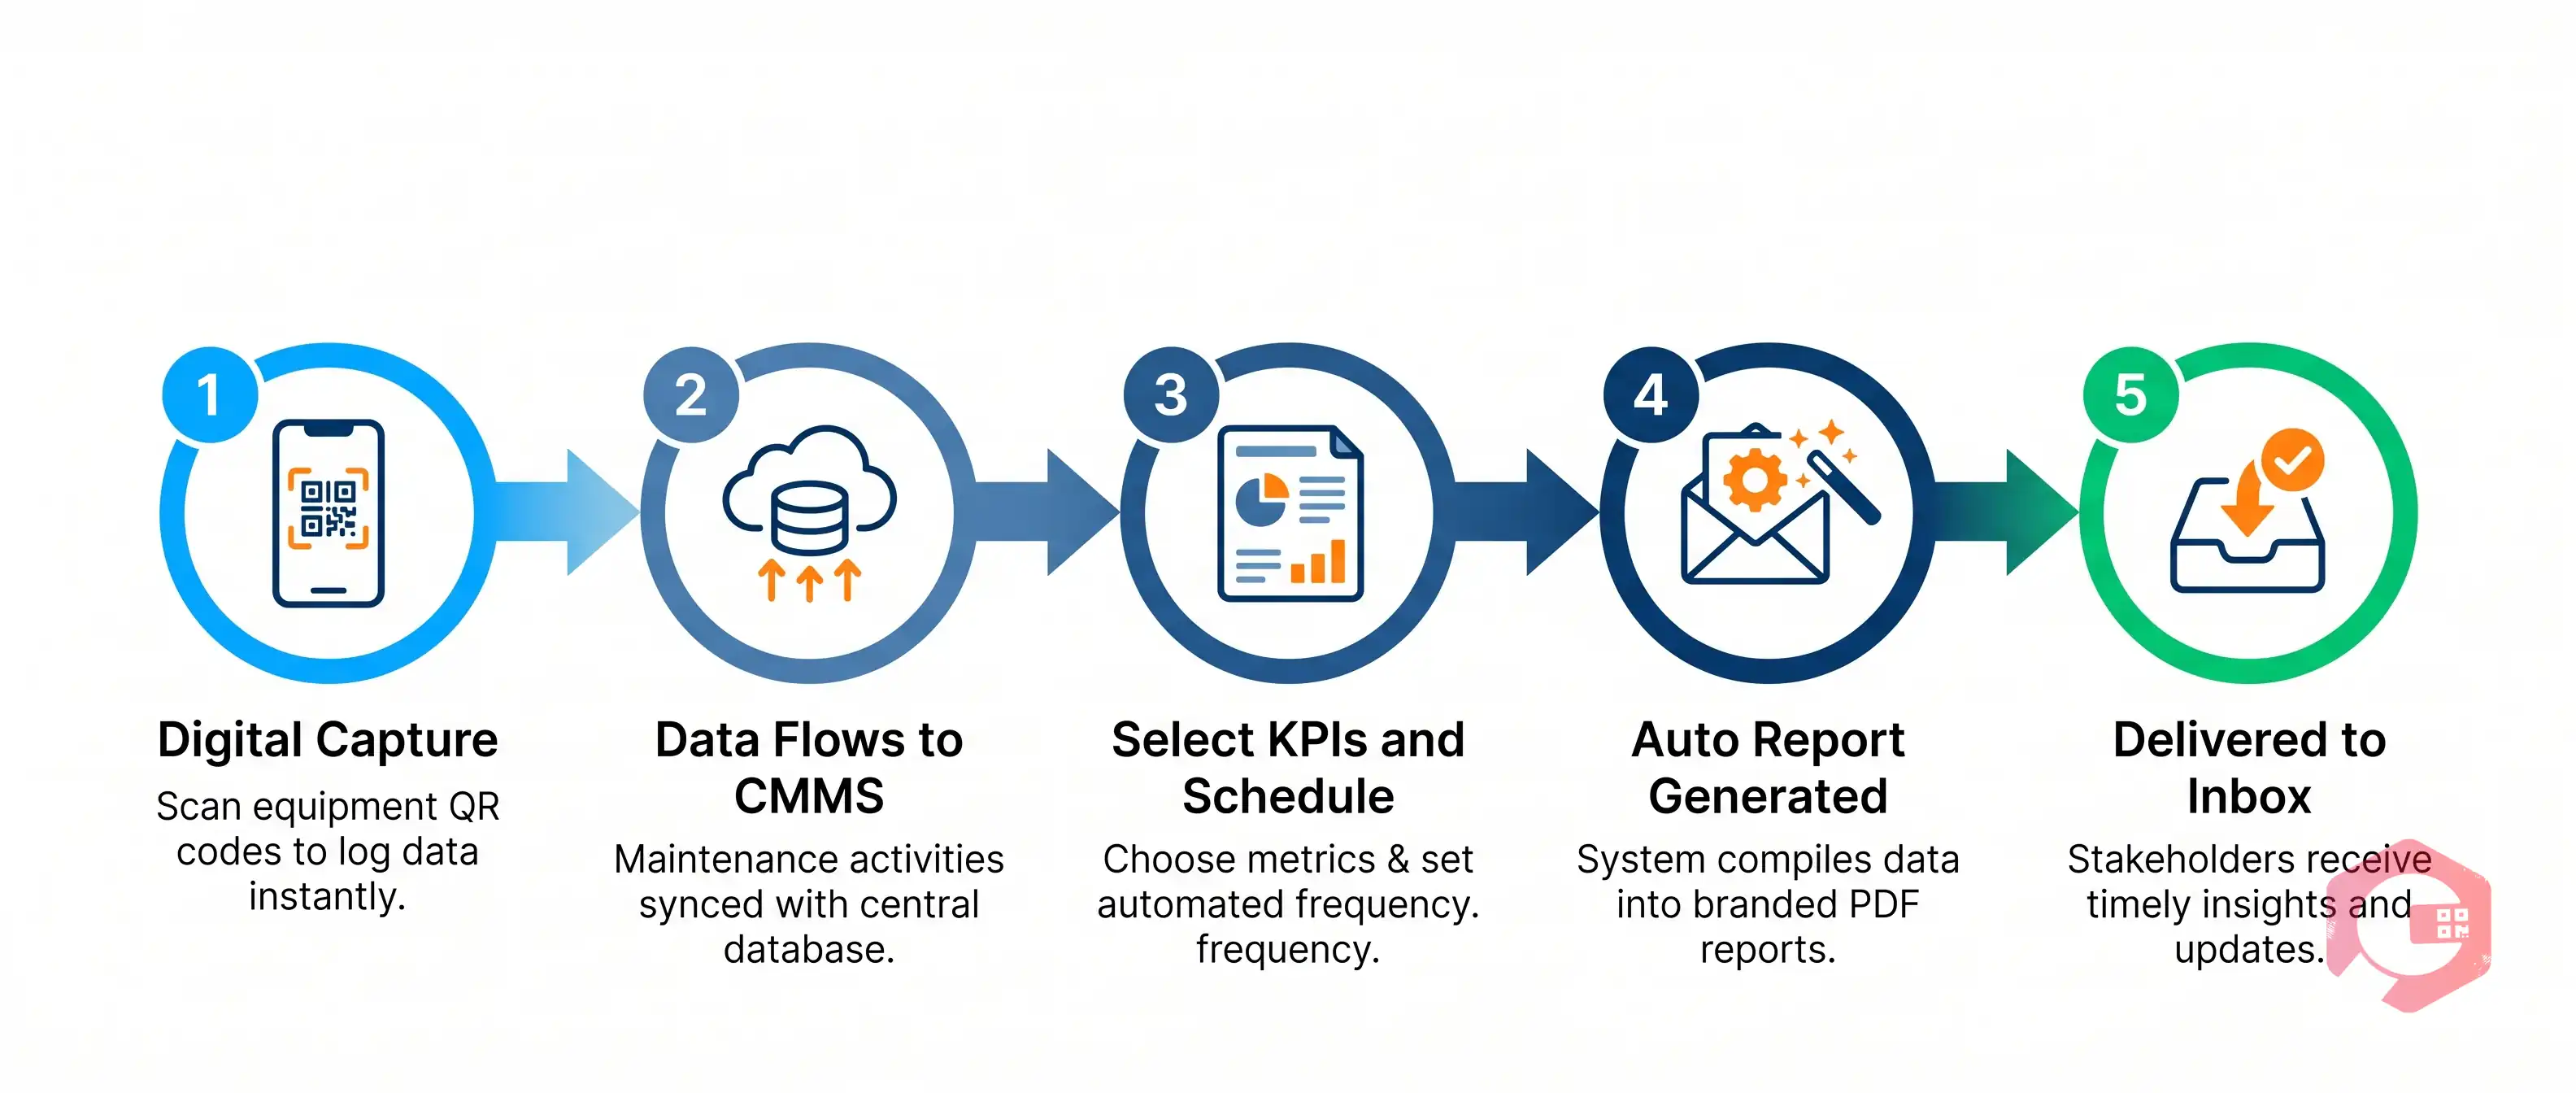
Everything starts with digital data capture in the field. When a technician logs into the maintenance app, scans a QR code at an asset location, accepts a work order, completes a checklist step, or closes a task, that action is recorded with a timestamp and linked to their profile. This happens automatically - the technician does not need to fill in a separate timesheet or report. All of that raw activity data flows into the central CMMS database in real time, where it is processed and surfaced on the performance dashboard.
Once the data is flowing, setting up automated email reports is straightforward. In the report builder, you select the metrics you want to include - login times, task durations, completion rates, utilisation percentages - and define the reporting period (daily, weekly, or monthly). You then specify the recipients: individual managers, department heads, or the full leadership team. The system sends the report at the scheduled time, formatted consistently, with no manual effort after the initial setup. Crucially, these reports are customisable: you can create different report templates for different roles, so a frontline supervisor gets a technician-level breakdown while a plant manager receives a department-level summary.
A typical automated maintenance KPI report delivered by email includes the following sections:
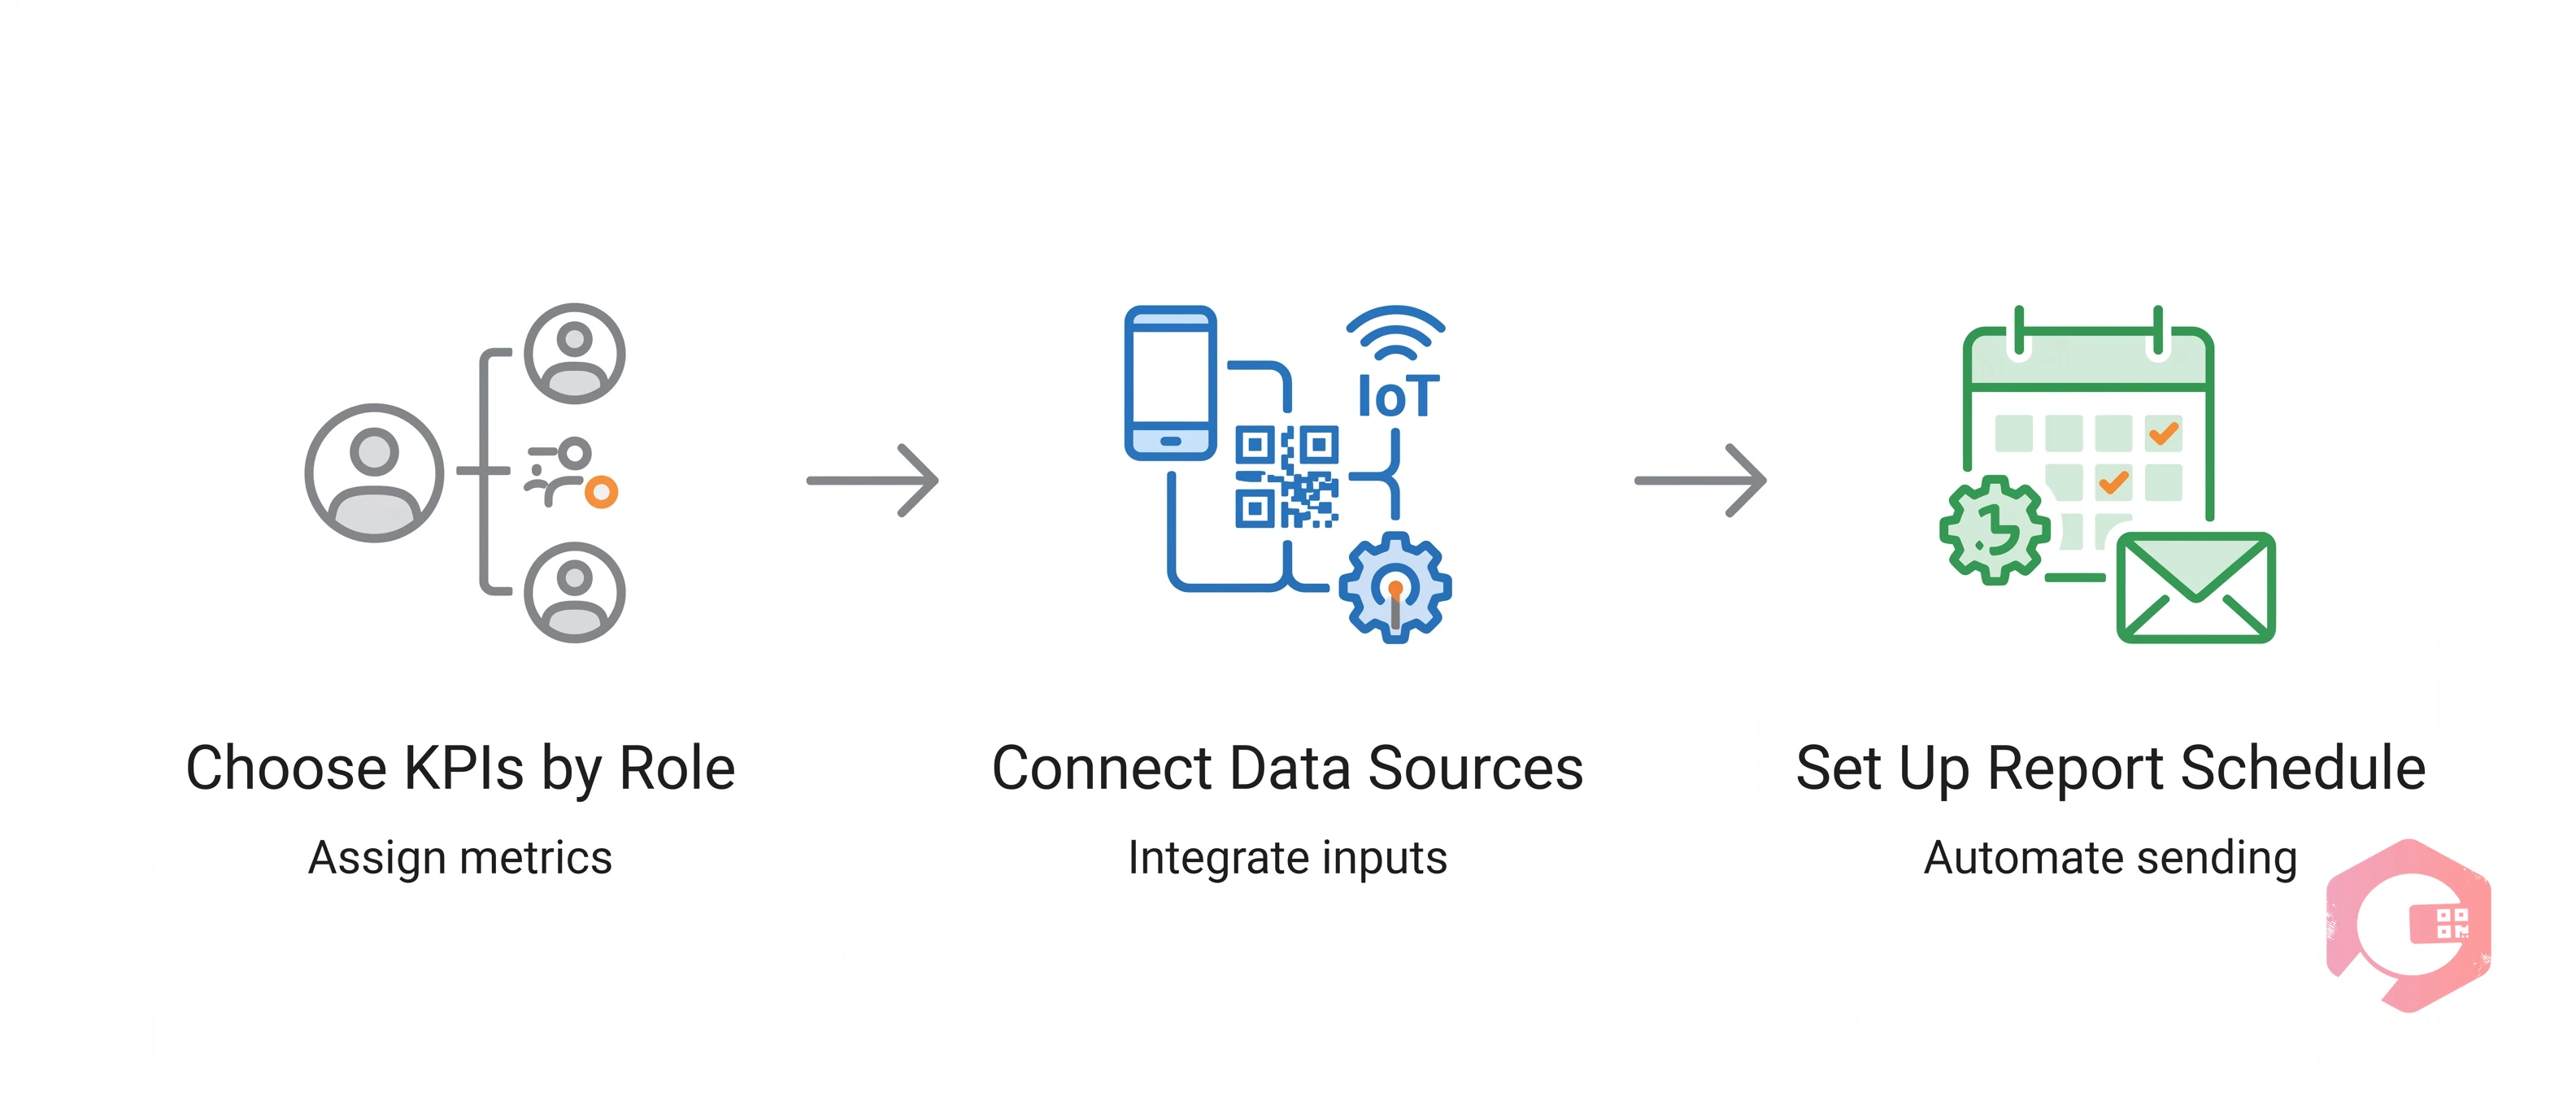
Building an effective maintenance labour task dashboard is not about displaying every metric available - it is about surfacing the right metrics for the right roles. Here is how to approach the setup in a way that makes the dashboard genuinely useful rather than overwhelming.
Start by mapping out who will use the dashboard and what decisions they need to make. A maintenance supervisor needs individual technician data: who is on which task, how long each task has taken, and whether anyone is idle. A plant manager needs a department-level view: overall completion rates, total labour hours, cost per work order. An operations director may only need a monthly summary of utilisation rates and downtime-related labour costs. Building role-specific dashboard views - rather than one generic view shared by everyone - makes the data far more actionable at each level of the organisation.
The dashboard is only as accurate as the data feeding it. To get reliable, real-time data, you need to connect all the digital touchpoints where technician activity happens. This means ensuring every technician uses the maintenance mobile app for all task-related activity, that assets are tagged with QR codes so location and equipment-level data is captured, and that any IoT sensors or SCADA systems feeding the CMMS are properly integrated. When all these sources are connected, the dashboard builds a complete picture of technician activity without requiring anyone to enter data manually.
Once the dashboard is configured, set up your automated report schedule before going live. Define the daily flash report for supervisors (a short summary of the previous day's activity), the weekly team report for department managers, and the monthly executive summary for plant leadership. Getting the right report to the right person at the right frequency means performance data is always in front of decision-makers - not buried in a system that nobody logs into proactively.
To understand the value of a digital dashboard, it helps to compare it directly with the manual reporting approach that most maintenance teams still rely on.

Cryotos CMMS is built around the idea that maintenance teams deserve the same quality of workforce intelligence that larger enterprises invest millions to build. Its Labour Task Dashboard brings together every data point - technician login/logout times, task durations, work order completion rates, checklist adherence - into a single, real-time interface that requires no manual data entry from supervisors or technicians.
Every action a technician takes in the Cryotos mobile app is captured digitally and displayed on the dashboard in real time. When a technician logs in, accepts a work order, scans an asset QR code, completes a checklist, or closes a task, the timestamp and activity detail flow straight into the dashboard. Managers see a live view of every active technician, what they are working on, and how long they have been on each task - without needing to call or message anyone for an update. Location tracking via GPS and BEACON technology adds an additional layer: managers can see not just what a technician is doing but where they are doing it.
Cryotos includes a powerful Report Builder with more than 50 predefined report templates, plus the ability to create fully custom reports from scratch. You can select the exact KPIs you want, define the reporting period, choose the output format, and set an automatic delivery schedule - daily, weekly, or monthly - to any email recipients you specify. The reports are generated and delivered without any manual intervention after the initial setup. This means a plant manager can receive a clean, consistent KPI summary in their inbox every Monday morning, covering the previous week's workforce performance across every department and technician, without a supervisor spending two hours on a Friday afternoon putting it together.
The dashboard is also fully customisable by role: create a technician-level view for frontline supervisors, a department summary for plant managers, and a cost and utilisation overview for operations directors. Every view pulls from the same underlying data, so figures are always consistent regardless of which level of the organisation is looking at them. For teams using preventive maintenance schedules, the dashboard also surfaces compliance rates - showing which scheduled tasks were completed on time and which were deferred - adding a compliance layer to the standard performance view.
The most valuable KPIs for a maintenance employee performance dashboard include login/logout times and shift attendance, time spent per task and work order, task completion rate, work order velocity (tasks completed per day or week), technician utilisation rate, preventive maintenance compliance percentage, and mean time to repair (MTTR). The right mix depends on your team's size and operational priorities, but these metrics cover attendance, productivity, and quality across any maintenance workforce.
Automating KPI reports requires a CMMS with a built-in report builder and scheduled delivery feature. Set up the report template with your chosen metrics, define the reporting period (daily, weekly, monthly), and specify the email recipients. Once configured, the system generates and sends the report on schedule with no manual effort. Cryotos CMMS offers exactly this capability, with over 50 predefined report templates and full customisation options for metrics, periods, and recipients.
Yes - a well-designed maintenance performance dashboard allows you to create role-specific views and report templates. Frontline supervisors can see individual technician data, department managers see team-level aggregates, and plant leadership sees facility-wide summaries. This ensures that each stakeholder gets the level of detail they need without being overwhelmed by data that is not relevant to their decisions. Cryotos supports multi-level dashboard views with drill-down capability from organisation level down to individual asset level.
Digital data capture for maintenance employee tracking includes: mobile app login and logout timestamps, work order acceptance and completion times, QR code scan data at asset locations, digital checklist completion records, GPS and BEACON location data, IoT sensor response records, and communication logs within work orders. All of this data is captured automatically as technicians work in the field - no manual timesheet entry is required, which improves both accuracy and compliance.
Login/logout tracking gives maintenance managers an accurate, tamper-proof record of when each technician was active and for how long. This data enables fairer shift scheduling, identifies patterns of late arrivals or early departures, helps verify overtime claims, and gives supervisors an early warning if attendance issues are building before they become serious. When combined with task-level data, login times also help managers understand whether low completion rates on specific shifts are a workload issue or an attendance issue - two very different problems requiring different responses.
An employee performance dashboard built specifically for maintenance teams does something no generic HR tool can: it connects real-time field activity - login times, task durations, QR code scans, checklist completions - directly to the KPIs that drive operational performance. When that data flows automatically into scheduled email reports, maintenance managers get the intelligence they need without the manual effort that has historically made this kind of reporting impractical.
The shift from paper timesheets and spreadsheet-compiled reports to a live, automated, customisable dashboard is not just a technology upgrade - it is a management upgrade. It means decisions get made on accurate, current data rather than best guesses. Technicians are evaluated on what they actually did rather than what a supervisor remembers. And performance trends become visible weeks before they become problems.
If your maintenance team is still relying on manual reporting to track employee performance, the gap between where you are and what is possible is larger than it might seem. Cryotos CMMS gives you the labour task dashboard, automated report builder, and real-time digital tracking to close that gap - without requiring your supervisors to spend their time on data entry. Book a demo with Cryotos and see exactly what your maintenance workforce data looks like when it is captured digitally and delivered automatically to the people who need it.


Cryotos AI predicts failures, automates work orders, and simplifies maintenance—before problems slow you down.


